数据分析python基础实战分析
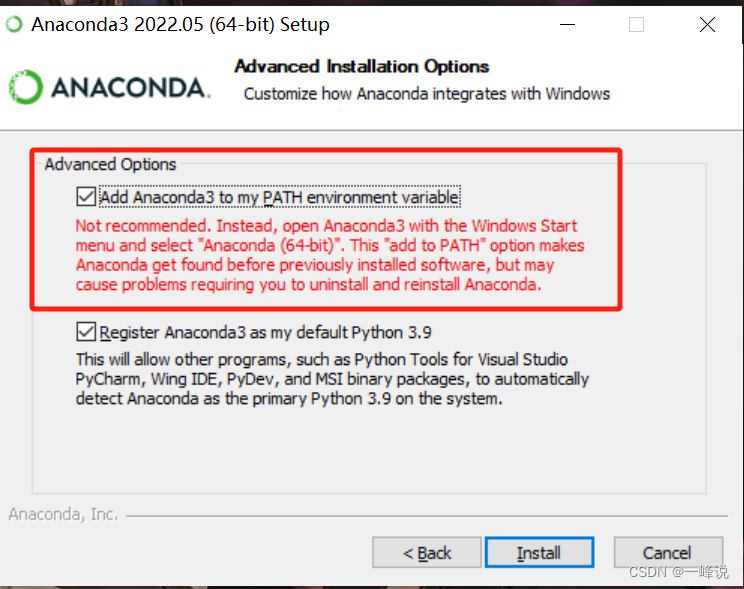
安装python,建议安装Anaconda
【Anaconda下载链接】https://repo.anaconda.com/archive/
记得勾选上这个框框
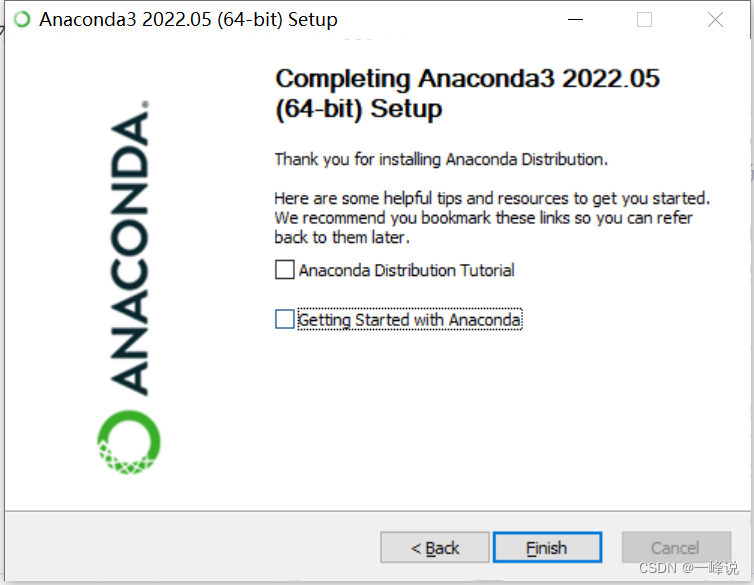
安装完后,然后把这两个框框给取消掉再点完成
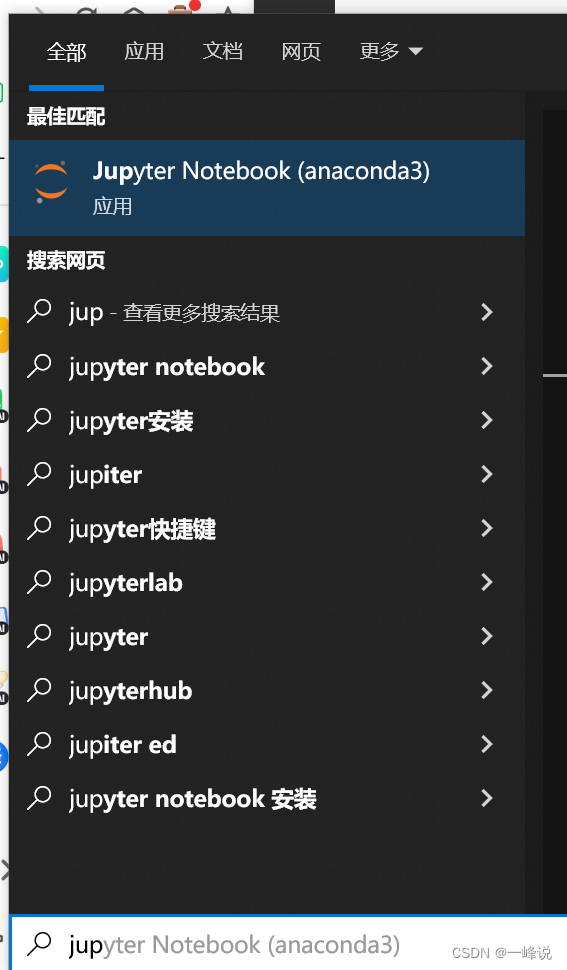
在电脑搜索框输入"Jupyter",牛马启动!
等待终端运行 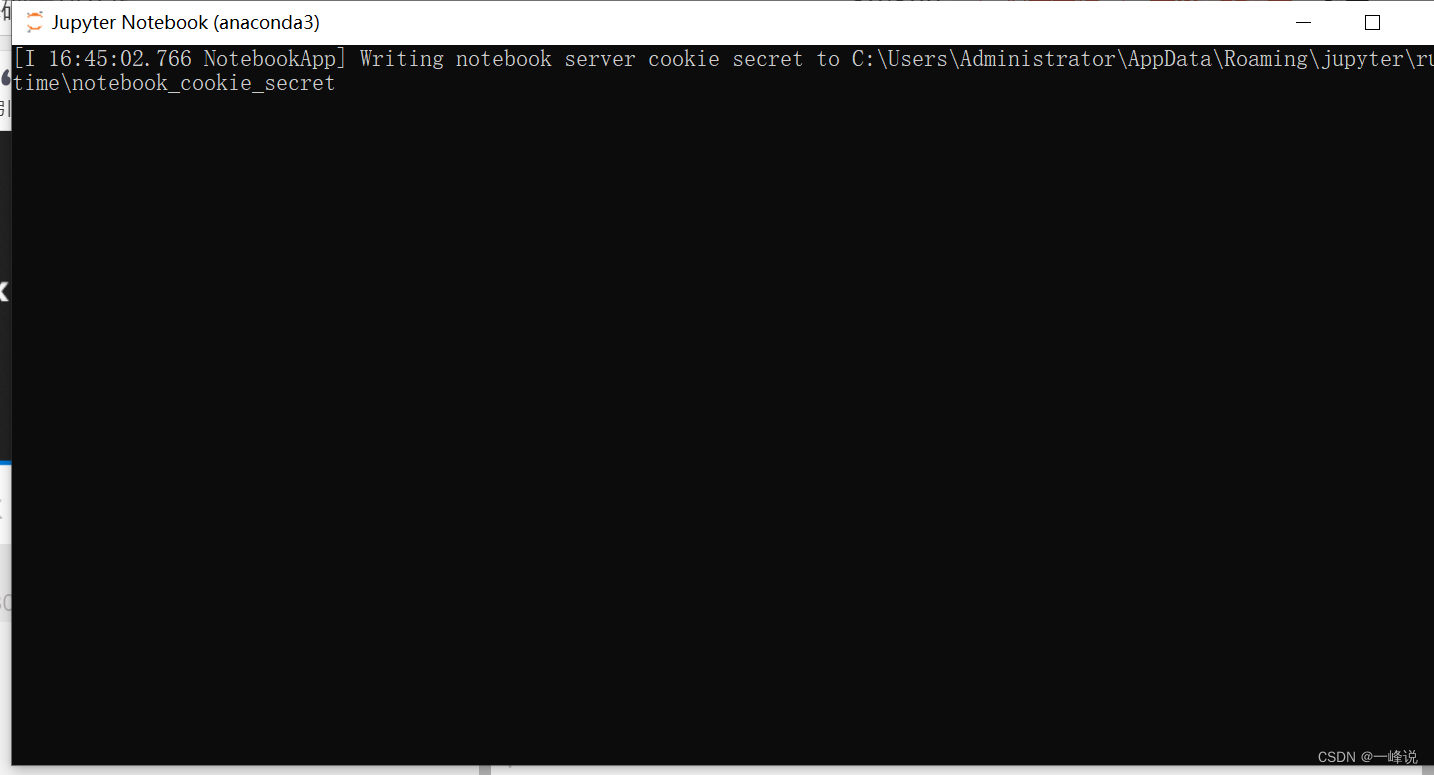
运行完后会自动弹出网页
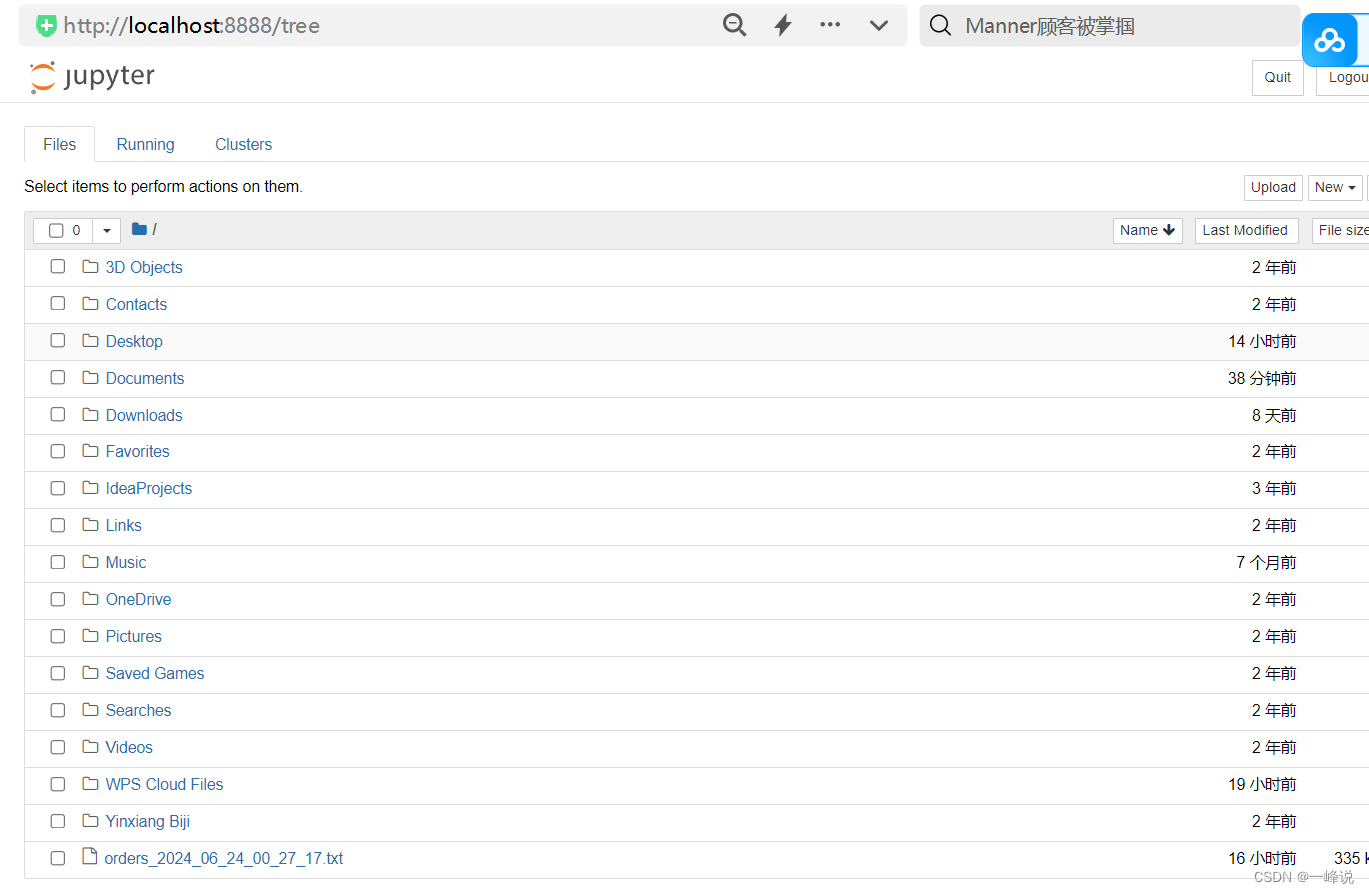
这里建议设置一下目录,以便后续创建的所有文件容易找到:
新建一个目录"python练习"

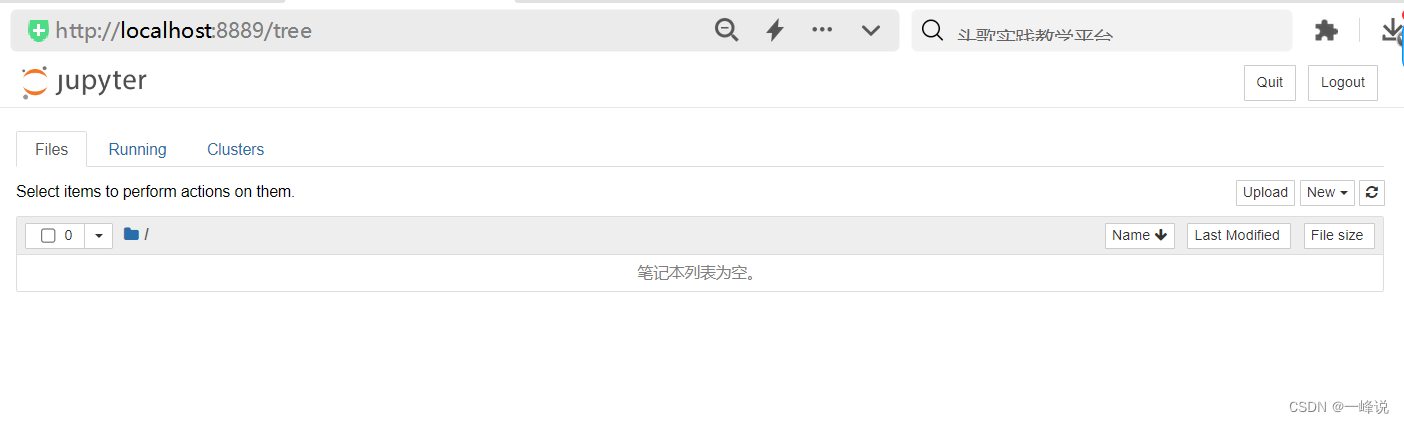
输入"jupyter notebook"然后回车,就会运行终端弹出浏览器
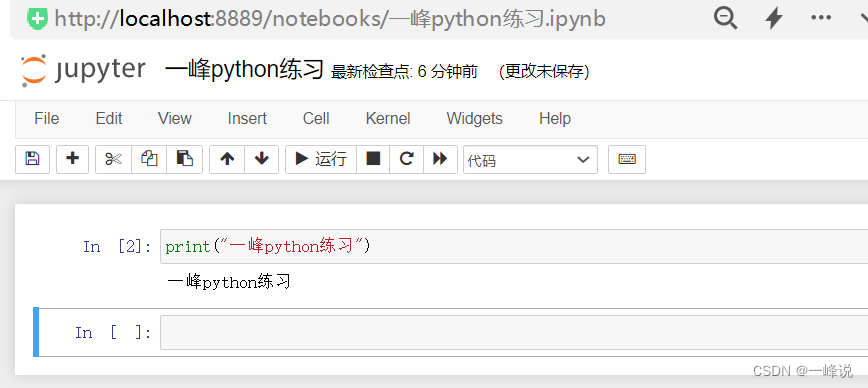
这样就得到一个干净的笔记本啦,可以右上角new新建python文件写代码运行
shift + enter 运行
数据类型
常见有整型int,浮点型float,布尔型bool,字符串string,列表list,字典dict,根据业务变量需要而变化。
变量与赋值
变量 = 数值,将数值赋值给变量
数据结构
list列表:数据量级大的时候,将多个数据一同存储到一个变量,方便后面使用。
dict字典:{key(唯一):值},如果懂什么叫映射就理解dict。excel里的表头就相当于key,如果列的表头带着多个值可以这样写:{key : [ 值1, 值2, 值3] }表示一列,key作表头,有3行值的数据;如果是多列可以写成:{key1 : [ 值1, 值2, 值3] ,key2 : [ 值1, 值2, 值3] ,key3 : [ 值1, 值2, 值3] } ;还有这种 [{key1 : 值1 , key2 : 值2 ,key3 : 值3 }, {key1 : 值1 , key2 : 值2 ,key3 : 值3 }, {key1 : 值1 , key2 : 值2 ,key3 : 值3 }]
数据结构检索与访问
检索:列表0,3 代表从第0个开始,共3个
访问:字典'key' 返回对应key的值
分析数据过程:
1.取出数据,赋值给一个变量。例如有个字典ad_list, ad_1 = ad_list0,打印ad_1
2.处理重复数据,例如del ad_1'成交金额',打印ad_1
3.处理异常值,ad_1'GMV' = ad_1'GMV'/100, 打印ad_1
4.发现缺少某些指标,例如ROI, ad_1'ROI' = round(ad_1'GMV'/ ad_1'消耗',2),打印ad_1,并且roi保留两位小数
5.查看广告策略,例如 ad_1'商品名称' = ad_1 '广告计划名称'.split('')0, ad_1'人群标签' = ad_1 '广告计划名称'.split(' ')1, ad_1'用户年龄' = ad_1 '广告计划名称'.split('')2, ad_1'用户等级' = ad_1 '广告计划名称'.split('')3
for循环
bash
for item in list:
	print(item)

//range()范围,这里3的意思是会产生一个0到3的序列范围,左闭右开
//len()长度,list里面有多少个数值
for i in range(len(list)):
	print(list[i])
如果数据太长,可以用txt保存在用python进行读取:
bash
with open('历史数据.txt', 'r', encoding = 'utf-8') as f:
	history = f.readline()
//打印结果为字符串
history
//将字符串转换成list
history = eval(history)
history
//如果history需要整合其他list,ad_list会追加到history后面
history.extend(ad_list)
IF语句
bash
if 条件:
	do
else:
	do
if 条件:
	do
elif 条件:
	do
else:
	do
bash
#如果要取出ROI大于1的数据
roi_list = []
for i range(len(hisotry)):
	if history[i]['roi']>=1:
		print(history[i])
		roi_list.append(history[i])
	else
		pass
#打印
roi_list
自定义函数
#参数输入,有返回值
bash
#f''字符串可以在字符串中嵌套变量
def nooddle_machine(water, flour):
	print('搅拌......')
	print(f'{water}和{flour}已经变成面团')
	print('正在挤压面团')
	return f'由{water}和{flour}制作而成的面条已经ok了'
#使用
bowl = nooddle_machine('水','面粉')
bowl
#没有输入参数,但有返回值
bash
import datetime
def yesterday():
	date = datetime.datetim.now() -- datetime.timedelta(days=1)
	return date.date()
yesterday = yesterday()
yesterday
#有输入参数,但没有返回值
bash
def upload_data(date):
	print(f'已经将{date}的数据上传至数据库')
upload_data('2024-06-25')
#没有输入参数,没有返回值
bash
def upload_data():
	date = yesterday()
	print(f'已经将{date}的数据上传到数据库')
批量处理:
bash
def batch_data(data_list):
	for i in range(len(data_list)):
		process_data(data_list[i])

#比方说选出ROI大于1的数据
def filter_roi(data_list):
	roi_list = []
	for i range(len(data_list)):
		if data_list[i]['ROI'] >=1:
			print(data_list[i])
			roi_list.append(data_list[i])
	else:
		pass
	return ros_list
模块与包
import pandas as pd
Series/DataFrame
Series: 属于一维的
bash
# name相当于表头
# index索引
s1 = pd.Series(['a','b','c'],name = 'test', index=['1','2','3'])

#如果需要将两个Series整合
pd.concat([s1],[s2], axis=1)
DataFrame: 二维, 本质上是字典,里面的值是列表,可以理解成是Series构成的
pandas读取和导出
读取
bash
import pandas as pd
data = pd.read_excel(r'路径\文件.xlsx',converters={'uid': str, 'id':str })
//查看数据
data.info()
#另一种方式
data['id'] = data['id'].astype(str)
导出
bash
#index = False 可以去掉导出后excel的索引
data.to_excel('test excel.xlsx', index = False)

data.to_csv('test csv.csv', encoding='GB18030')//文字能识别成功,但是数值会被Excel使用科学计数法代替
data.to_csv('test csv.txt', sep='\t')
访问与筛选
访问
访问列:data'字段名'; 如果是多个字段->data\['字段名1','字段名2','字段名3']
访问行:data.iloc1; data.iloc1:6,左闭右开返回2到5行数据; data.iloc1:6'字段名',返回2到5行这个字段的数据
筛选
主要是通过True and false来判断
datadata\['progress' >= 100000 ]
去重筛选
data.drop_duplicates(subset='uid', keep ='last', inplace=True)
轴/合并/连接
轴 :axis=0是行,axis=1是列,axis相当于方向
合并 :concat_demo = pd.concat(data, data2, axis=0)
连接 :pd.merge(左表, 右表, how='inner', on='uid')
如果名字不一样:
rename:左表.rename(columns = {'uid': 'user_id' }, inplace = True)
pd.merge(左表, 右表, how='inner', left_on='uid', right='user_id')
排序与匿名函数
排序
data.sort_values('uid','ctime', ascending = True, False)
匿名函数
add2 = lambda x: x+5
add3 = lambda x, y : x+y
分组/聚合/转换
分组 :分组只会创建一个object,再用object去调用count方法
data_manager = data.groupby('字段')->data_manager.count()
聚合
先groupby后再调用聚合方法
data_manager\['消耗','GMV'].sum()
data_manager\['消耗','GMV'].agg('max','min')//看每个字段的最大和最小
data_manager.agg({'消耗': 'max','min', 'GMV' : 'min'})
算最大值和最小值的差值
data_manager\['消耗','GMV'].agg(lambda x: x.max() - x.min())
转换
data_manager'GMV'.transform(func='sum')
同效果:data_manager'GMV'.agg(func='sum')
组内排名:
#每个投放日期内,广告计划ID和GMV排名
bash
history['每日GMV排名'] = history.groupby('投放日期')['GMV'].rank(method = 'dense', ascending =False)
history['每日GMV排名'] = history['每日GMV排名'].astype(int)
history.head(20)
字符串,数据清洗
split::用什么符号分割
python
history['广告计划名称'].str.split('_', expand=True),返回一个DataFramecontains:字符串中包含了什么内容
python
`history[history['商品名称'].str.contains('玩转'),返回值是布尔`值].reset_index(drop=True)replace :
举例,将《》两个符号改成【】
python
history['商品名称'].str.replace('《','【').str.replace('》','】')结合正则表达式,更简洁的方式:
正则表达式在线测试网站:https://regex101.com/
python
history['商品名称'].str.replace(r'《(.*?)》',r'【\1】',regex=True)extract:提取一个数据里面的部分内容
python
history['广告计划名称'].str.extract(r'(.*?)_')绘图
折线图:
python
history.groupby('投放日期')['GMV'].sum().plot(kind='line', x='投放日期', y='GMV')

#如果想导入中文字体
import matplotlib.pyplot as plt
plt.rcParams['font.family'] = 'SimHei'柱状图:
python
history.groupby('广告计划ID')['GMV'].sum().plot(kind='bar', x='广告计划ID', y='GMV')水平柱状图:
python
history.groupby('广告计划ID')['GMV'].sum().plot(kind='barh', x='广告计划ID', y='GMV')直方图:
python
history['GMV'].plot(kind = 'hist')散点图:
python
history.plot(kind ='scatter', x='GMV', y='消耗')饼图:
python
history.groupby('广告计划ID')['GMV'].sum().plot(kind ='pie')PyGWalker
安装 :在电脑CMD输入
pip install -i https://pypi.tuna.tsinghua.edu.cn/simple pygwalker
使用:
python
import pygwalker as pw
pw.walk(history)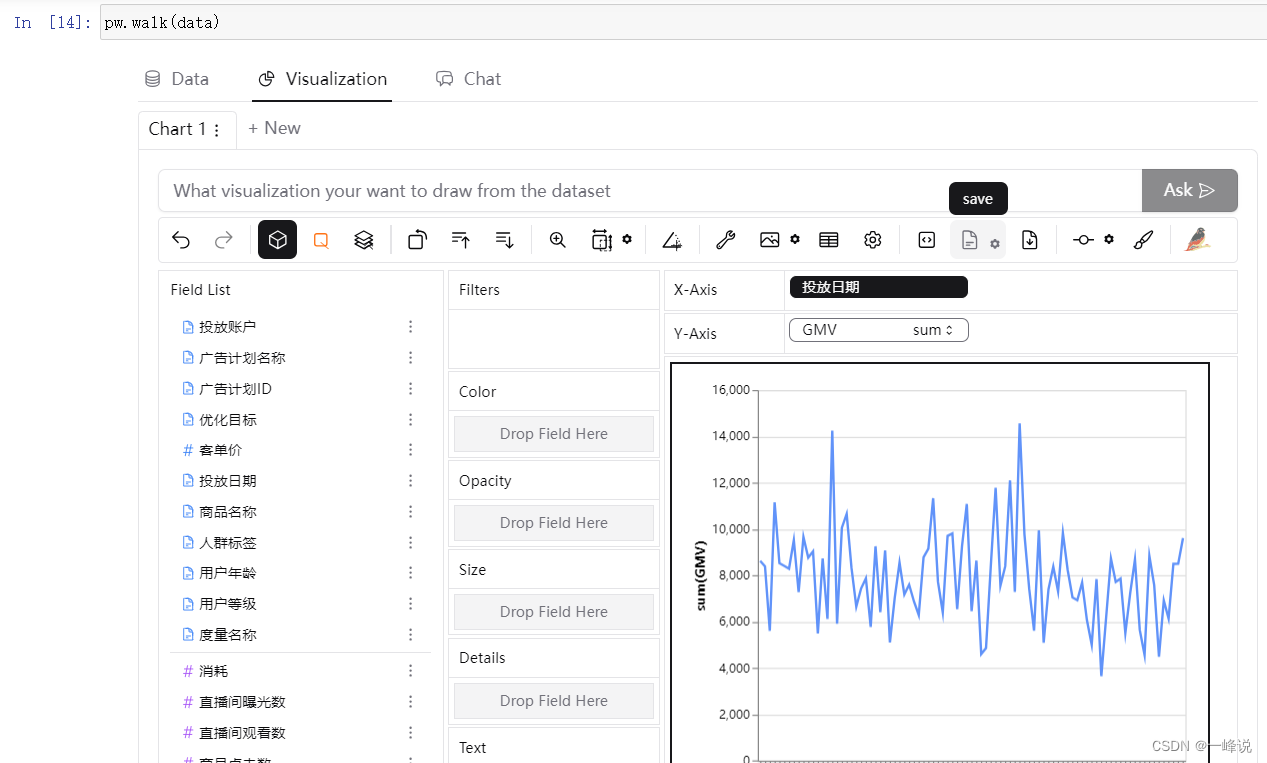
map/apply/applymap
map: 对列或行进行处理
将GMV列的数据转换成int型
python
history['GMV'].map(lambda x : int(x))与apply不同的可以用字典:
history'人群标签'.map({'数据分析' : '数分'})
apply:
如果操作的数据类型式DataFrame,则使用apply或者applymap。
python
#举例,因为这个是从左往右相加,所以要用axis进行定义,args是对系数设置 :
coe = None
if condition1:
	coe = 0.8
elif condition2:
	coe = 0.5
elif condition3:
	coe = 0.3

def demo(x, coe):
	formular = x['客单价'] + x['消耗'] +['直播间消耗']
	formular = formular + x['GMV']
	return formular * coe

history.apply(demo, axis=1, args=(coe,))applymap:所有字段都需要做同一个处理,其实apply也能做到
办公自动化:
背景:老板需要提供抖音平台上男士护肤品牌的带货视频,将已有的excel数据转换成word文档展示给老板看。
首先明确python怎么操作word,再确认将excel整合到word的格式。
CMD安装python-docx
python
pip install -i https://pypi.tuna.tsinghua.edu.cn/simple python-docx1.导入pandas as pd获取excel数据
python
import pandas as pd
video_list = pd.read_excel('video_list.xlsx')
speech_text = pd.read_excel('speech_text.xlsx')

#检查数据,用vide_list.info()发现id为转换成整型,应该需要字符串
video_list['AwemeId'] = video_list['AwemeId'].astype(str)
speech_text['VideoId'] = speech_text['VideoId'].astype(str)

#将两个表连接一起
merge = pd.merge(video_list, speech_text, how = 'inner', left_on ='AwemeId', right_on ='VideoId')
创建一个空的document:
python
from docx import Document
document = Document()
记得每次要新建的文件要重新赋值Document()
python
document = Document()
for i in range(len(merge)):
	#如果遇到同一个品牌的时候无须重复创建,i == 0 防止第一条查找时报错
    if merge.iloc[i]['品牌'] != merge.iloc[i-1]['品牌'] or i == 0:
        document.add_heading(merge.iloc[i]['品牌'],level = 1)

    document.add_heading(merge.iloc[i]['视频标题'],level = 2)

    document.add_paragraph(f'达人昵称:{merge.iloc[i]["BloggerName"]}')
    document.add_paragraph(f'视频链接:douyin.com/video/{merge.iloc[i]["AwemeId"]}')
    document.add_paragraph(merge.iloc[i]['视频文案'])
document.save('demo.docx')
探索分析
背景:得到一组弹幕数据,怎么做内容分析
数据处理
导入
python
import pandas as pd

user_level = pd.read_excel('user_level.xlsx')
#将本地文件整合
import os
excel_list = []

for item in os.listdir('./'):
    if 'xlsx' in item and 'user_level' not in item:
        excel_list.append(item)

danmu = pd.DataFrame()
for item in excel_list:
    excel = pd.read_excel(item,converters = {'id': str, 'uid' : str, 'Awemeid' : str})
    #合并前新建一个字段区分每个表
    excel['视频标题'] = item
    danmu = pd.concat([danmu, excel], axis=0)
时间处理
时间维度
python
danmu['弹幕创建时间'] = danmu['ctime'].map(datetime.fromtimestamp)

danmu['年'] = danmu['弹幕创建时间'].map(lambda x: x.year)
danmu['月份'] = danmu['弹幕创建时间'].map(lambda x: x.month)
danmu['星期'] = danmu['弹幕创建时间'].map(datetime.isoweekday)
danmu['小时'] = danmu['弹幕创建时间'].map(lambda x: x.hour)
时间可视化分析
python
#准备画图工具,字体设置微软雅黑
import matplotlib.pyplot as plt
plt.rcParams['font.sans-serif'] = ['SimHei']

danmu_year = danmu[danmu['年']==2022]
danmu_year.groupby('月份')[['id']].count().plot()
danmu_year.groupby('月份')[['uid']].nunique().plot()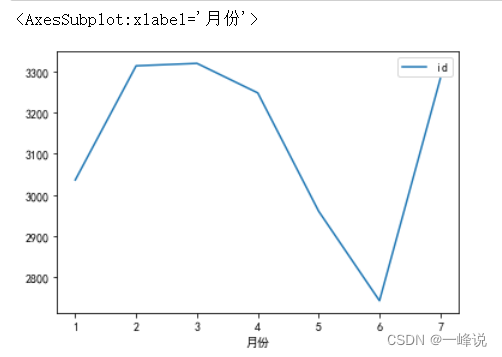
python
danmu_year.groupby('星期')[['id']].count().plot()
danmu_year.groupby('星期')[['uid']].nunique().plot()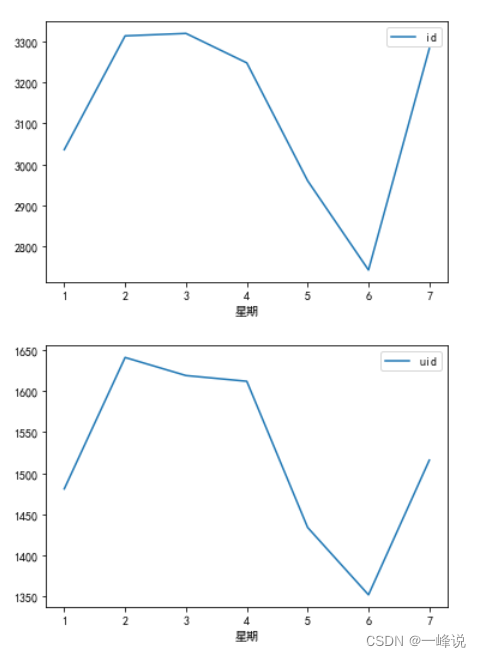
python
danmu_year.groupby('小时')[['id']].count().plot()
danmu_year.groupby('小时')[['uid']].nunique().plot()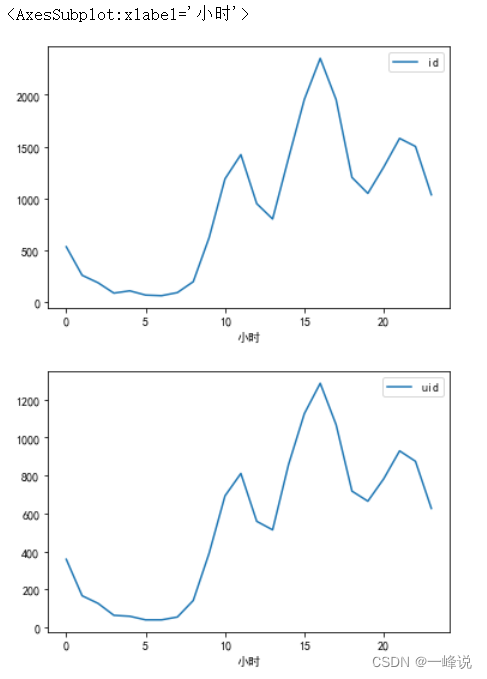
用户画像:
用户处理
python
#统计用户弹幕的数
danmu['用户弹幕数'] = danmu.groupby('uid')['id'].transform('count')
#想加上另一个表的level字段,记得id号on的时候类型要保持一致,这里是字符串
user_level['uid'] = user_level['uid'].astype(str)
danmu_level = pd.merge(danmu, user_level, on = 'uid', how = 'inner')
弹幕内容
python
#按降序排弹幕数最多的用户,新建一个id列来存储count数
danmu_level.groupby('uid')[['id']].count().sort_values('id', ascending=False)
python
#限制300行数据,选定一个id用户来看
pd.set_option('display.max_rows',300)
danmu_level[danmu_level['uid'] == '6653485828143602809']
等级分布
python
#画出用户等级柱状图
danmu_level.groupby('level')[['id']].count().plot(kind='bar')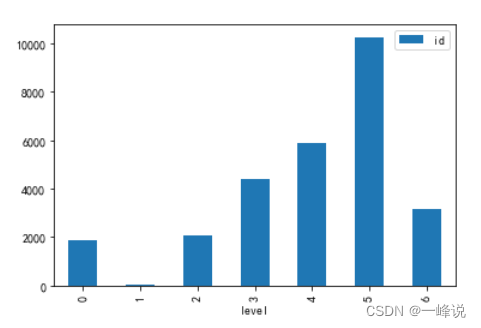
python
#看用户的唯一值,可用于验证假设
danmu_level.groupby('level')[['uid']].nunique().plot(kind='bar')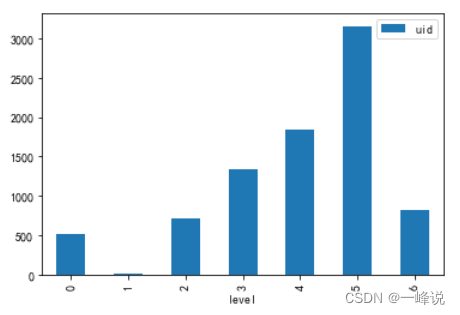
视频内容
视频内容处理
python
from time import strftime
from time import gmtime

danmu['视频进度'] = danmu['progress'].map(lambda x: strftime('%H:%M:%S',gmtime(x)))
#取时和分
danmu['视频进度【时分】'] = danmu['视频进度'].str[:5]
视频内容分析
python
p1 =  danmu[danmu['视频标题']=='1、系统认识数据分析.xlsx']
p1.groupby('视频进度【时分】')[['id']].count().sort_values('id',ascending=False)

#查看某时分的视频内容
p1[p1['视频进度【时分】'] == '00:11']
总结:
分析一个数据的时候可以从3个维度,时间,画像,内容进行分析, 时间维度可以提出猜想与假设,画像和内容可以判断出某些真实用户的情况,即可以提出某些结论;具体执行过程可以分为3步,1.先进行数据处理,2.再拿处理好的数据进行分析,3.提出假设,再看实际内容验证假设。