文章目录
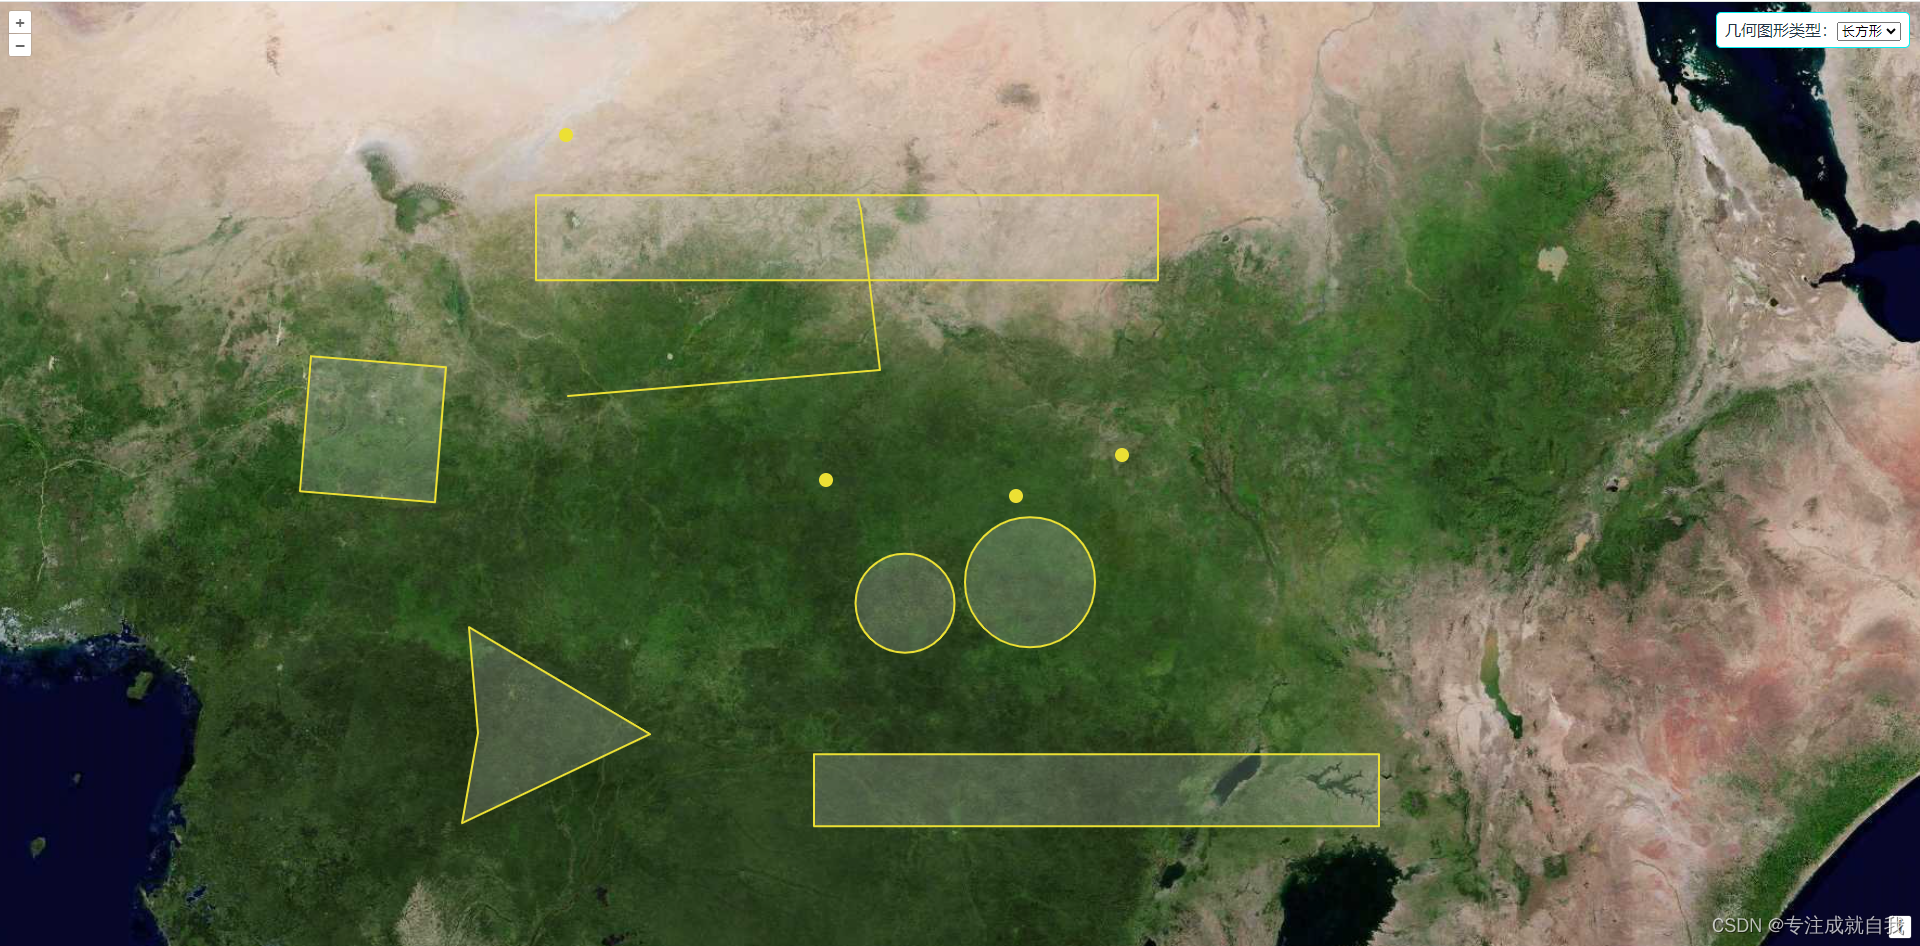
1.实现效果
绘制点、线、多边形、圆、正方形、长方形
2.实现步骤
- 引用openlayers开发库。
- 加载天地图wmts瓦片地图。
- 在页面上添加几何图形绘制的功能按钮,使用下拉列表(select)设置几何图形绘制功能项,并设置其样式。其中,当"几何图形类型"为"无"时清除当前绘制的所有图形。
3.示例页面代码
<template>
  <div id="map" class="imap">
  </div>
  <div class="menu">
    <label>几何图形类型:</label>
    <select id="type" v-model="typeSelect" @change="typeSelectOnChange">
      <option value="">无</option>
      <option value="Point">点</option>
      <option value="LineString">线</option>
      <option value="Polygon">多边形</option>
      <option value="Circle">圆</option>
      <option value="Square">正方形</option>
      <option value="Box">长方形</option>
    </select>
  </div>
</template>
3.基本几何图形绘制的关键代码
<script setup>
  // vue+openlayers之几何图形交互绘制基础与实践

  import {
    onMounted,
    ref
  } from 'vue'
  import 'ol/ol.css';
  import {
    Map,
    View
  } from 'ol';
  import TileLayer from 'ol/layer/Tile';
  import XYZ from 'ol/source/XYZ';
  import VectorLayer from "ol/layer/Vector";
  import VectorSource from "ol/source/Vector";
  import {
    Circle,
    Fill,
    Stroke,
    Style,
    Text
  } from "ol/style";
  import Draw, {
    createRegularPolygon
  } from "ol/interaction/Draw";
  import {
    LinearRing,
    LineString,
    MultiLineString,
    MultiPoint,
    MultiPolygon,
    Point,
    Polygon,
  } from 'ol/geom';

  var map = null;
  var draw; // 绘制对象
  // 实例化一个矢量地图vector
  var source = new VectorSource({
    wrapX: false
  })
  var vector = new VectorLayer({
    source: source,
    style: new Style({
      fill: new Fill({ //填充样式
        color: 'rgba(225,225,225,0.2)'
      }),
      stroke: new Stroke({ //边界样式
        color: '#ece034',
        width: 2
      }),
      image: new Circle({ //点要素样式
        radius: 7,
        fill: new Fill({
          color: '#ece034'
        })
      }),
    })
  })
  onMounted(() => {
    map = new Map({
      target: 'map',
      layers: [
        new TileLayer({
          source: new XYZ({
            url: "你的天地图地址",
            attributions: '影像底图',
            crossOrigin: 'anonymous',
            wrapX: false //如果设置为 false,地图在横向滚动到最右侧时不会出现重复的地图;
          }),
          preload: Infinity
        })
      ],
      view: new View({
        //地图初始中心点
        center: [0, 0],
        minZoom: 2,
        maxZoom: 18,
        zoom: 5
      })
    });

    window.olmap = map
    map.addLayer(vector)

  })

  const typeSelect = ref('')

  function typeSelectOnChange() {
    map.removeInteraction(draw)
    addInteraction()
  }

  //根据几何图形类型进行绘制
  function addInteraction() {
    var value = typeSelect.value //几何图形类型
    if (value) {
      if (source == null) {
        source = new VectorSource({
          wrapX: false
        });
        vector.setSource(source); //添加数据源
      }
      var geometryFunction, maxPoints;
      if (value === 'Square') { //正方形
        value = 'Circle'; //设置几何图形类型为Circle(圆形)
        //设置几何图形类型,即创建正多边形
        geometryFunction = createRegularPolygon(4);
      } else if (value === 'Box') { //长方形
        value = 'LineString'; //设置绘制类型为LineString(线)
        maxPoints = 2; //设置最大点数为2
        //设置几何图形类型,即设置长方形的坐标点
        geometryFunction = function (coordinates, geometry) {
          var start = coordinates[0];
          var end = coordinates[1];
          if (!geometry) {
            //多边形
            geometry = new Polygon([
              [start, [start[0], end[1]], end, [end[0], start[1]], start]
            ]);
          }
          geometry.setCoordinates([
            [start, [start[0], end[1]], end, [end[0], start[1]], start]
          ]);
          return geometry;
        };
      }
      //实例化交互式图形绘制控件并添加到地图容器中
      draw = new Draw({
        source: source, //数据源
        type: /**@type{ol.geom.GeometryType}*/ (value), //几何图形类型
        geometryFunction: geometryFunction, //几何图形变更时调用函数
        maxPoints: maxPoints, //最大点数
        style: new Style({
          image: new Circle({
            radius: 7,
            fill: new Fill({
              color: '#ece034',
            }),
          }),
          stroke: new Stroke({ //边界样式
            color: '#ece034',
            width: 2
          }),
        }),
      });
      map.addInteraction(draw);
    } else {
      source = null;
      vector.setSource(source); //清空绘制的图形
    }
  }
</script>