问题描述:
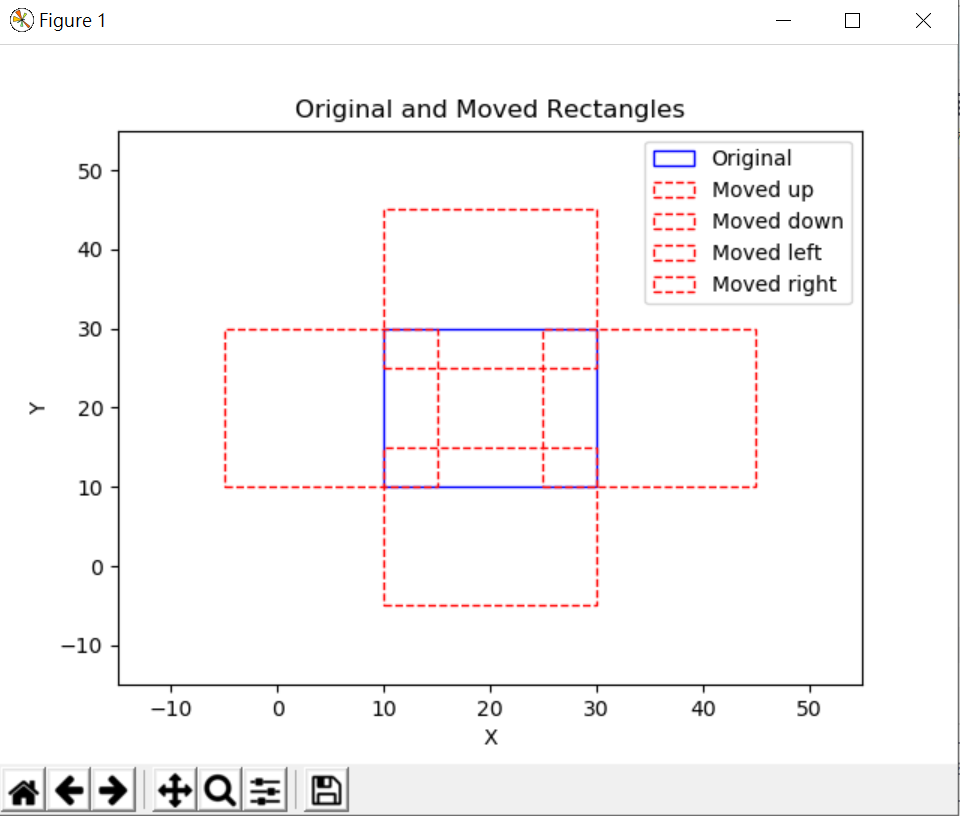
使用python书写代码实现以下功能:给定四个点的坐标,调用一个函数,可以使原来的四个点分别向四周上下左右移动15距离,分别记录下移动后的坐标,然后画出内侧矩形和外侧矩形
代码:
import matplotlib.pyplot as plt

def move_points(points, distance=15):
    """
    移动给定的四个点,分别向上下左右移动指定的距离。

    Parameters:
    points (list of tuples): 四个点的坐标 [(x1, y1), (x2, y2), (x3, y3), (x4, y4)]
    distance (int): 移动的距离

    Returns:
    dict: 包含移动后坐标的字典
    """
    moved_points = {
        'up': [(x, y + distance) for x, y in points],
        'down': [(x, y - distance) for x, y in points],
        'left': [(x - distance, y) for x, y in points],
        'right': [(x + distance, y) for x, y in points]
    }
    return moved_points

def plot_rectangles(original_points, moved_points):
    """
    绘制原始矩形和移动后的矩形。

    Parameters:
    original_points (list of tuples): 原始的四个点的坐标
    moved_points (dict): 移动后的点的坐标字典
    """
    fig, ax = plt.subplots()

    # 原始矩形
    original_rect = plt.Polygon(original_points, closed=True, fill=None, edgecolor='b', label='Original')
    ax.add_patch(original_rect)

    # 移动后的矩形(上下左右分别画出)
    for direction, points in moved_points.items():
        moved_rect = plt.Polygon(points, closed=True, fill=None, edgecolor='r', linestyle='--', label=f'Moved {direction}')
        ax.add_patch(moved_rect)

    # 设置轴的范围
    all_points = original_points + [point for points in moved_points.values() for point in points]
    all_x = [p[0] for p in all_points]
    all_y = [p[1] for p in all_points]
    ax.set_xlim(min(all_x) - 10, max(all_x) + 10)
    ax.set_ylim(min(all_y) - 10, max(all_y) + 10)

    plt.xlabel('X')
    plt.ylabel('Y')
    plt.legend()
    plt.title('Original and Moved Rectangles')
    plt.show()

# 主程序
original_points = [(10, 10), (30, 10), (30, 30), (10, 30)]

# 移动点
moved_points = move_points(original_points)

# 绘制矩形
plot_rectangles(original_points, moved_points)
效果:
问题描述:
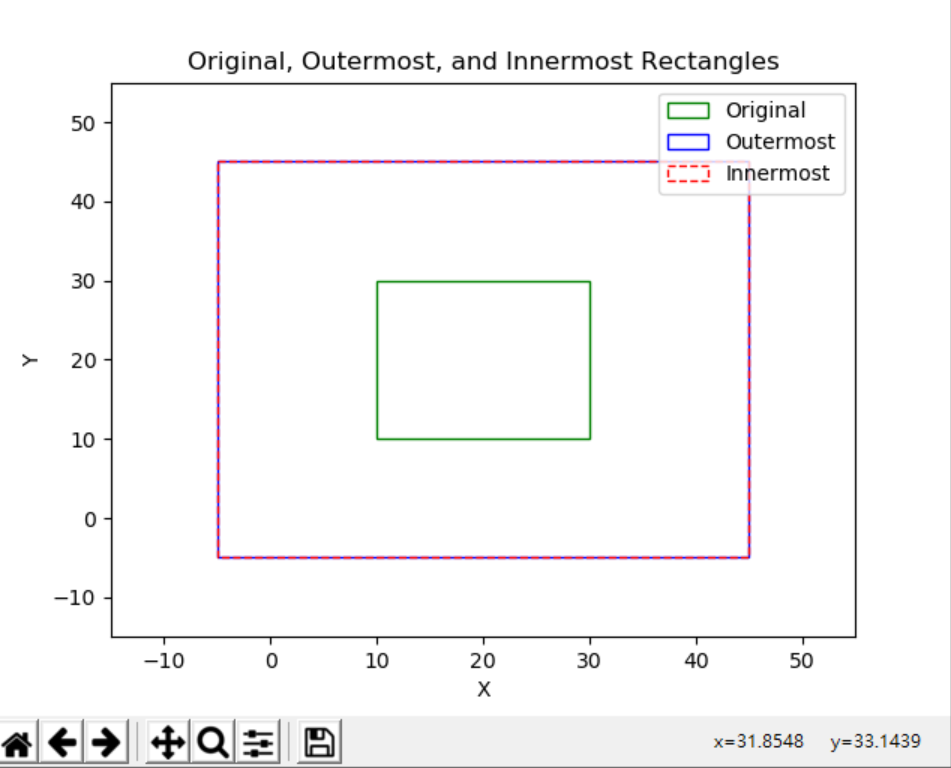
使用python书写代码实现以下功能:已知给定四个点的坐标,通过调用一个函数,可以使原来的四个点分别向四周上下左右移动15距离,分别记录下移动后的坐标,然后以最外侧的点绘制成一个矩形,内侧的点绘成另外一个矩形,同时保留原来的坐标围成的矩形
代码:
import matplotlib.pyplot as plt

def move_points(points, distance=15):
    """
    移动给定的四个点,分别向上下左右移动指定的距离。

    Parameters:
    points (list of tuples): 四个点的坐标 [(x1, y1), (x2, y2), (x3, y3), (x4, y4)]
    distance (int): 移动的距离

    Returns:
    dict: 包含移动后坐标的字典
    """
    moved_points = {
        'up': [(x, y + distance) for x, y in points],
        'down': [(x, y - distance) for x, y in points],
        'left': [(x - distance, y) for x, y in points],
        'right': [(x + distance, y) for x, y in points]
    }
    return moved_points

def get_outermost_and_innermost_points(points_dict):
    """
    获取最外侧和最内侧的点。

    Parameters:
    points_dict (dict): 移动后的点的坐标字典

    Returns:
    tuple: (最外侧点, 最内侧点)
    """
    all_points = [point for points in points_dict.values() for point in points]
    xs, ys = zip(*all_points)

    outermost_points = [(min(xs), min(ys)), (max(xs), min(ys)), (max(xs), max(ys)), (min(xs), max(ys))]
    innermost_points = [(min(xs), max(ys)), (max(xs), max(ys)), (max(xs), min(ys)), (min(xs), min(ys))]

    return outermost_points, innermost_points

def plot_rectangles(original_points, outermost_points, innermost_points):
    """
    绘制最外侧矩形、最内侧矩形和原始矩形。

    Parameters:
    original_points (list of tuples): 原始的四个点的坐标
    outermost_points (list of tuples): 最外侧的四个点的坐标
    innermost_points (list of tuples): 最内侧的四个点的坐标
    """
    fig, ax = plt.subplots()

    # 原始矩形
    original_rect = plt.Polygon(original_points, closed=True, fill=None, edgecolor='g', label='Original')
    ax.add_patch(original_rect)

    # 最外侧矩形
    outer_rect = plt.Polygon(outermost_points, closed=True, fill=None, edgecolor='b', label='Outermost')
    ax.add_patch(outer_rect)

    # 最内侧矩形
    inner_rect = plt.Polygon(innermost_points, closed=True, fill=None, edgecolor='r', linestyle='--', label='Innermost')
    ax.add_patch(inner_rect)

    # 设置轴的范围
    all_points = original_points + outermost_points + innermost_points
    all_x = [p[0] for p in all_points]
    all_y = [p[1] for p in all_points]
    ax.set_xlim(min(all_x) - 10, max(all_x) + 10)
    ax.set_ylim(min(all_y) - 10, max(all_y) + 10)

    plt.xlabel('X')
    plt.ylabel('Y')
    plt.legend()
    plt.title('Original, Outermost, and Innermost Rectangles')
    plt.show()

# 主程序
original_points = [(10, 10), (30, 10), (30, 30), (10, 30)]

# 移动点
moved_points = move_points(original_points)

# 获取最外侧和最内侧的点
outermost_points, innermost_points = get_outermost_and_innermost_points(moved_points)

# 绘制矩形
plot_rectangles(original_points, outermost_points, innermost_points)
效果: