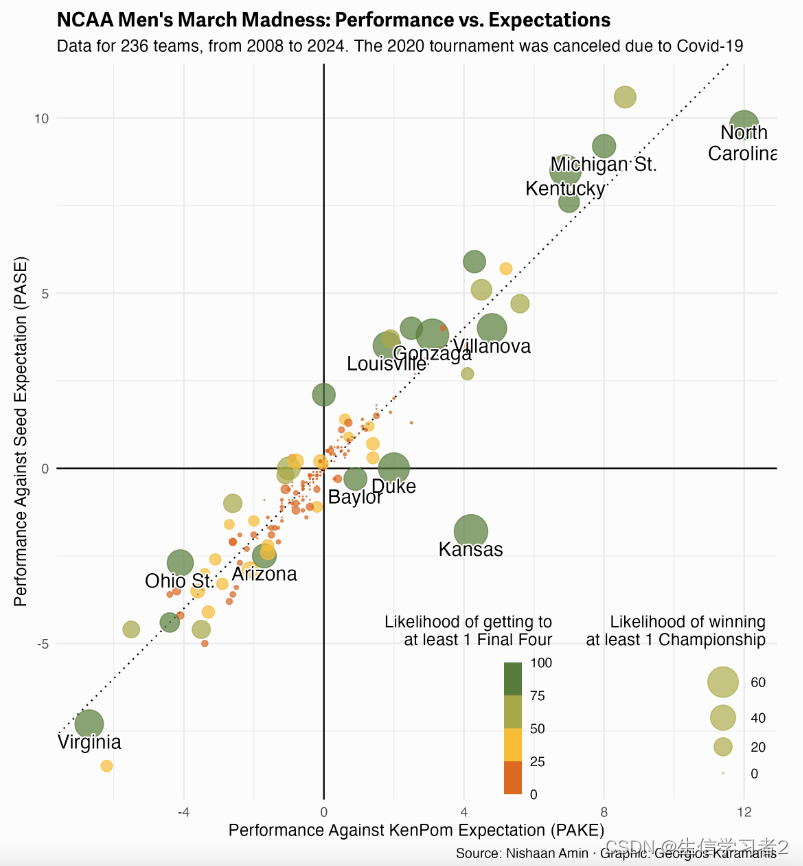
ggplot(tr, aes(pake, pase, label = str_wrap(team, 12))) +
  geom_vline(xintercept = 0) +
  geom_hline(yintercept = 0) +
  geom_abline(linetype = "dotted") +
  geom_point(aes(size = champpercent, color = f4percent), alpha = 0.7) +
  shadowtext::geom_shadowtext(data = . %>% filter(champpercent > 33), nudge_y = -0.5, family = f1b, color = "black", bg.color = "white", size = 4.5, lineheight = 0.9) +
  scale_color_stepsn(colors = pal) +
  scale_size_area(max_size = 10) +
  coord_fixed() +
  guides(
    size = guide_legend(reverse = TRUE, override.aes = list(color = pal[4])),
    color = guide_colorsteps(show.limits = TRUE)
    ) +
  labs(
    x = "Performance Against KenPom Expectation (PAKE)",
    y = "Performance Against Seed Expectation (PASE)",
    color = "Likelihood of getting to\nat least 1 Final Four",
    size = "Likelihood of winning\nat least 1 Championship",
    title = "NCAA Men's March Madness: Performance vs. Expectations",
    subtitle = "Data for 236 teams, from 2008 to 2024. The 2020 tournament was canceled due to Covid-19",
    caption = "Source: Nishaan Amin · Graphic: Georgios Karamanis"
  ) +
  theme_minimal(base_family = f1) +
  theme(
    legend.position = c(0.72, 0.13),
    legend.title = element_text(hjust = 1, margin = margin(0, 0, 10, 0)),
    legend.box = "horizontal",
    legend.key.width = unit(0.8, "line"),
    plot.background = element_rect(fill = "grey99", color = NA),
    plot.title = element_text(face = "bold"),
    plot.margin = margin(10, 10, 10, 10))