目录
[5.1 修改nginx配置](#5.1 修改nginx配置)
[5.2 编写监控数据脚本](#5.2 编写监控数据脚本)
[5.3 设置键值](#5.3 设置键值)
[5.4 在zabbix web端完成自定义监控项](#5.4 在zabbix web端完成自定义监控项)
[5.5 连接到grafana](#5.5 连接到grafana)
以上一篇博客<监控平台zabbix介绍与部署>实验结果为基础
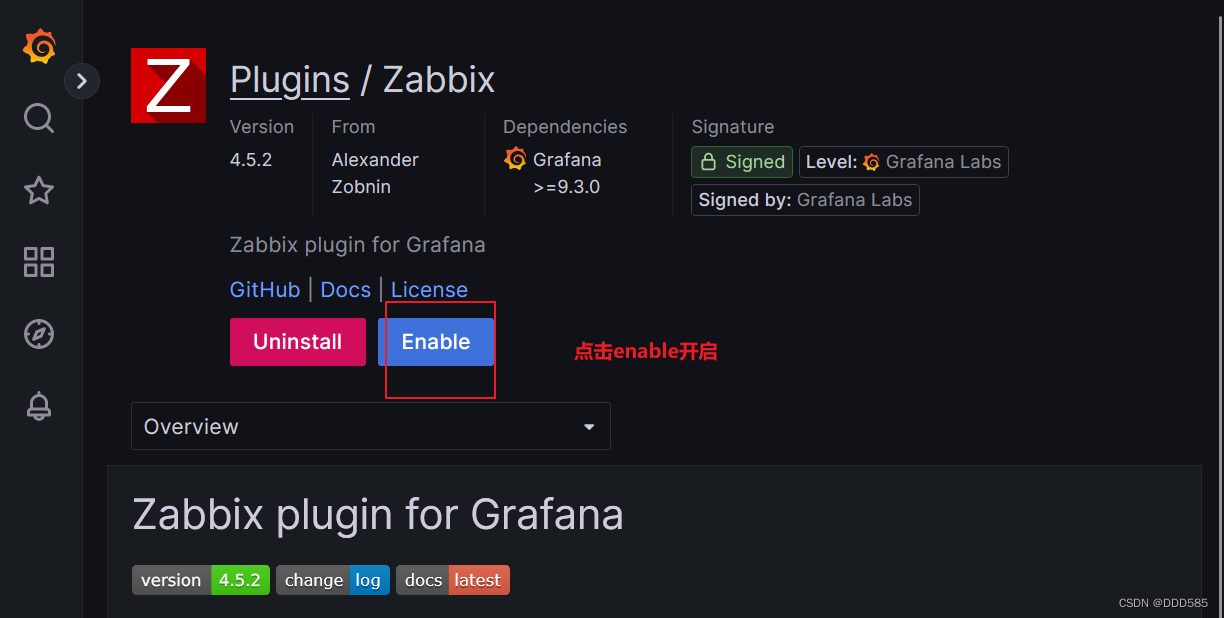
1.安装grafana并启动
添加一台服务器192.168.9.114
初始化操作
systemctl disable --now firewalld
setenforce 0
vim /etc/selinux/config
SELINUX=disabled

cd /opt
grafana-enterprise-9.4.7-1.x86_64.rpm   #上传软件包
yum localinstall -y grafana-enterprise-9.4.7-1.x86_64.rpm   #安装
systemctl enable --now grafana-server.service  #开启服务
netstat -lntp | grep 3000    #查询是否已经开启服务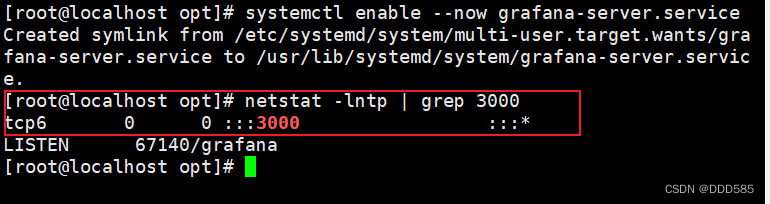
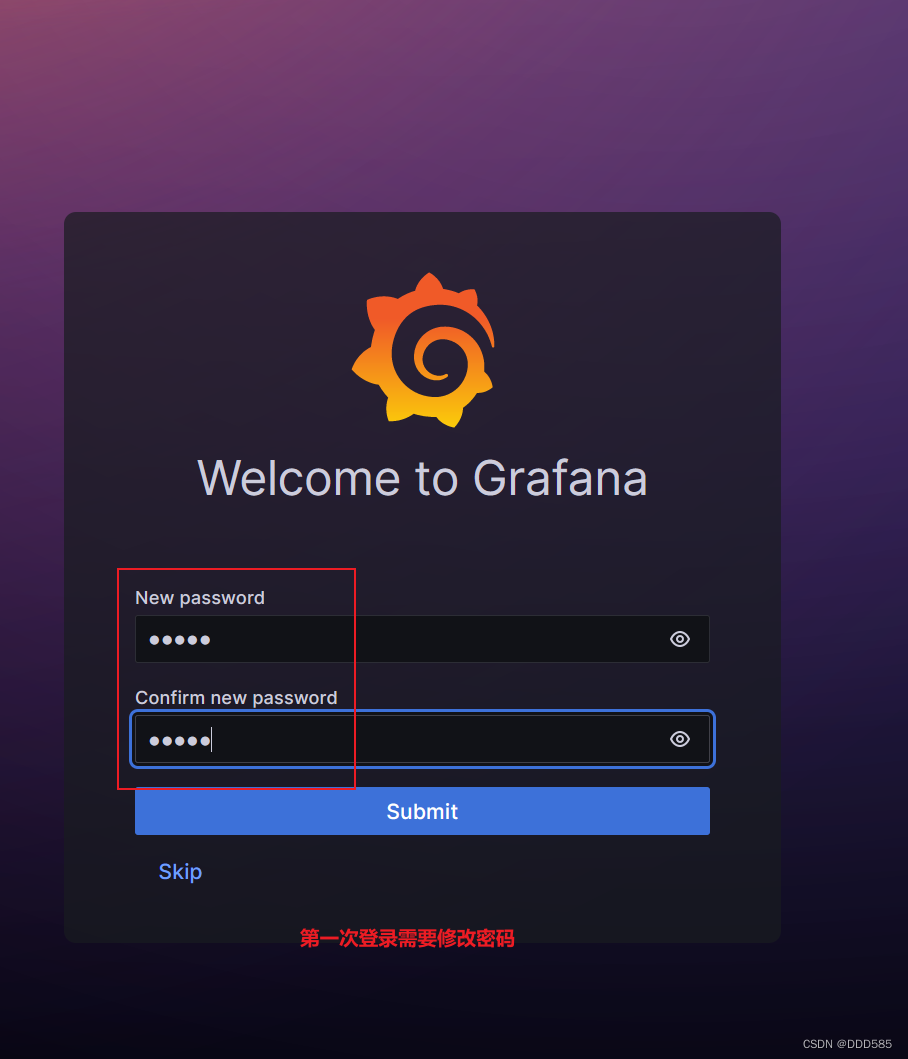
2.浏览器访问
浏览器输入http://192.168.9.114:3000
账号/密码:admin / admin

安装启动zabbix
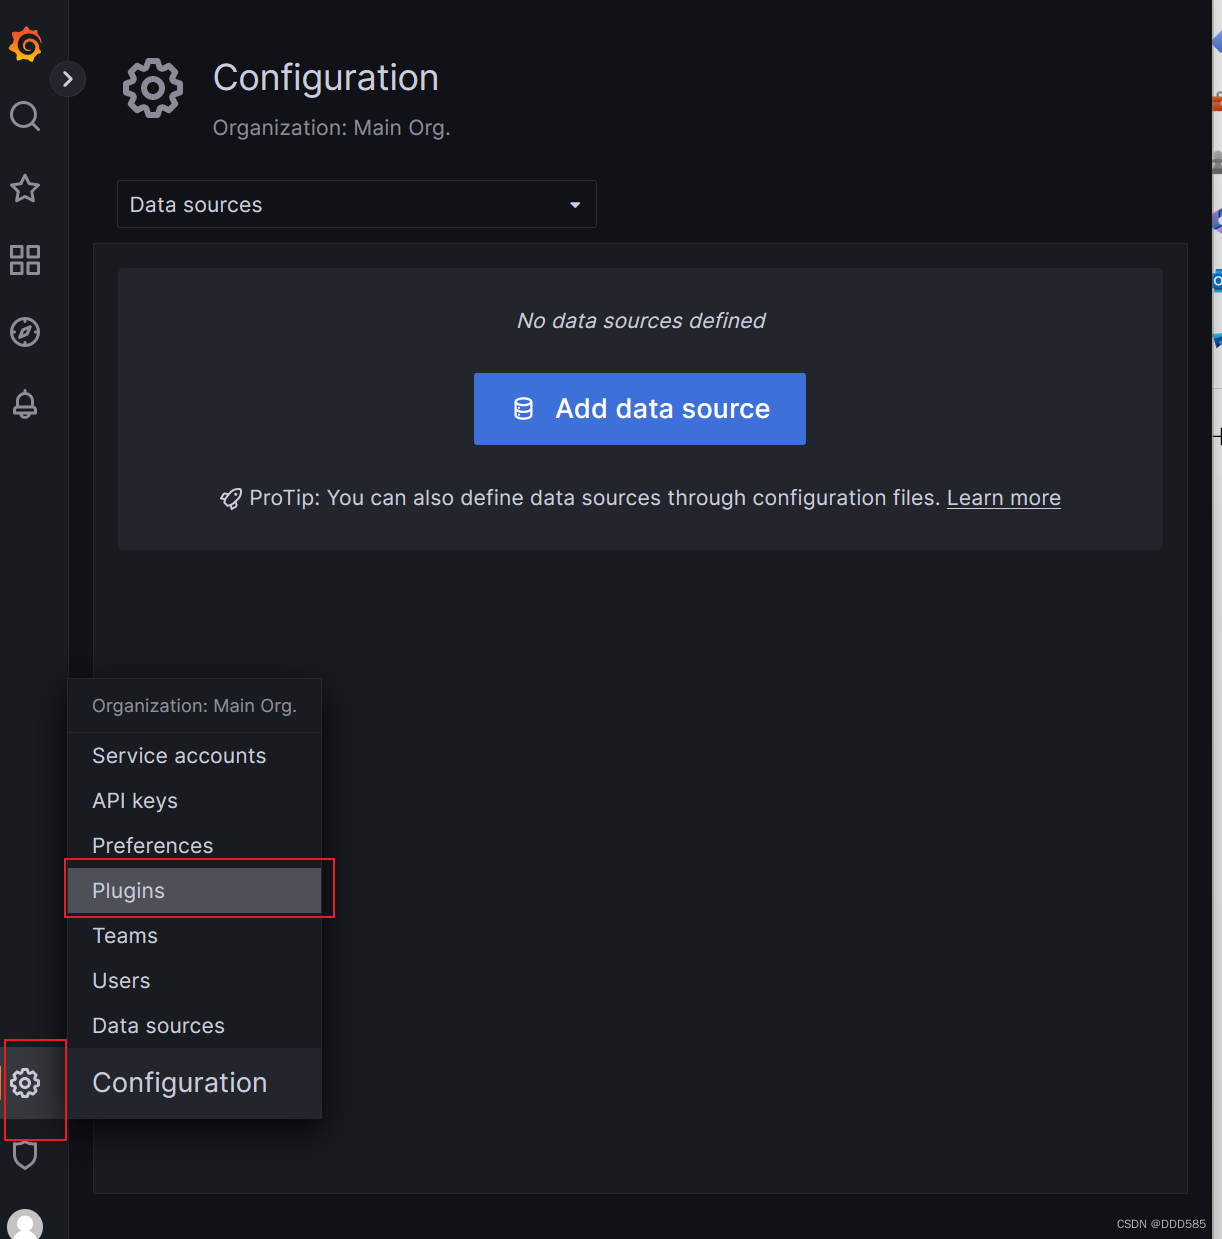
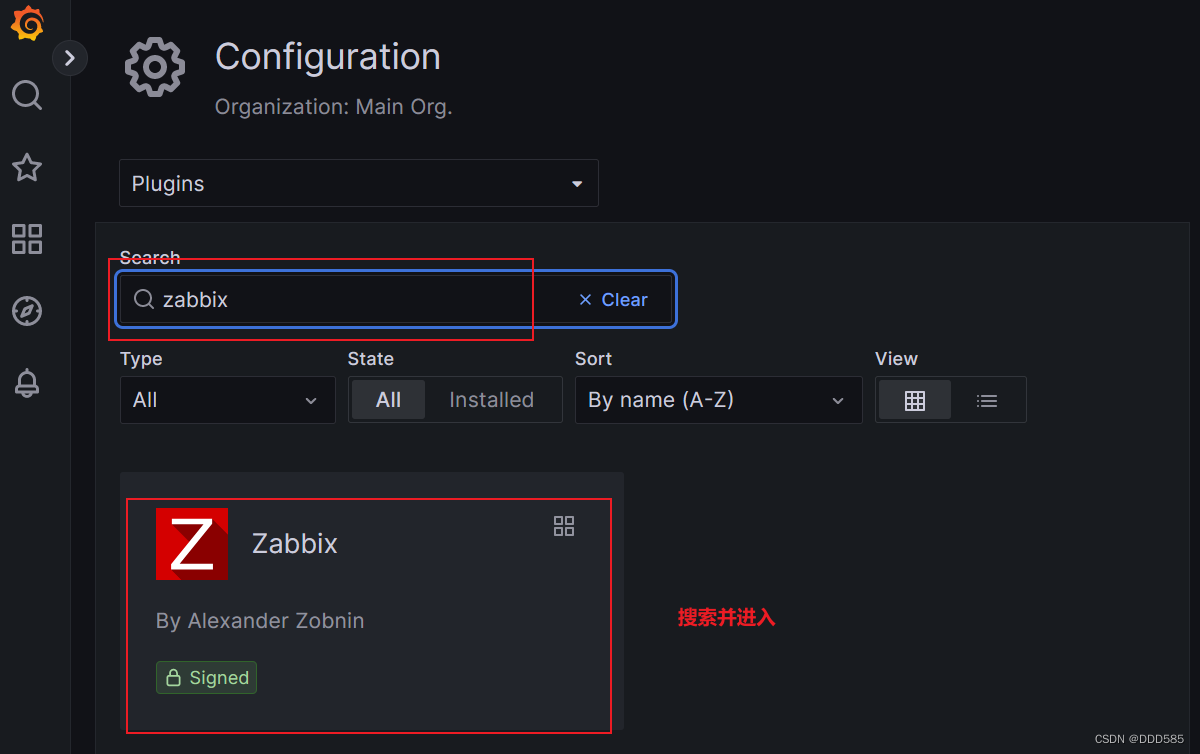

3.导入zabbix数据,对接grafana
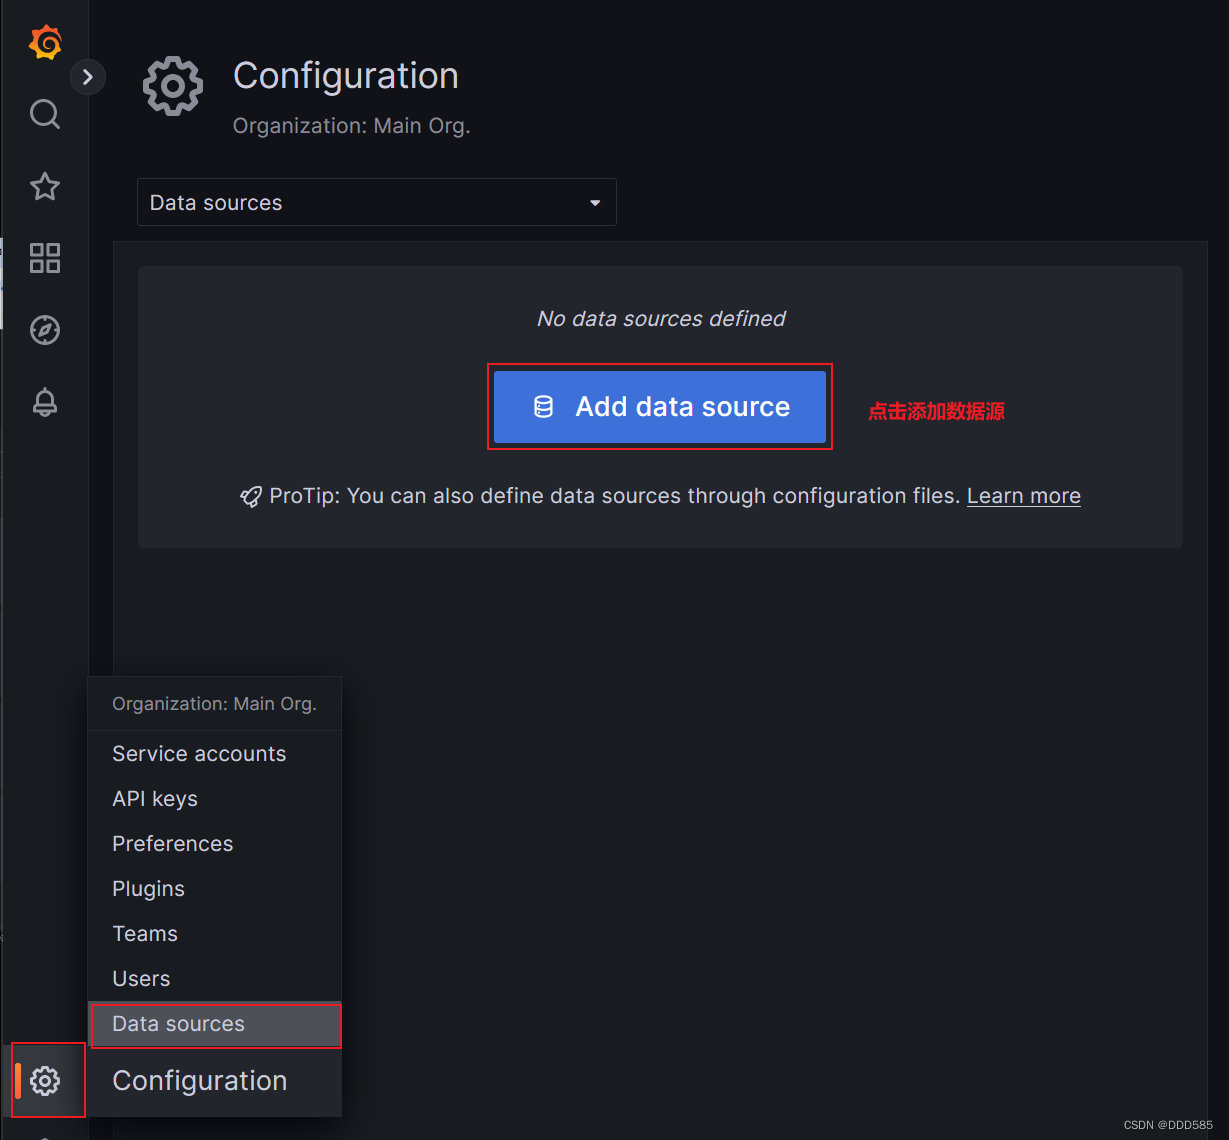

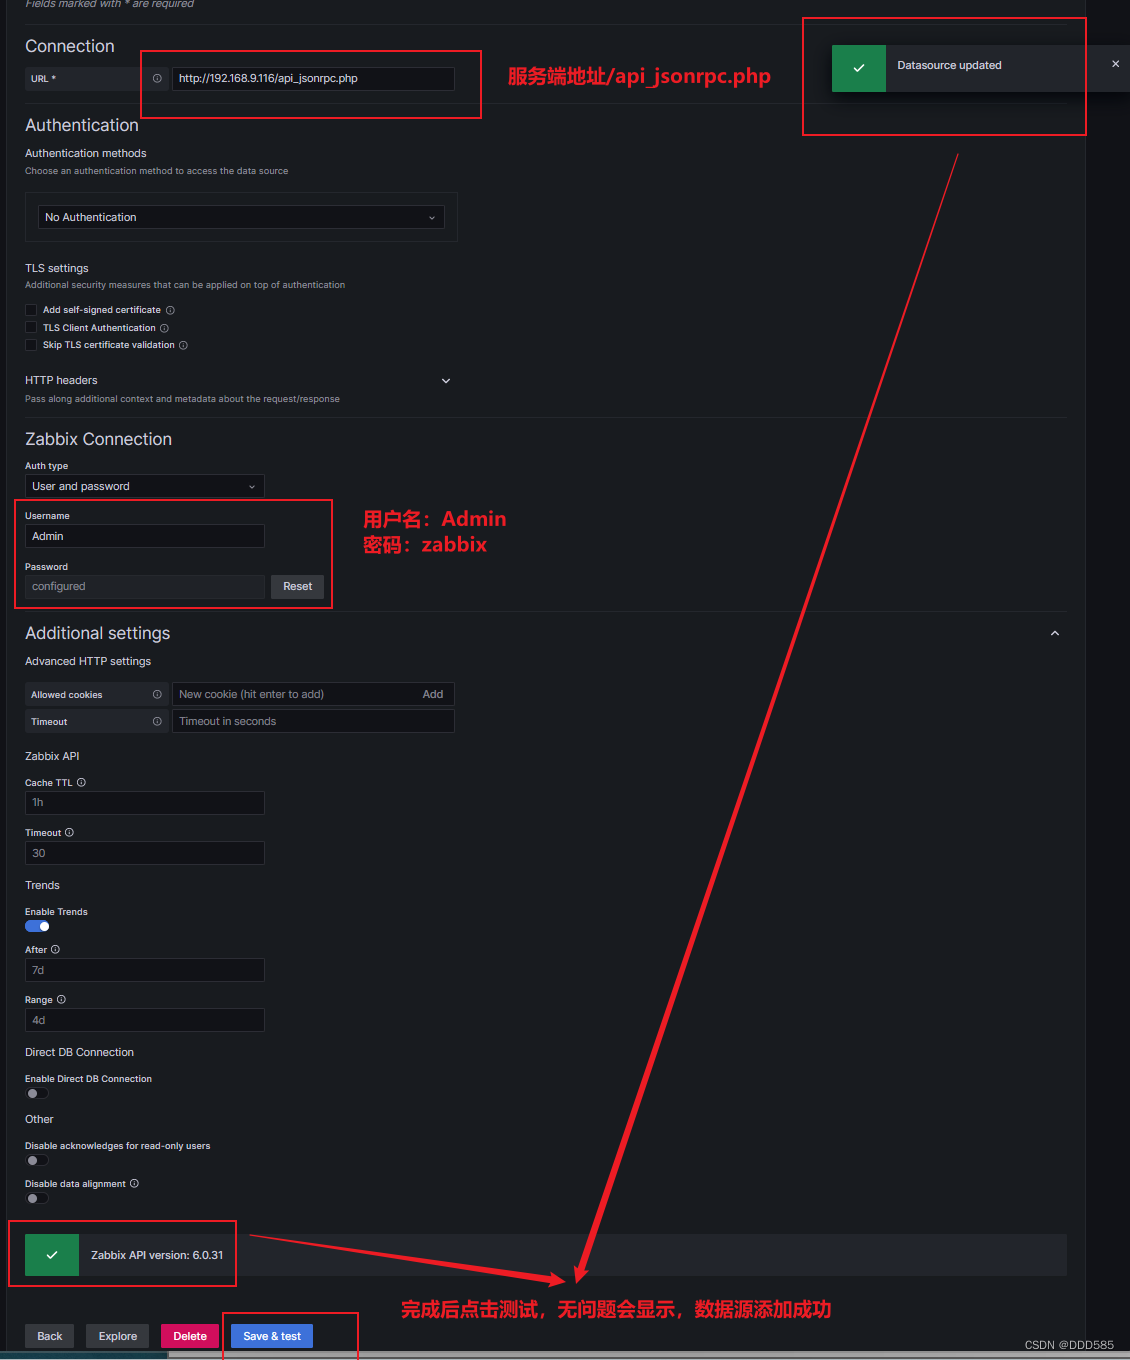
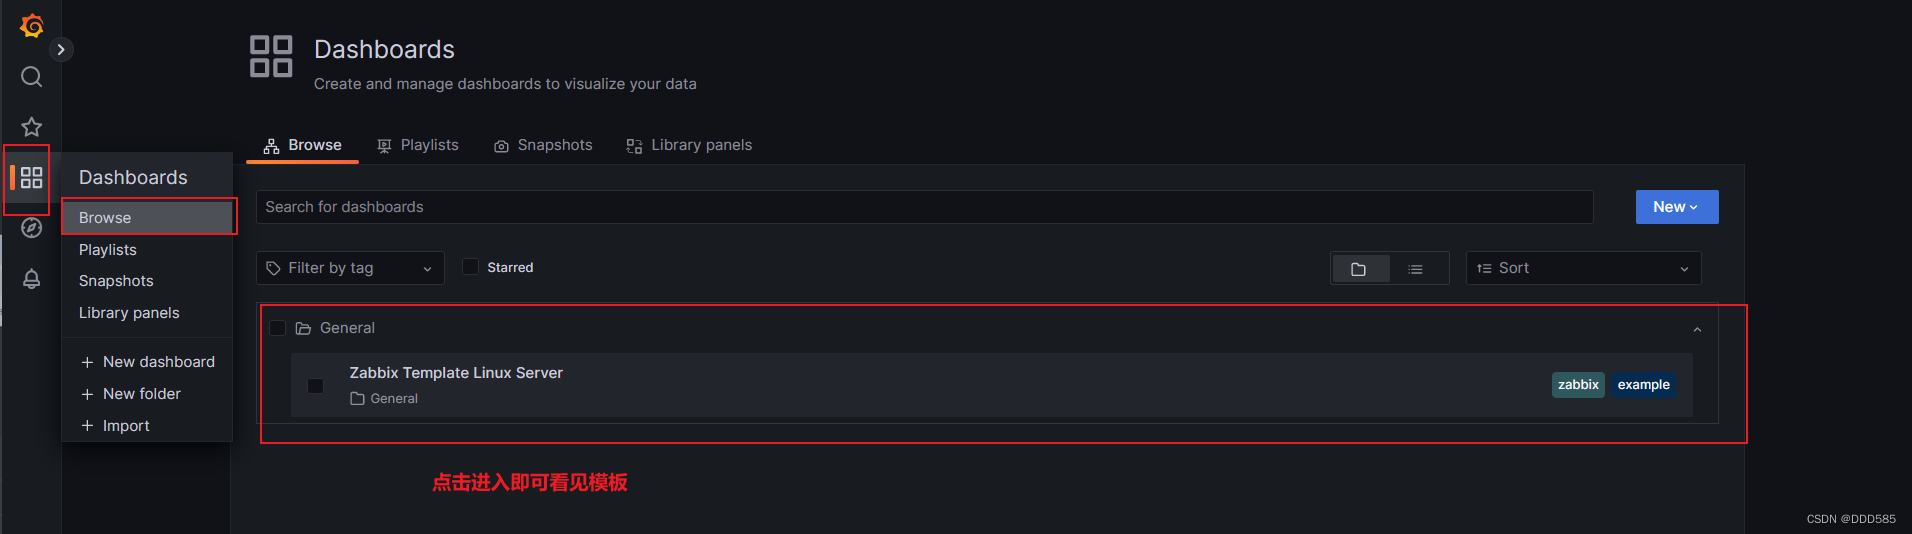
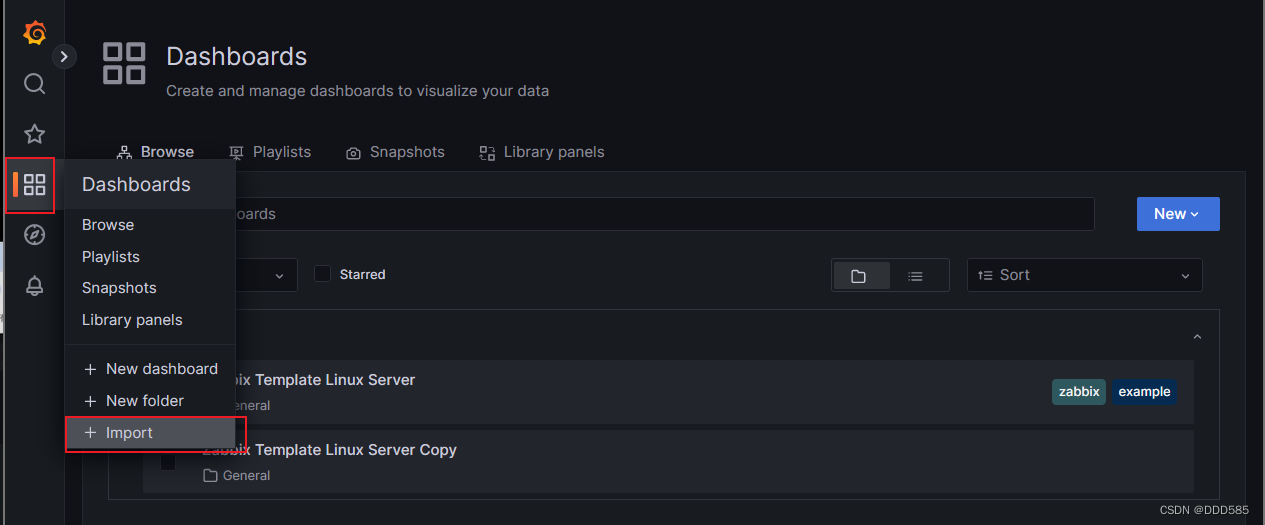
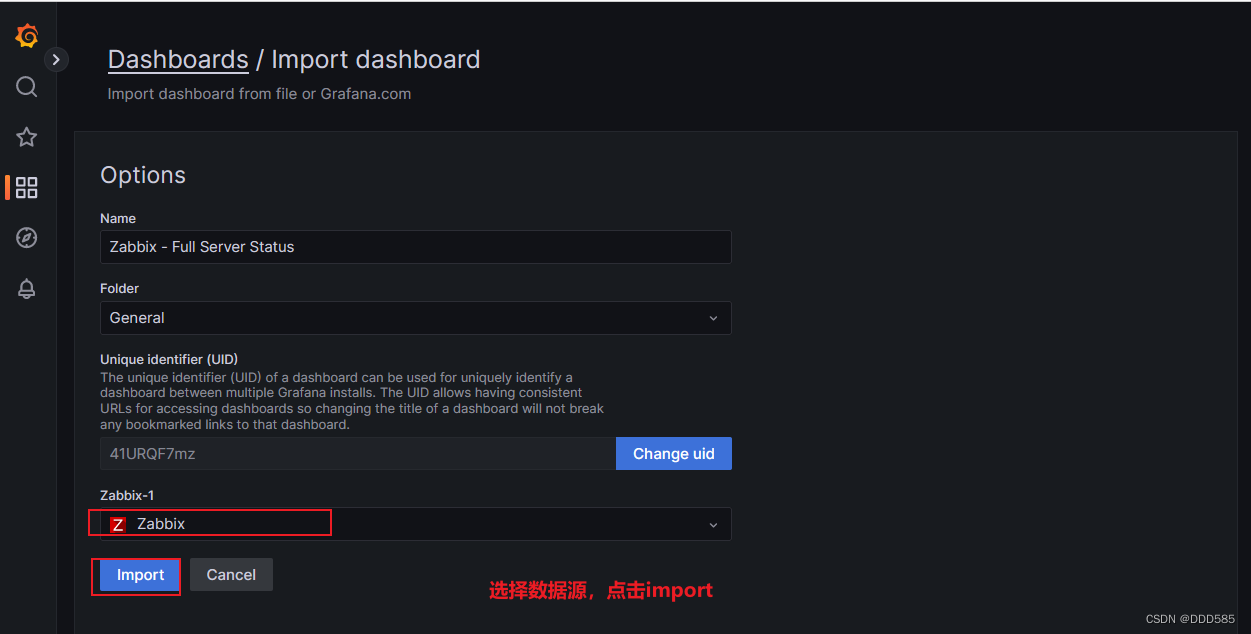
导入模板

调试模板
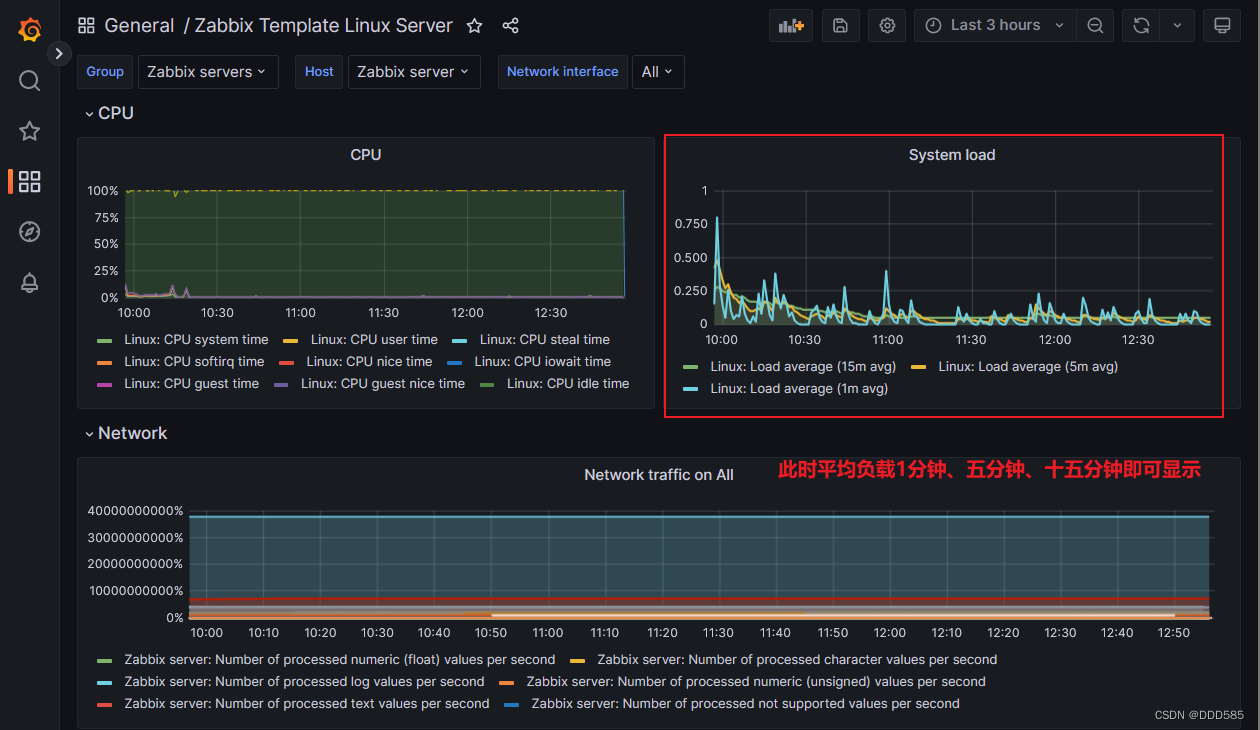
调试cpu


调试平均负载

4.如何导入模板
https://grafana.com/dashboards 可登录该网站进行
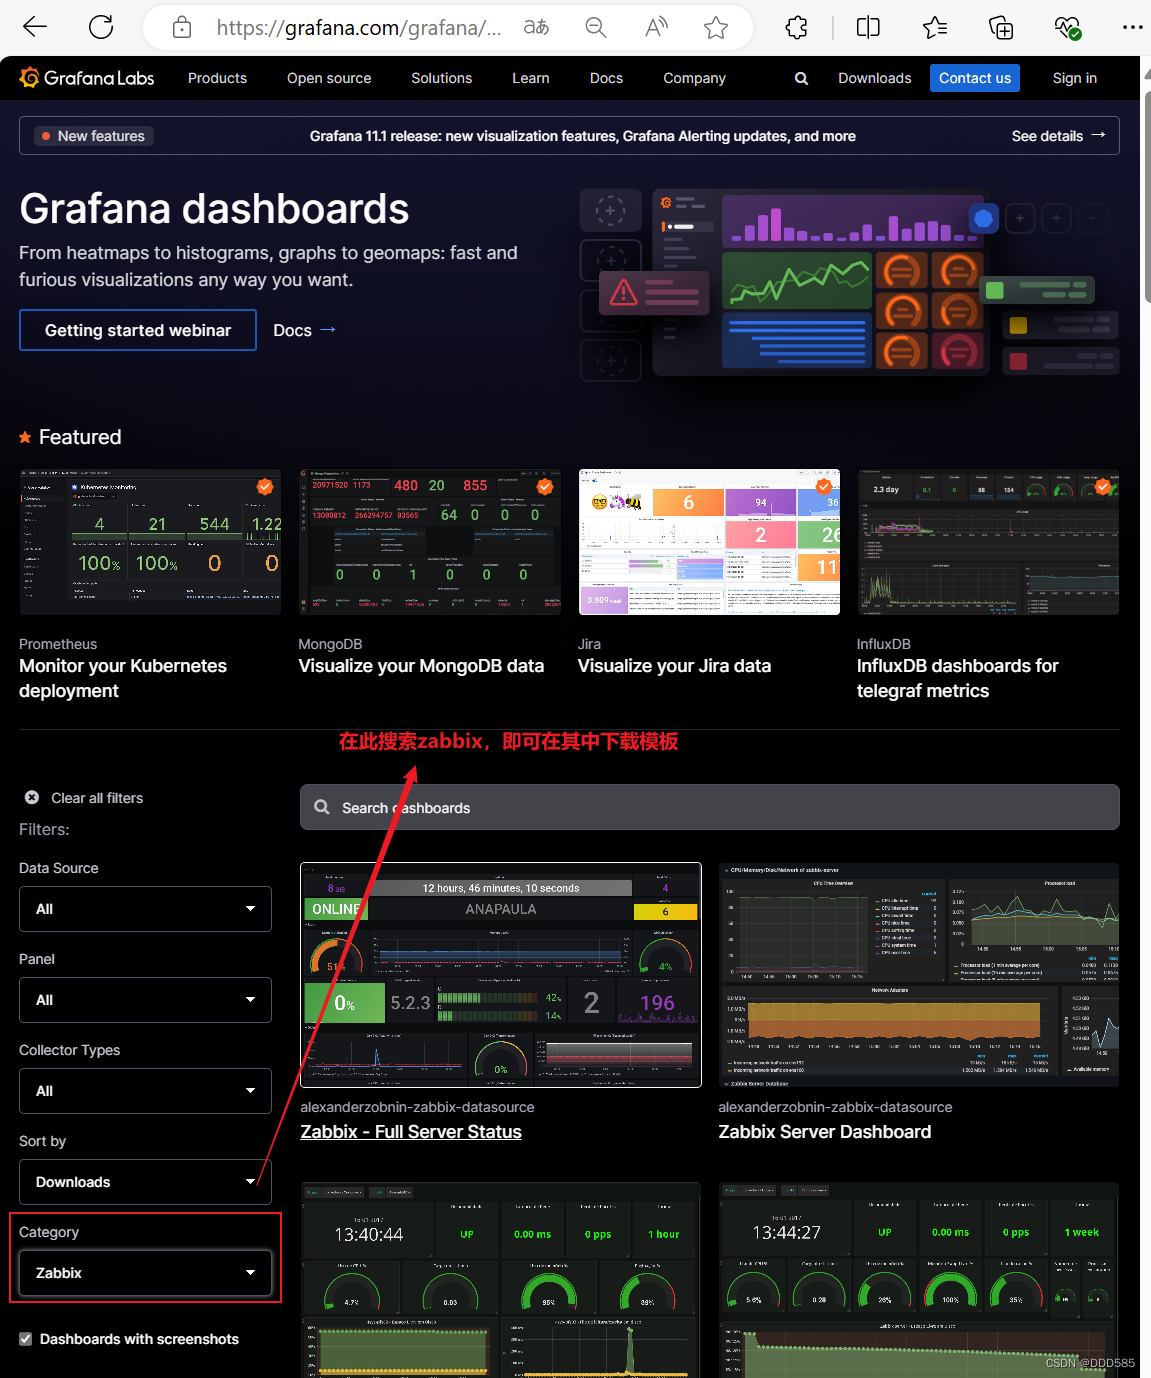
导入模板操作

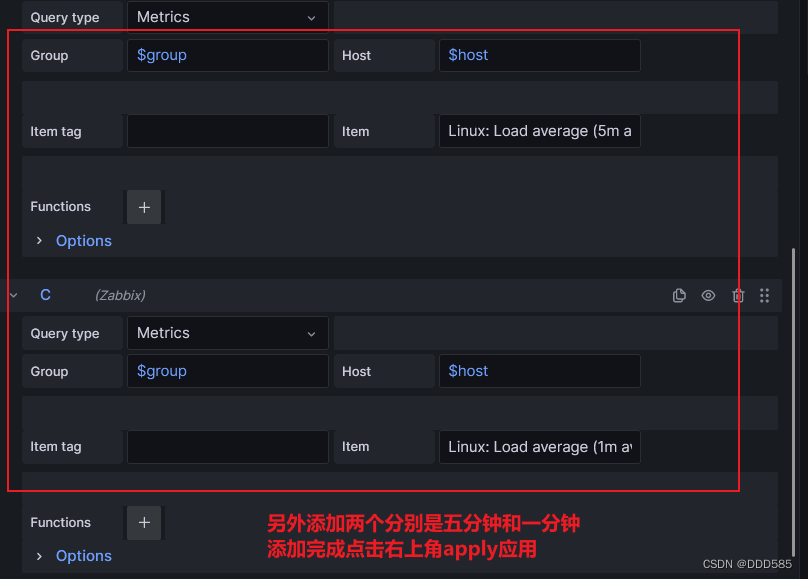
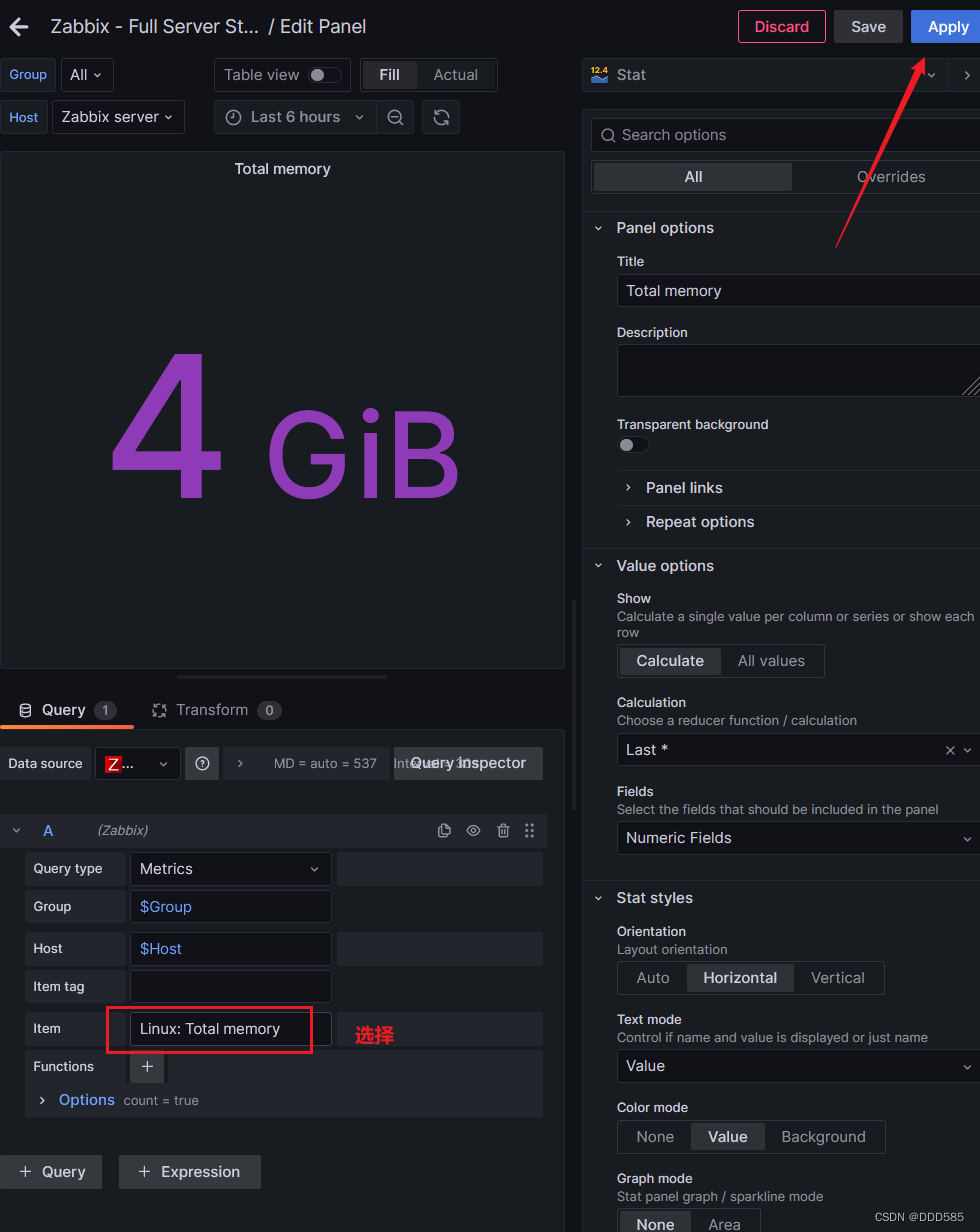
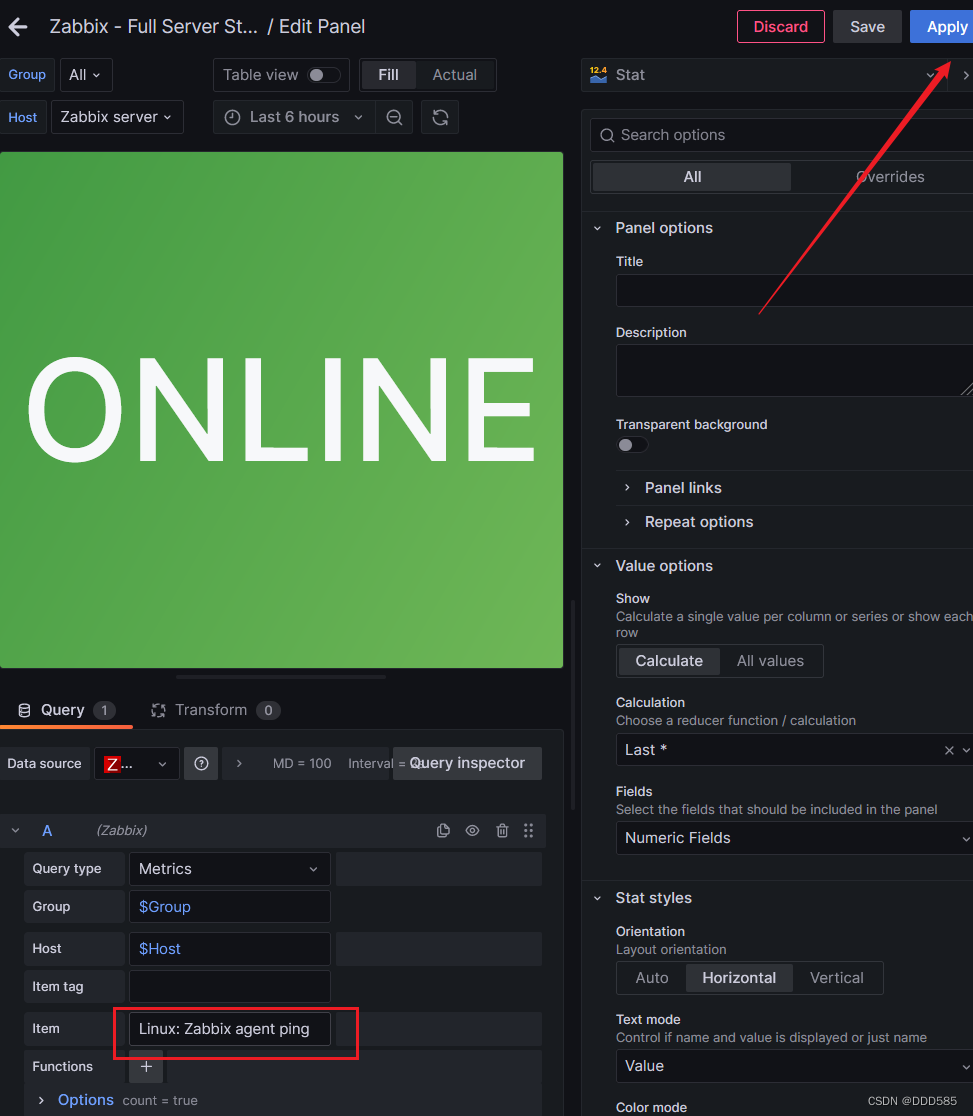
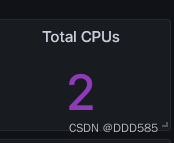
模板调试的步骤


total memory

ping
total cpus
左侧【配置】点击【模板】找到【Linux by Zabbix agent】进入;点击上方【监控项】找到【Linux: Number of CPUs】进入;点击上方【预处理】,点击移除然后更新。
左侧【配置】点击【主机】点击agent01服务器后的监控项找到【 Linux by Zabbix agent: Linux: Number of CPUs 】点击测试,立即执行
host name
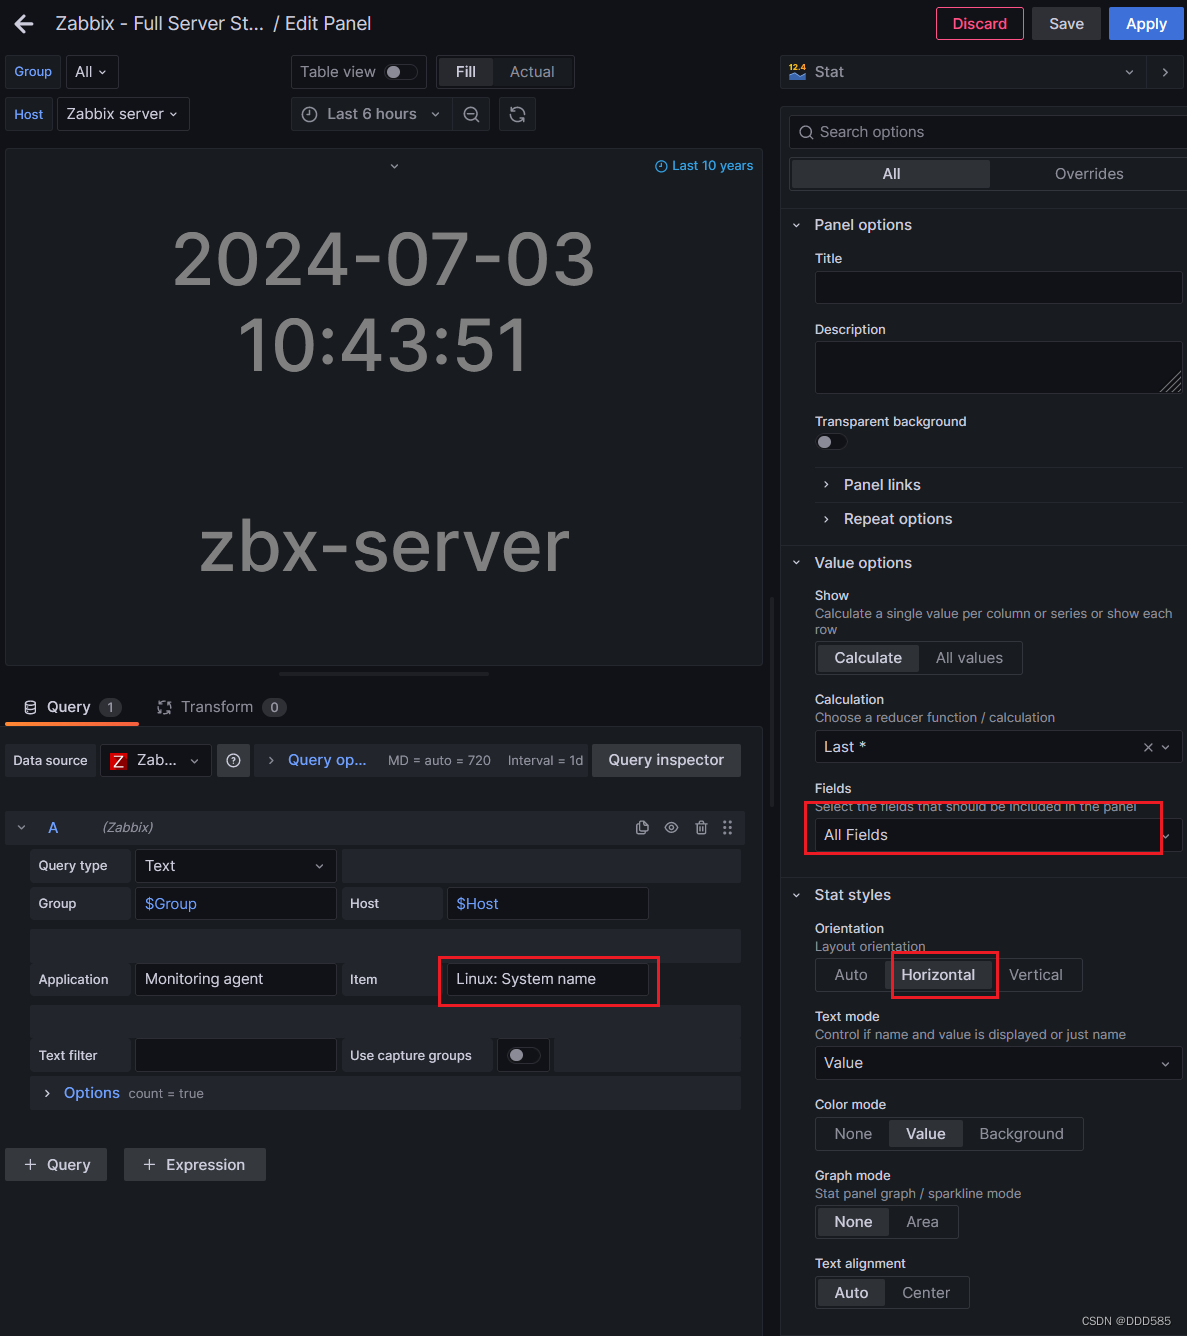
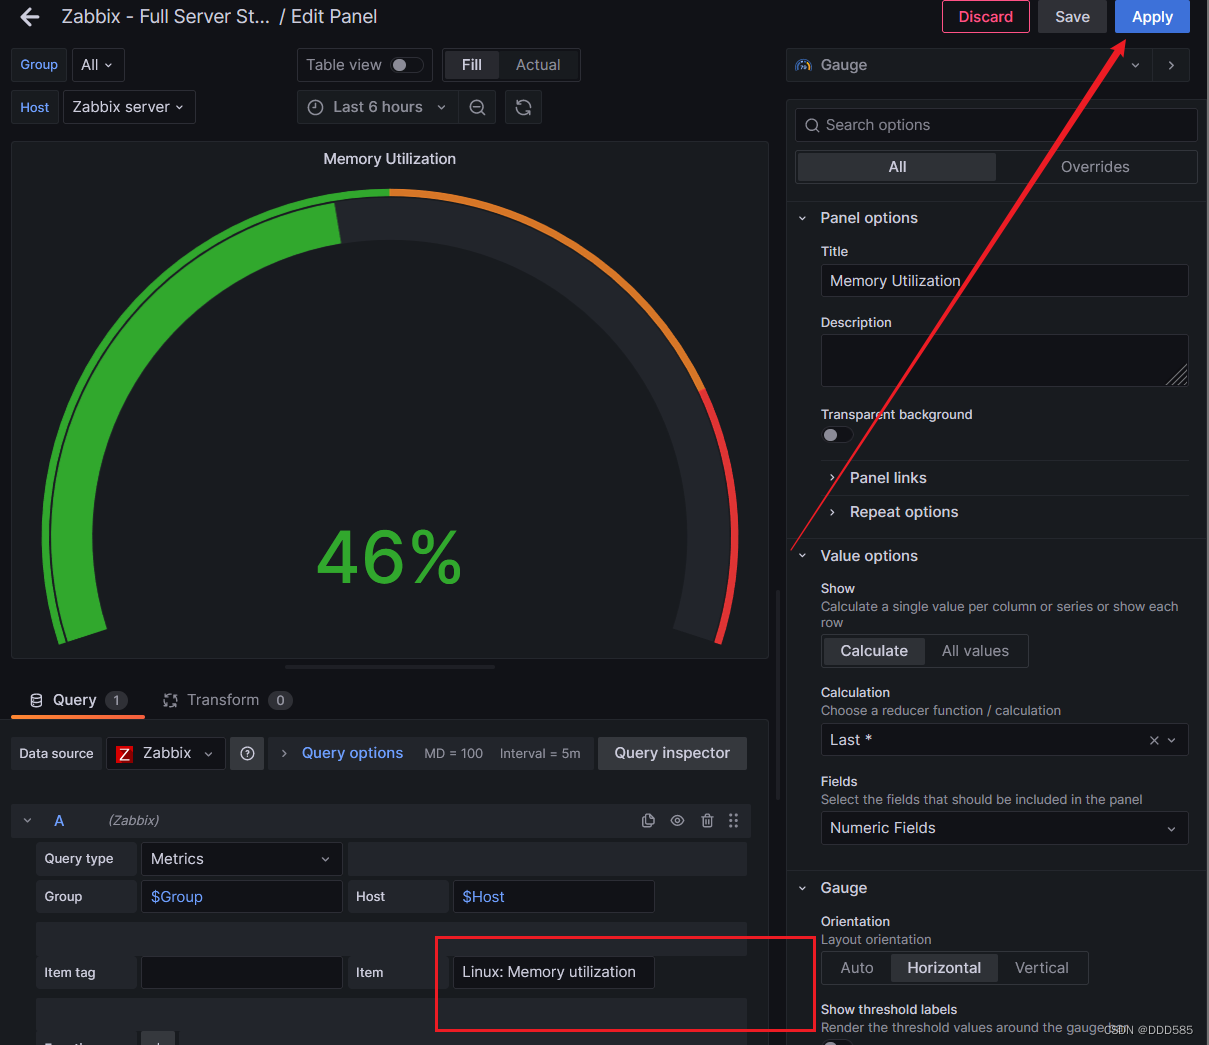
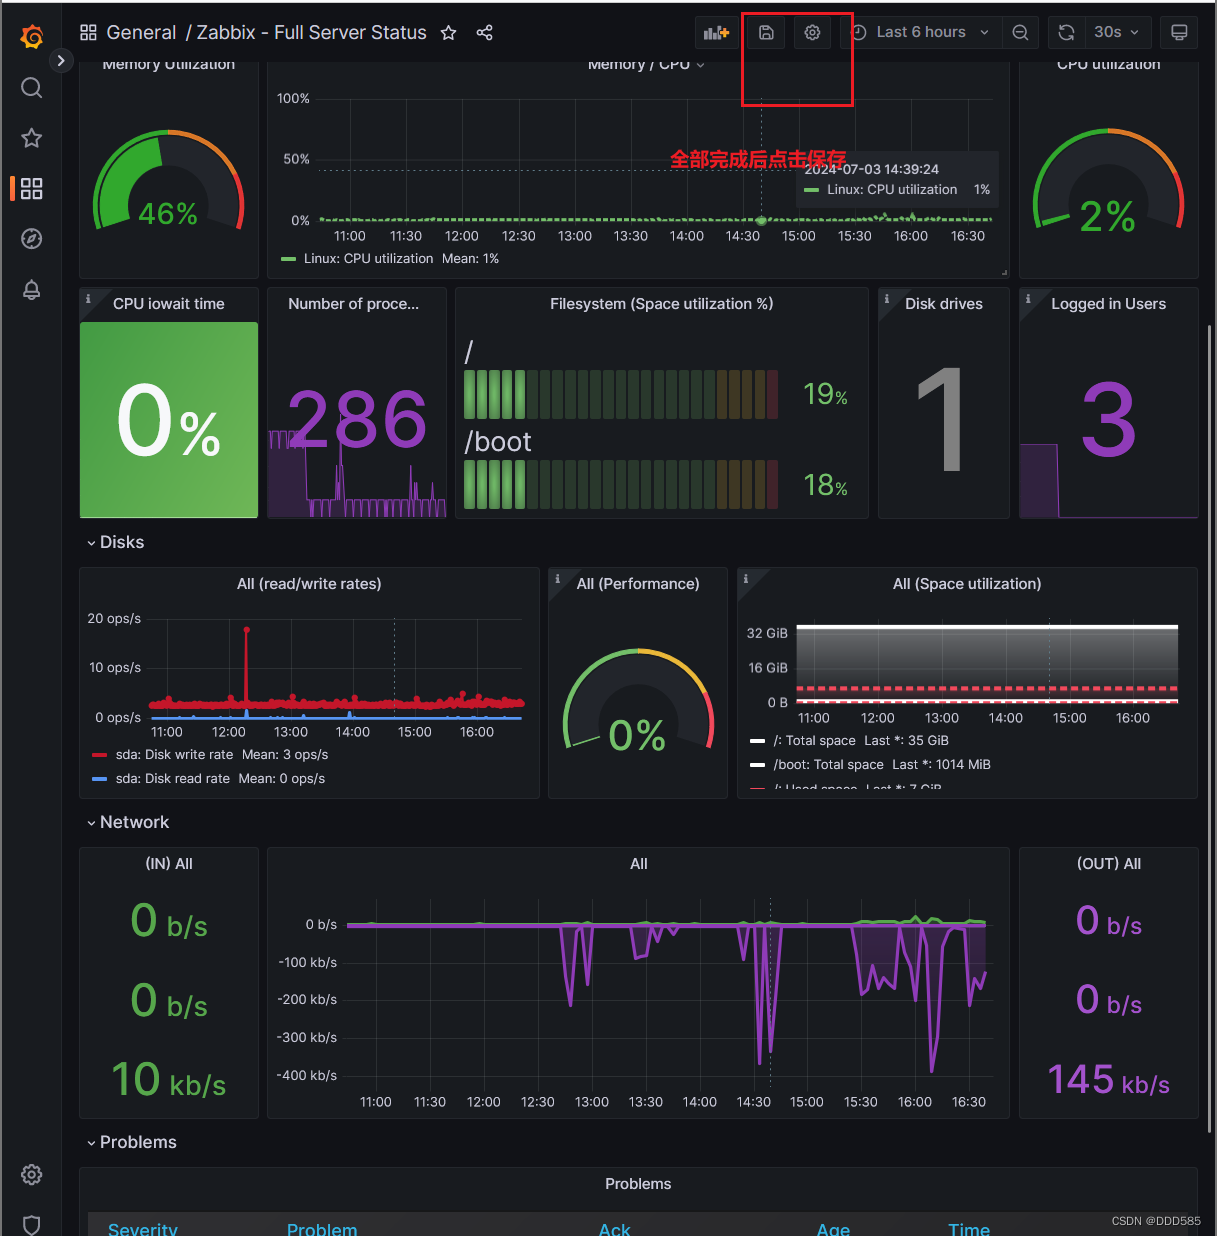
Memory Utilization
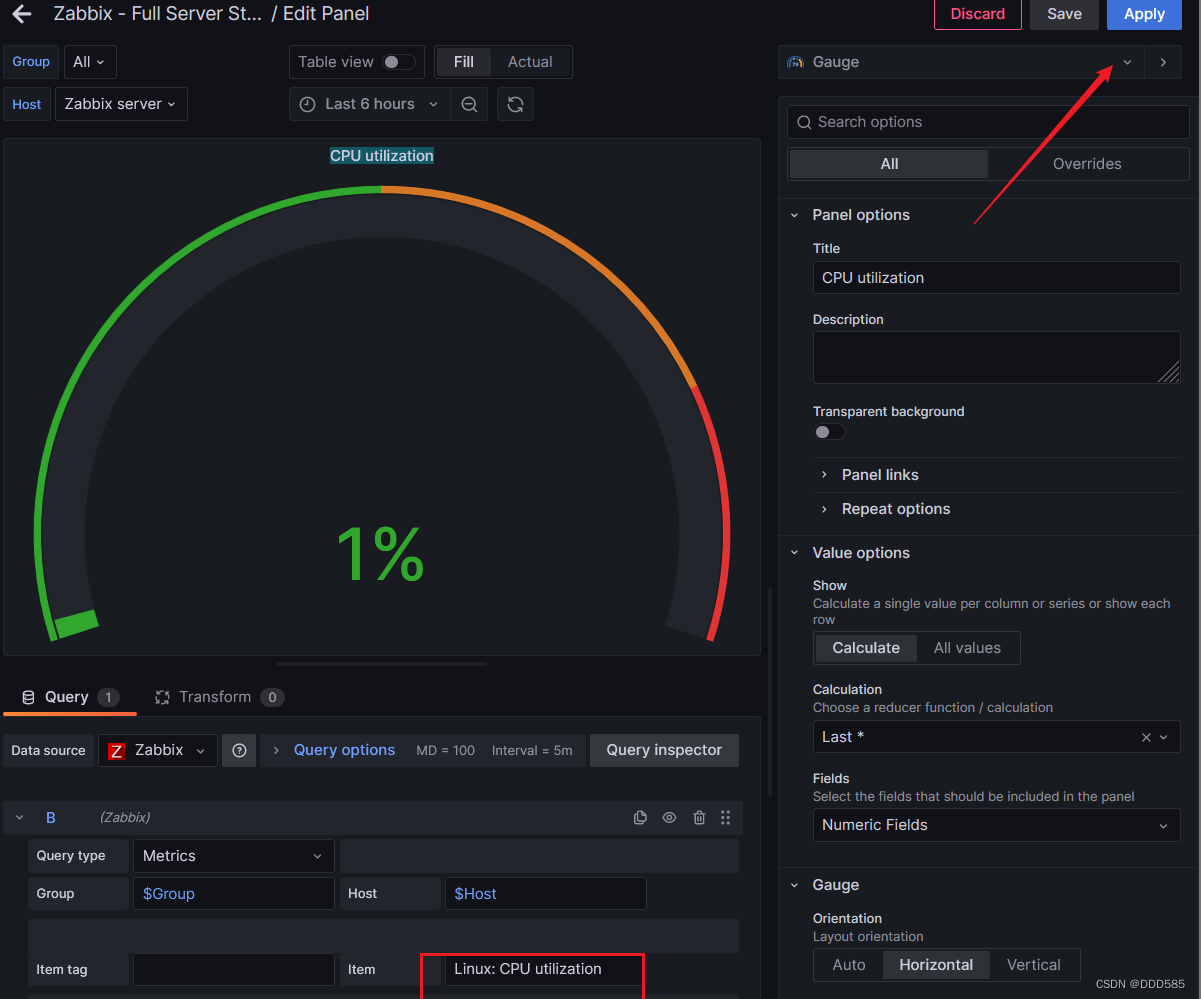
CPU utilization
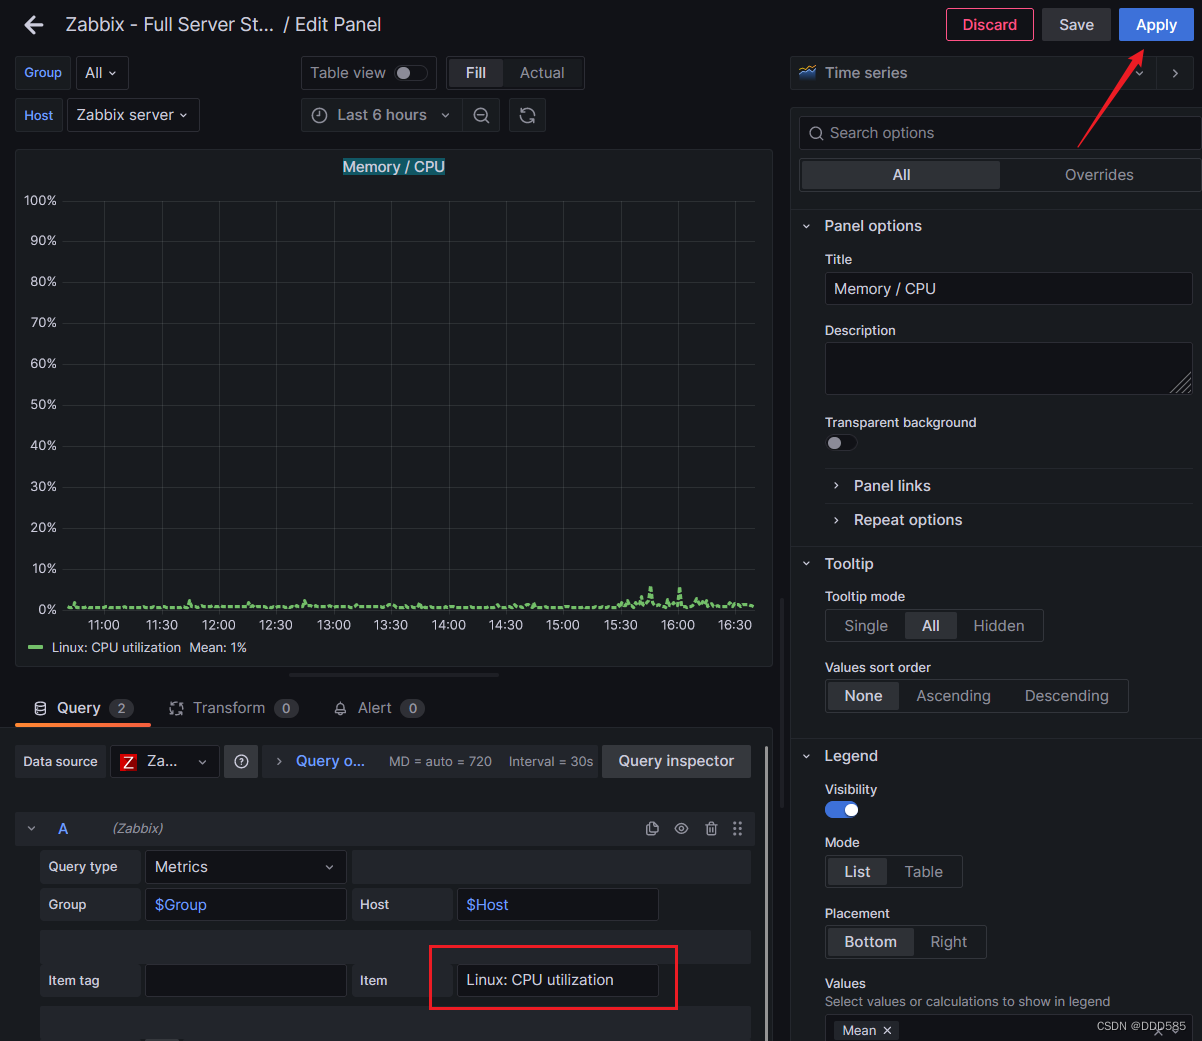
Memory / CPU
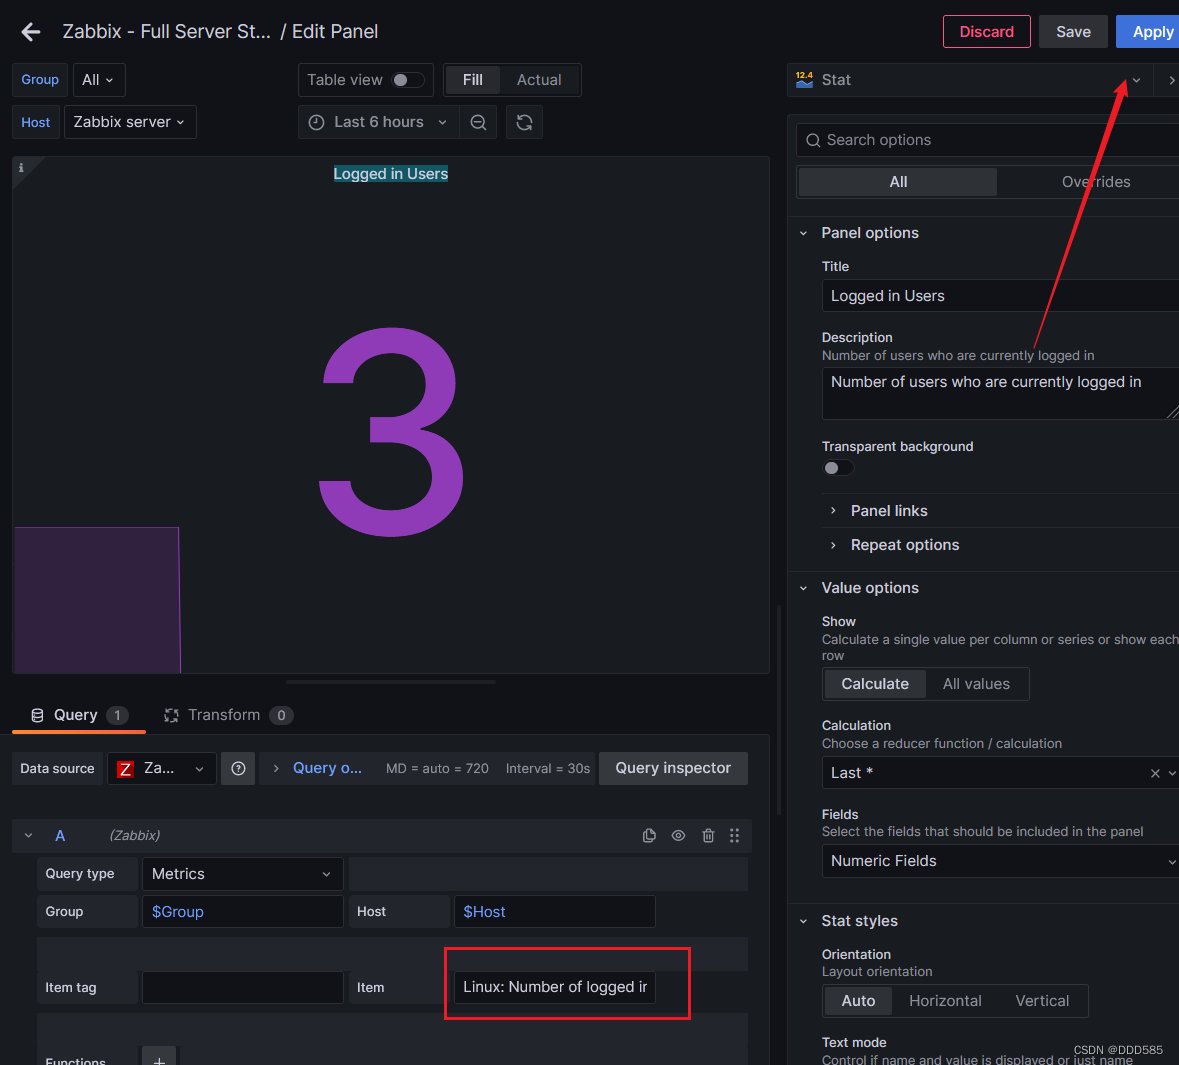
Logged in Users
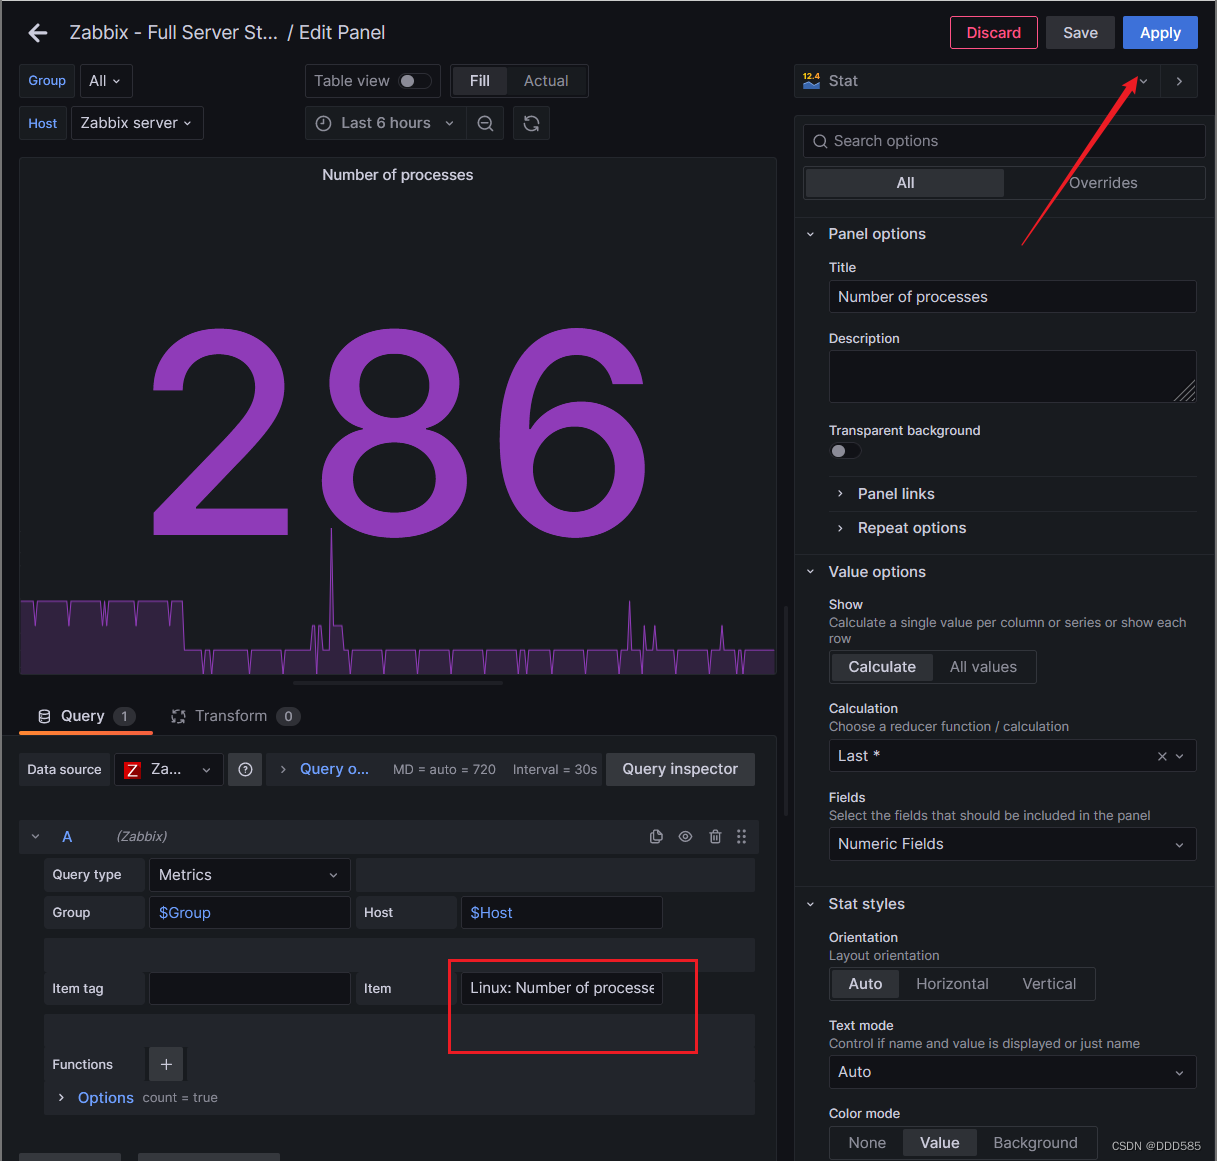
Number of processes
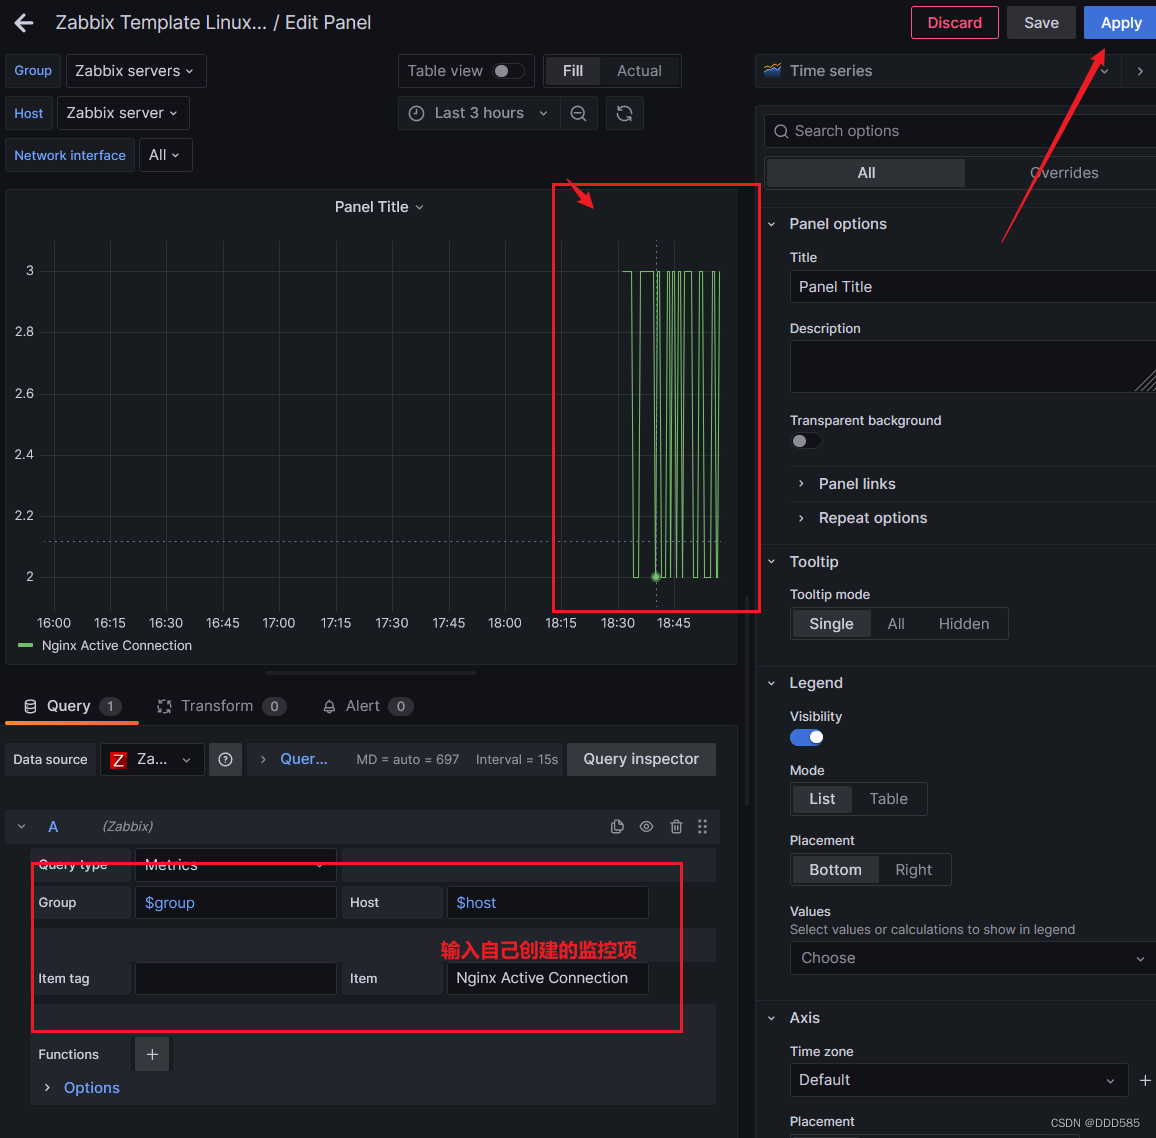
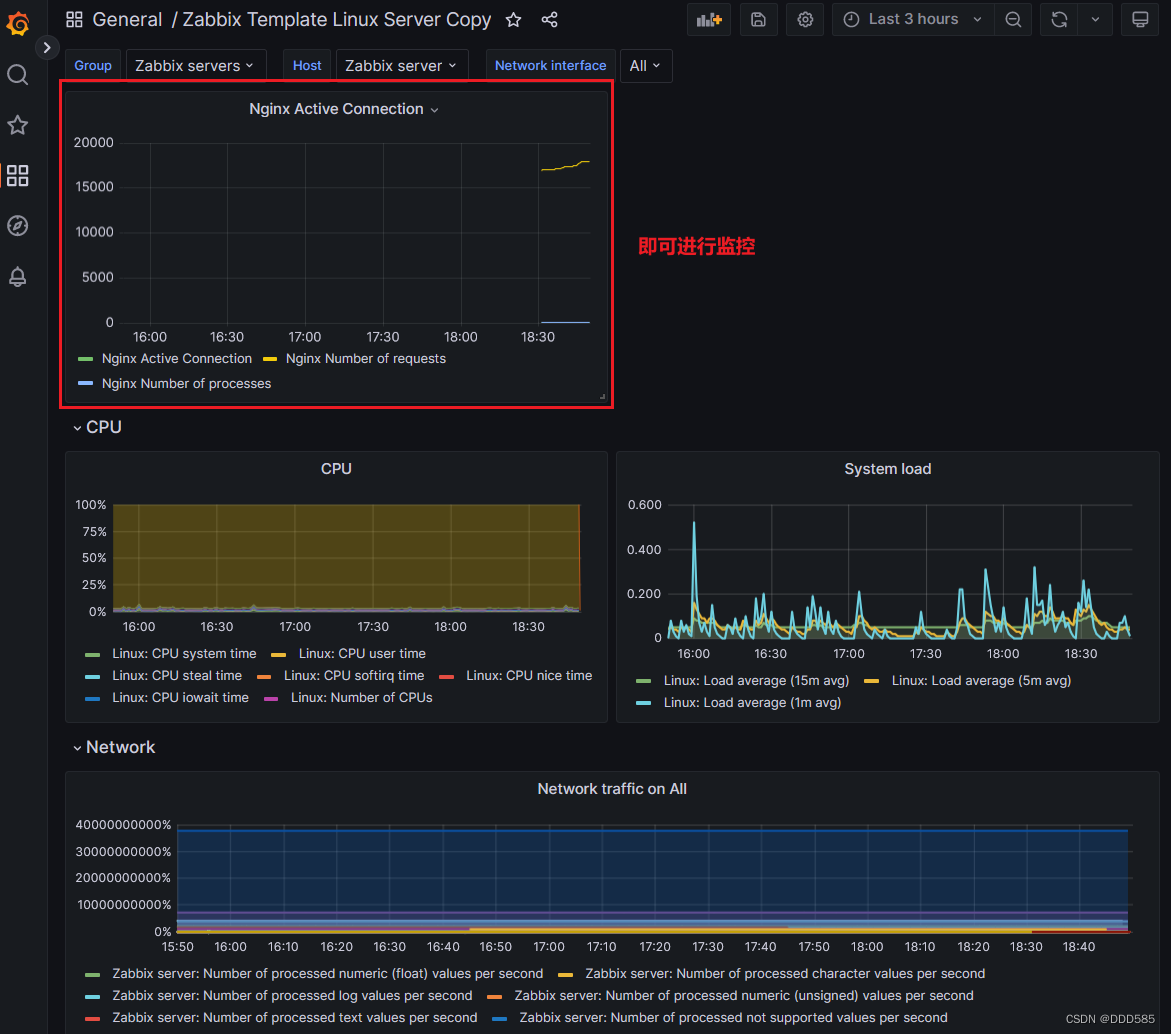
5.使用zabbix监控nginx并发量连接数
使用192.168.9.116服务器;因为该服务器原本已安装nginx,因此省略安装步骤
5.1 修改nginx配置
vim /etc/nginx/conf.d/default.conf
location /nginx_state {
stub_status on;
access_log off;
}
##12行添加,开启状态统计功能
systemctl reload nginx
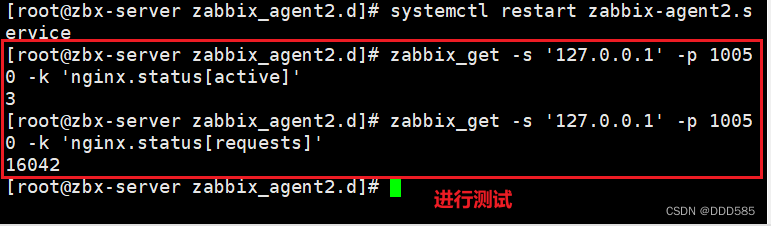
curl -s http://192.168.9.116/nginx_state #即可使用此命令查看并发量信息

5.2 编写监控数据脚本
cd /etc/zabbix/zabbix_agent2.d/
vim nginx_status.sh
#!/bin/bash
IP=192.168.9.116
PORT=80
STUB_URI=nginx_state

active() {
    curl -s http://$IP:$PORT/$STUB_URI | awk 'NR==1 {print $3}'
}

accepts() {
    curl -s http://$IP:$PORT/$STUB_URI | awk 'NR==3 {print $1}'
}
handled() {
    curl -s http://$IP:$PORT/$STUB_URI | awk 'NR==3 {print $2}'
}

requests() {
    curl -s http://$IP:$PORT/$STUB_URI | awk 'NR==3 {print $3}'
}

Reading() {
    curl -s http://$IP:$PORT/$STUB_URI | awk 'NR==4 {print $2}'
}

Writing() {
    curl -s http://$IP:$PORT/$STUB_URI | awk 'NR==4 {print $4}'
}

Waiting() {
    curl -s http://$IP:$PORT/$STUB_URI | awk 'NR==4 {print $6}'
}

process() {
    pidof nginx | wc -w
}

case $1 in
active)
    active
    ;;
accepts)
    accepts
    ;;
handled)
    handled
    ;;
requests)
    requests
    ;;
Reading)
    Reading
    ;;
Writing)
    Writing
    ;;
Waiting)
    Waiting
    ;;
process)
    process
    ;;
*)
    echo "$Usage: $0 {active|accepts|handled|requests|Reading|Writing|Waiting|process}"
    exit 1
esac
exit 0
########################################################################################
chmod +x nginx_status.sh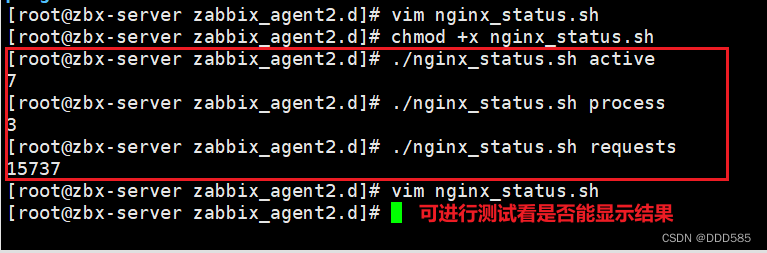
5.3 设置键值
vim nginx_state.conf
UserParameter=nginx.status[*],/etc/zabbix/zabbix_agent2.d/nginx_status.sh $1
systemctl restart zabbix-agent2.service
5.4 在zabbix web端完成自定义监控项
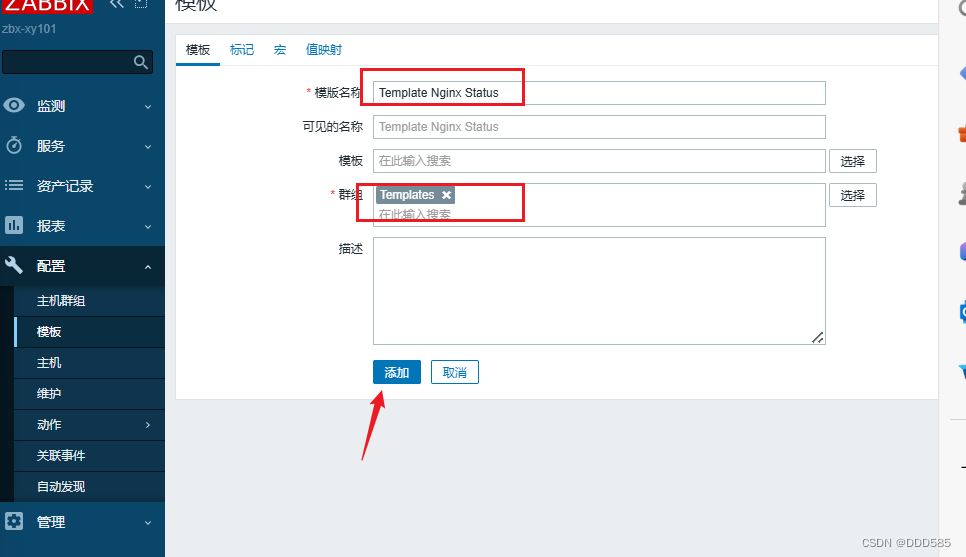
【配置】点击【模板】点击【创建模板】
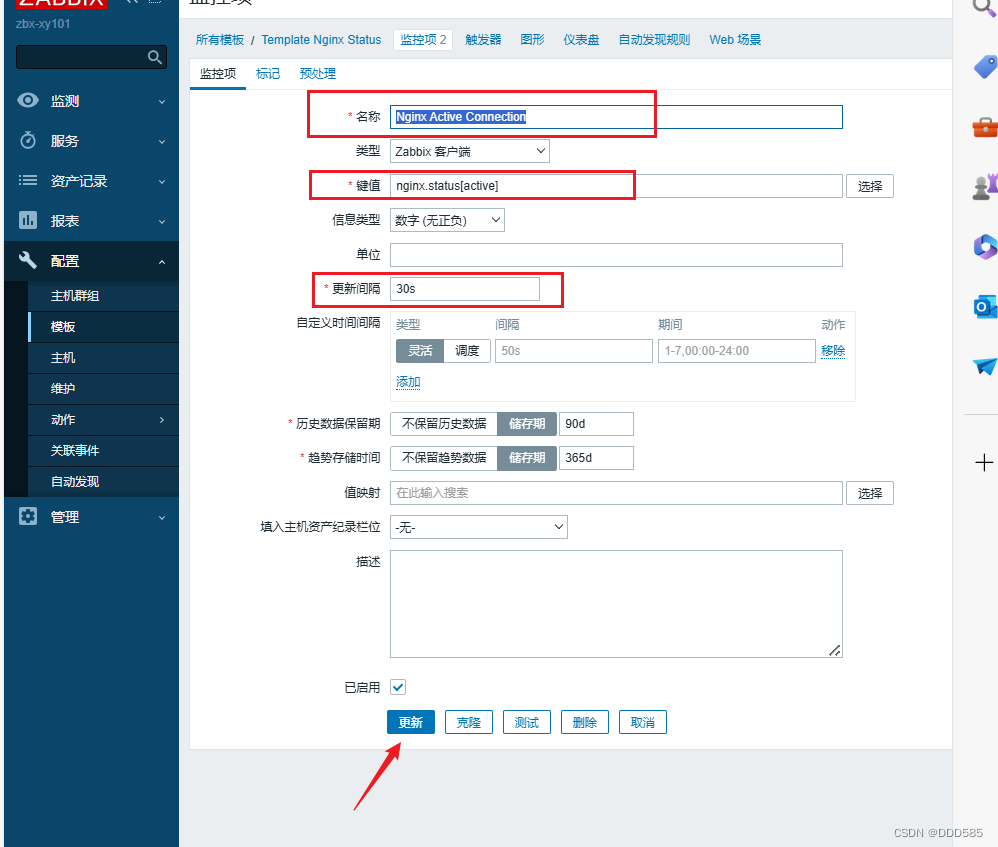
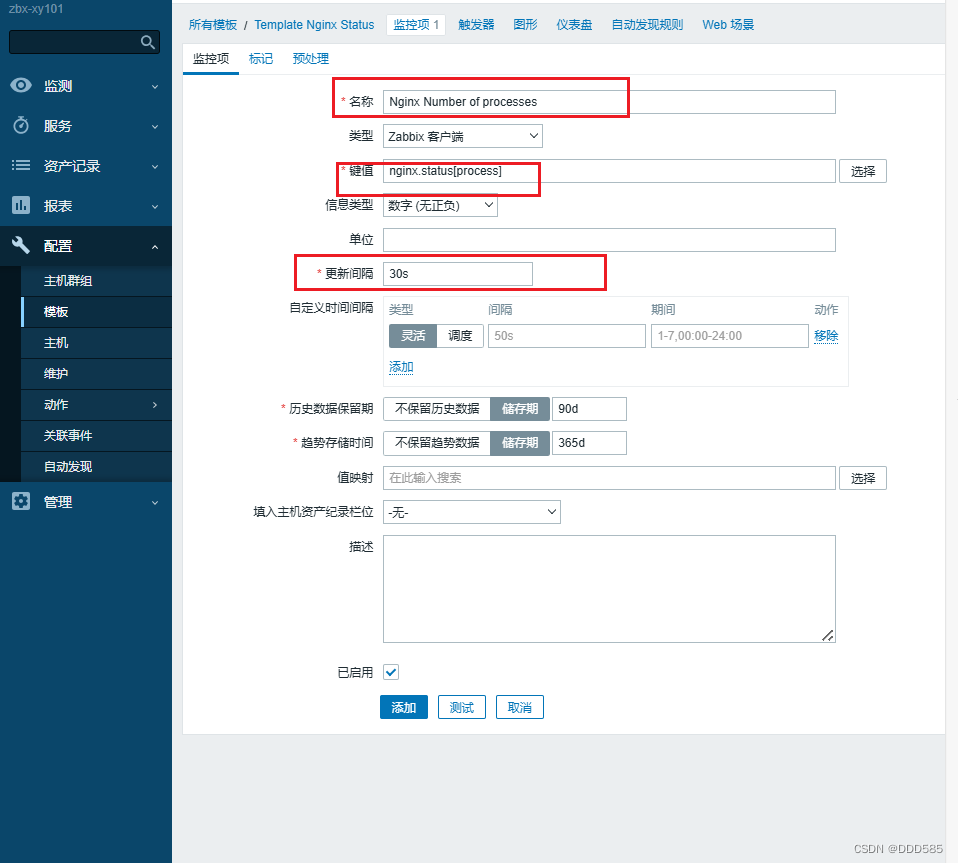
添加三个监控项
【名称】搜索【Template Nginx Status】创建的模板;点击上方【监控项】,点击创建【监控项】

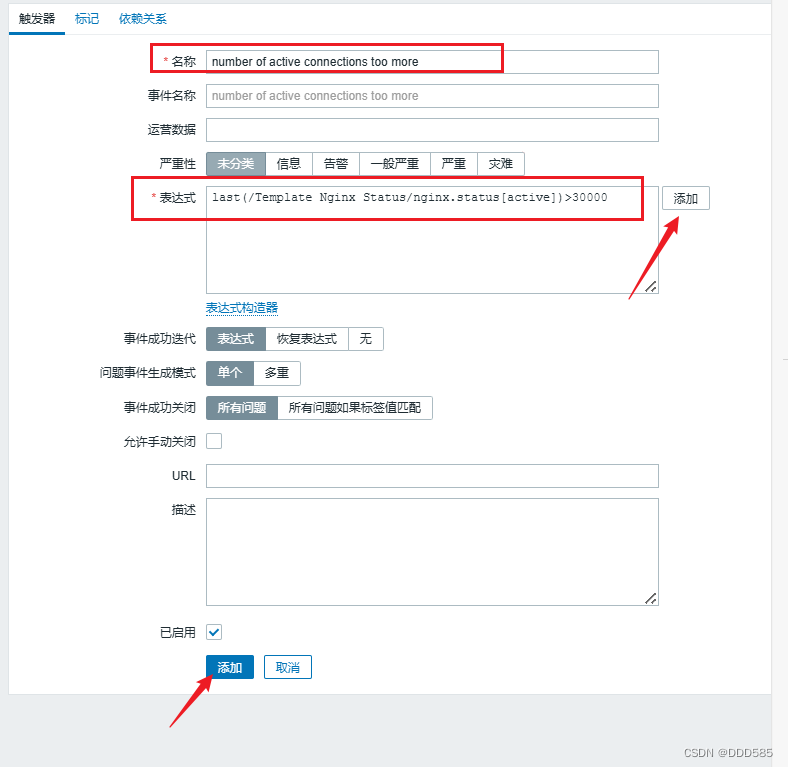
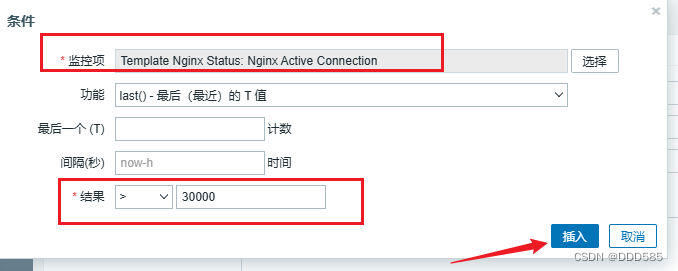
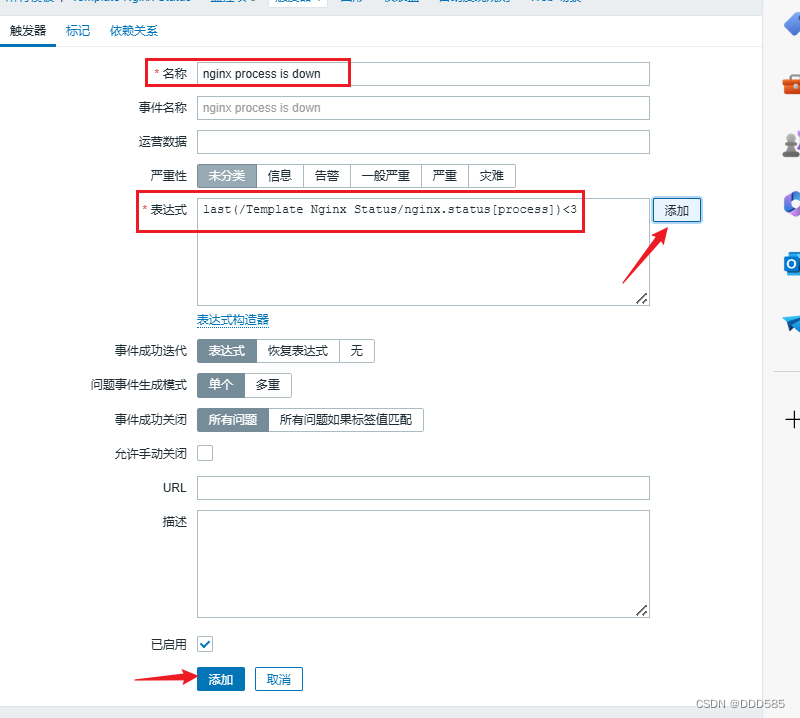
点击上方【触发器】点击【创建触发器】
连接触发器
进程触发器

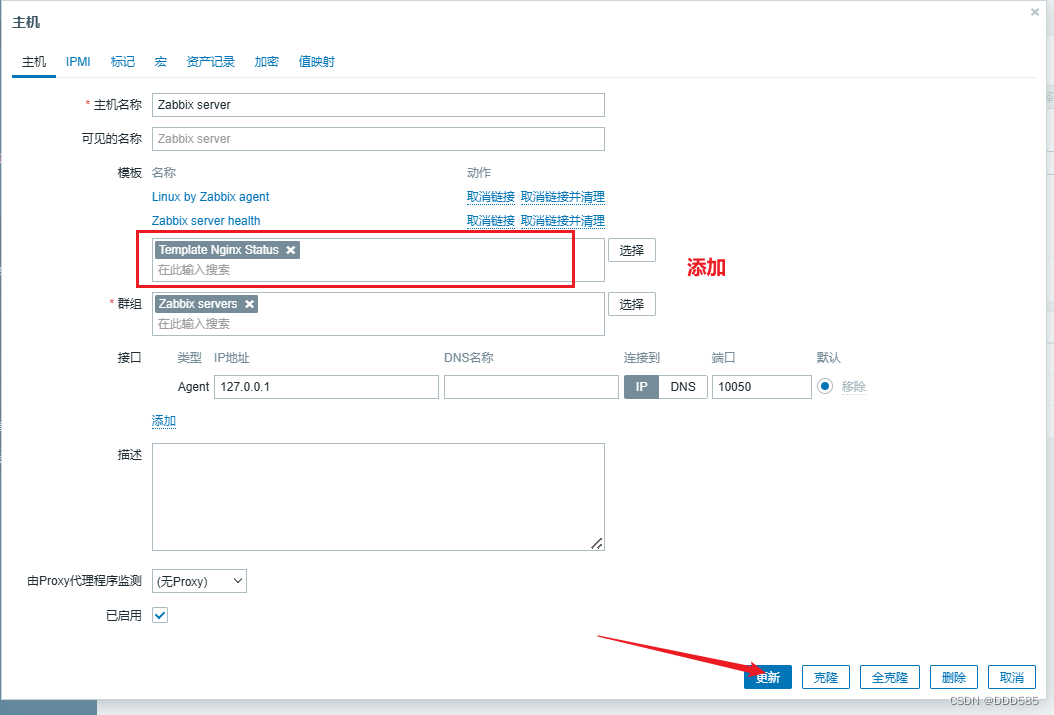
主机关联监控模板:左侧【配置】点击 【主机】点击【Zabbix server】
查看:左侧点击【监测】点击【主机】点击【Zabbix server】点击最新数据,找到添加的三个模板

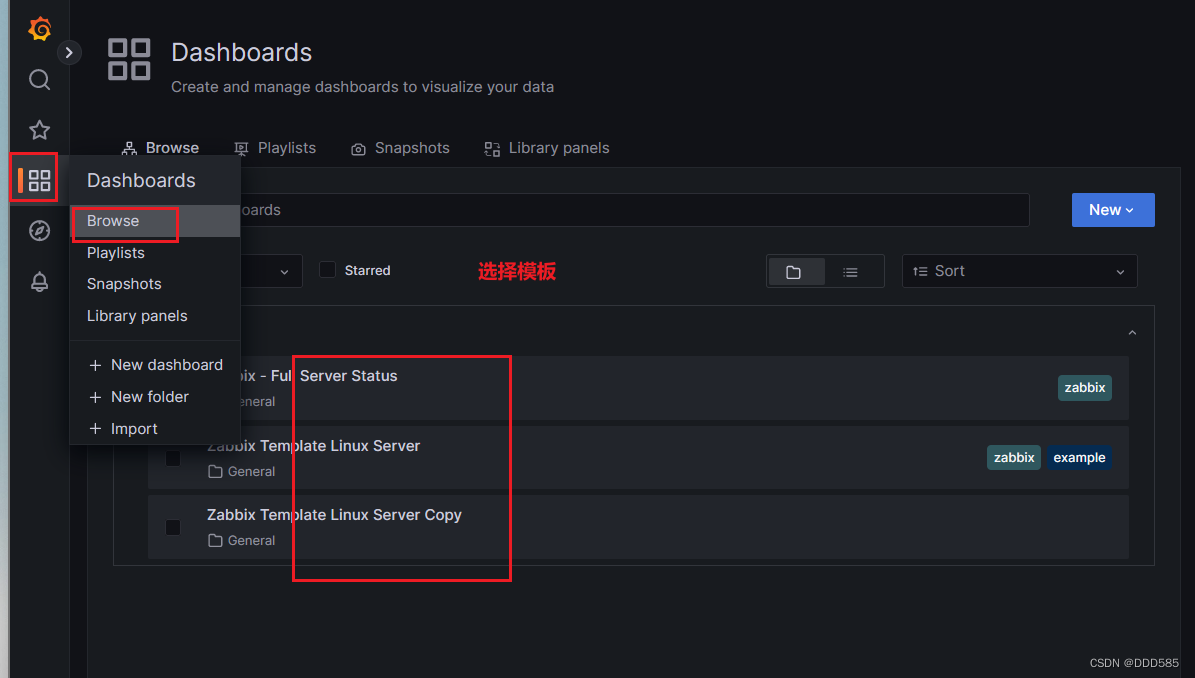
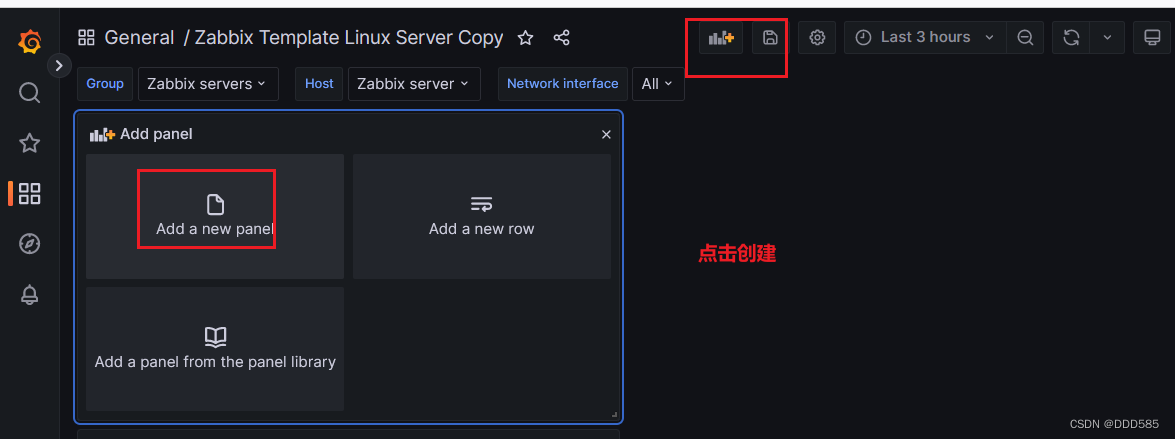
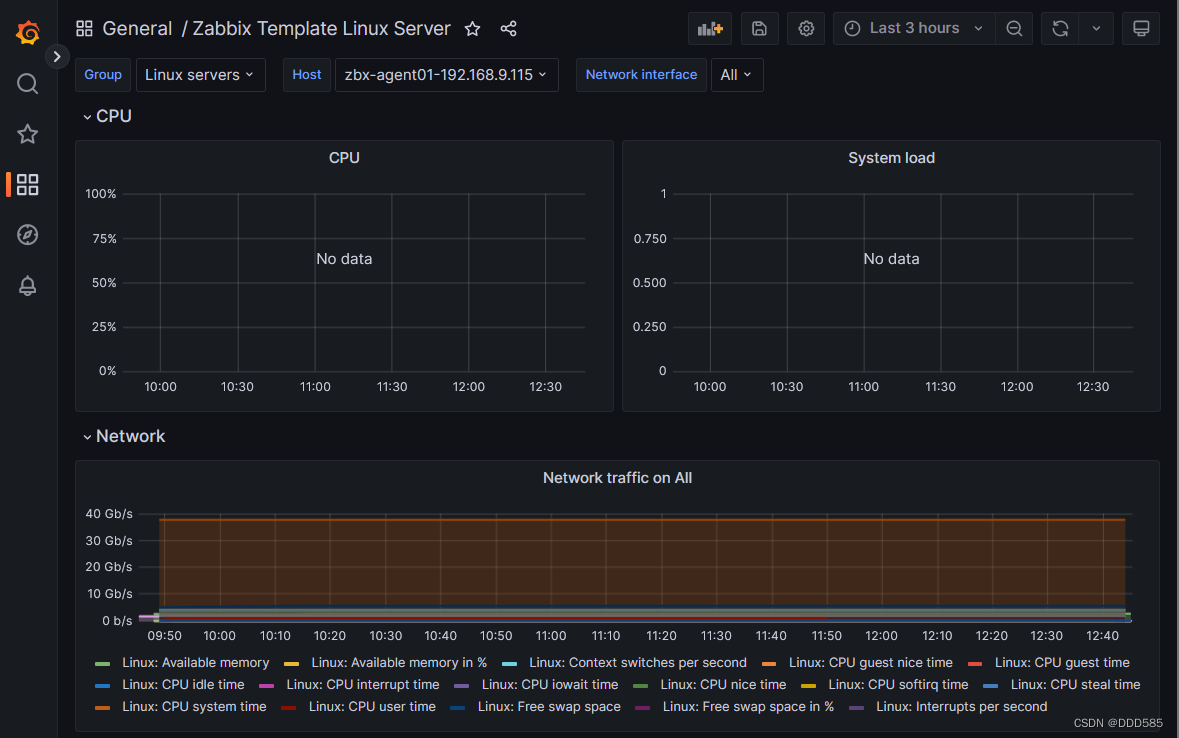
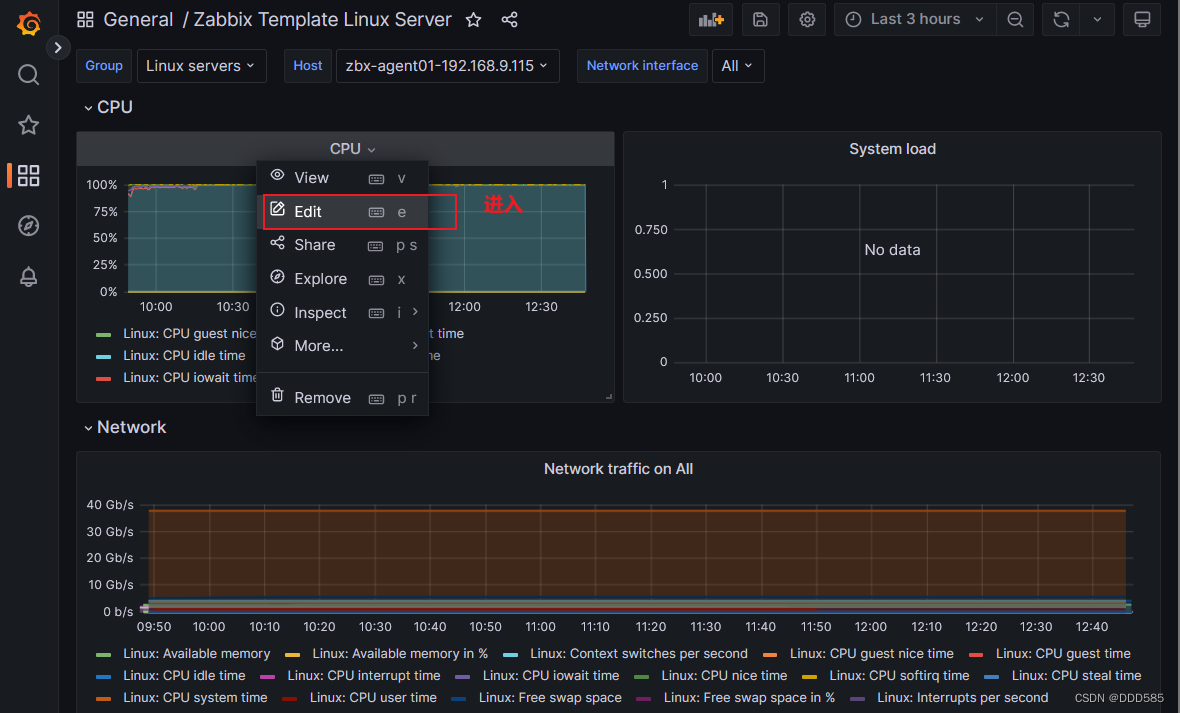
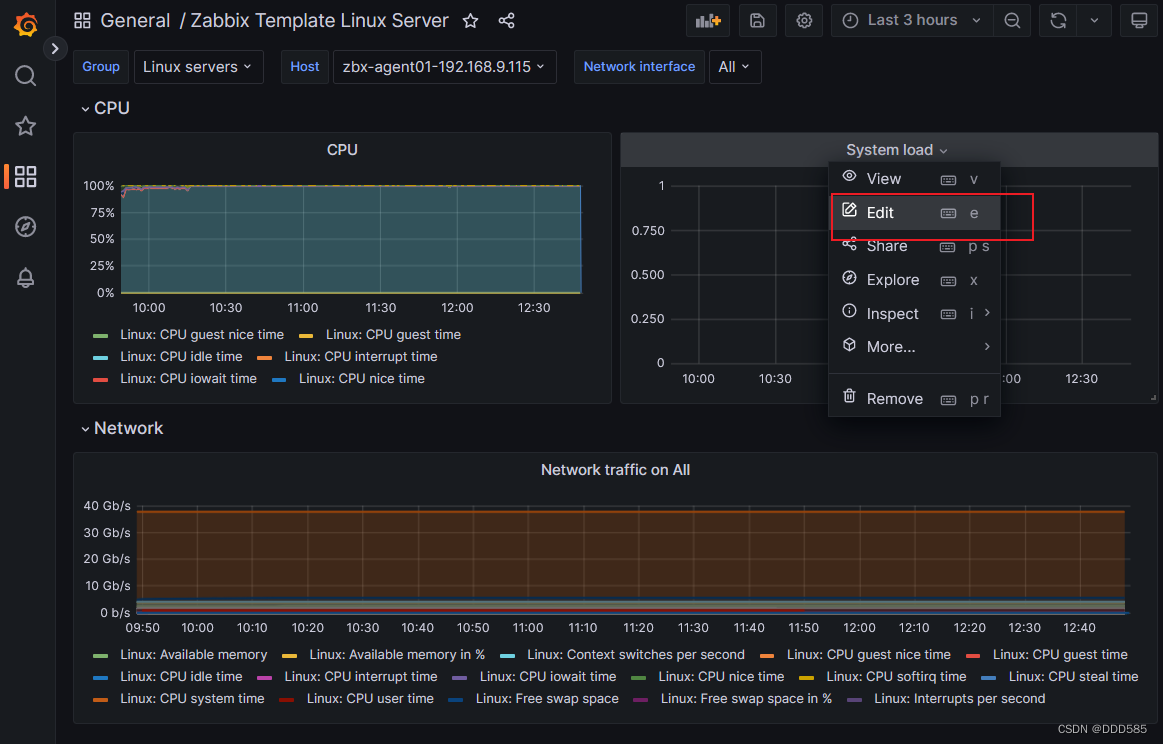
5.5 连接到grafana