时钟同步chrony
https://blog.csdn.net/weixin_44719499/article/details/156057733?spm=1011.2415.3001.5331
bash
root@elk150:~ # crontab -e
no crontab for root - using an empty one
crontab: installing new crontab
root@elk150:~ # crontab -l
*/10 * * * * /usr/sbin/ntpdate ntp.aliyun.com >/dev/null 2>&1
root@elk150:~ # which chronyd || echo "未安装"
/usr/sbin/chronyd
root@elk150:~ # which ntpdate
/usr/sbin/ntpdate
root@elk150:~ # crontab -l
*/10 * * * * /usr/sbin/ntpdate ntp.aliyun.com >/dev/null 2>&1
root@elk150:~ # ll /var/log/cron
-rw------- 1 root root 23825 12月 30 17:44 /var/log/cron
root@elk150:~ # cat /var/log/cron
Dec 21 03:10:01 elk150 run-parts(/etc/cron.daily)[129808]: finished logrotate

root@elk150:~ # crontab -e

[1]+  已停止               crontab -e
root@elk150:~ # crontab -e
crontab: installing new crontab
root@elk150:~ # crontab -l
# */10 * * * * /usr/sbin/ntpdate ntp.aliyun.com >/dev/null 2>&1
root@elk150:~ # crontab -e
crontab: installing new crontab
root@elk150:~ # crontab -l
####   阿里云 NTP 服务器

root@elk150:~ # cat >/etc/chrony.conf <<'EOF'
> # 阿里公共 NTP
> server ntp.aliyun.com iburst minpoll 4 maxpoll 10
> server ntp1.aliyun.com iburst minpoll 4 maxpoll 10
> server ntp2.aliyun.com iburst minpoll 4 maxpoll 10
> server ntp3.aliyun.com iburst minpoll 4 maxpoll 10
>
> # 本地系统时钟做备用
> stratumweight 0
> driftfile /var/lib/chrony/drift
> makestep 1.0 3
> rtcsync
> allow 127.0.0.1/8
> EOF
root@elk150:~ # systemctl restart chronyd && systemctl enable chronyd
root@elk150:~ # chronyc sources -v
210 Number of sources = 2

  .-- Source mode  '^' = server, '=' = peer, '#' = local clock.
 / .- Source state '*' = current synced, '+' = combined , '-' = not combined,
| /   '?' = unreachable, 'x' = time may be in error, '~' = time too variable.
||                                                 .- xxxx [ yyyy ] +/- zzzz
||      Reachability register (octal) -.           |  xxxx = adjusted offset,
||      Log2(Polling interval) --.      |          |  yyyy = measured offset,
||                                \     |          |  zzzz = estimated error.
||                                 |    |           \
MS Name/IP address         Stratum Poll Reach LastRx Last sample
===============================================================================
^- 203.107.6.88                  2   4     7     1  -1463us[+1370us] +/-   31ms
^* 118.31.3.89                   2   4     7     1  -1348us[+1485us] +/-   32ms
root@elk150:~ # timedatectl status
      Local time: 二 2025-12-30 17:51:34 CST
  Universal time: 二 2025-12-30 09:51:34 UTC
        RTC time: 二 2025-12-30 09:51:34
       Time zone: Asia/Shanghai (CST, +0800)
     NTP enabled: yes
NTP synchronized: yes
 RTC in local TZ: no
      DST active: n/a
root@elk150:~ # systemctl status crontab
Unit crontab.service could not be found.
root@elk150:~ # cat /var/lib/chrony/drift
          -15.978599             2.827272
root@elk150:~ # systemctl status crond
● crond.service - Command Scheduler
   Loaded: loaded (/usr/lib/systemd/system/crond.service; enabled; vendor preset: enabled)
   Active: active (running) since 二 2025-12-23 15:26:11 CST; 1 weeks 0 days ago
 Main PID: 8776 (crond)
   CGroup: /system.slice/crond.service
           └─8776 /usr/sbin/crond -n

12月 23 15:26:11 elk150 systemd[1]: Started Command Scheduler.
12月 23 15:26:11 elk150 crond[8776]: (CRON) INFO (RANDOM_DELAY will be scaled with factor 2% if used.)
12月 23 15:26:11 elk150 crond[8776]: (CRON) INFO (running with inotify support)
12月 30 17:48:01 elk150 crond[8776]: (root) RELOAD (/var/spool/cron/root)
root@elk150:~ # ^C
root@elk150:~ # timedatectl status
      Local time: 二 2025-12-30 22:57:01 CST
  Universal time: 二 2025-12-30 14:57:01 UTC
        RTC time: 二 2025-12-30 14:57:01
       Time zone: Asia/Shanghai (CST, +0800)
     NTP enabled: yes
NTP synchronized: yes
 RTC in local TZ: no
      DST active: n/a
安装 prometheus-2.33.3.linux-amd64.tar.gz
https://prometheus.io/download/
bash
root@elk150:/server/tools # wget https://github.com/prometheus/prometheus/releases/download/v2.33.3/prometheus-2.33.3.linux-amd64.tar.gz
--2025-12-30 21:21:17--  https://github.com/prometheus/prometheus/releases/download/v2.33.3/prometheus-2.33.3.linux-amd64.tar.gz
root@elk150:/server/tools # ll
-rw-r--r-- 1 root root 41242240 12月 30 21:43 prometheus-2.33.3.linux-amd64.tar.gz
root@elk150:/server/tools # rm -rf ./*
root@elk150:/server/tools # ll
总用量 0
root@elk150:/server/tools # rz
root@elk150:/server/tools # ll
总用量 74044
-r-------- 1 root root 75819309 12月 30 21:43 prometheus-2.33.3.linux-amd64.tar.gz
root@elk150:/server/tools # tar -C /app/
tar: 您必须从"-Acdtrux"或是"--test-label"选项中指定一个
请用"tar --help"或"tar --usage"获得更多信息。
root@elk150:/server/tools # tar prometheus-2.33.3.linux-amd64.tar.gz -C /app/
tar: 无效选项 -- "e"
请用"tar --help"或"tar --usage"获得更多信息。
root@elk150:/server/tools # tar -xf  prometheus-2.33.3.linux-amd64.tar.gz -C /app/
root@elk150:/server/tools # cd /app/prometheus-2.33.3.linux-amd64/
root@elk150:/app/prometheus-2.33.3.linux-amd64 # ll
总用量 196072
drwxr-xr-x 2 3434 3434        38 2月  12 2022 console_libraries
drwxr-xr-x 2 3434 3434       173 2月  12 2022 consoles
-rw-r--r-- 1 3434 3434     11357 2月  12 2022 LICENSE
-rw-r--r-- 1 3434 3434      3773 2月  12 2022 NOTICE
-rwxr-xr-x 1 3434 3434 104427627 2月  12 2022 prometheus
-rw-r--r-- 1 3434 3434       934 2月  12 2022 prometheus.yml
-rwxr-xr-x 1 3434 3434  96322328 2月  12 2022 promtool

root@elk150:/app # ln -s /app/prometheus-2.33.3.linux-amd64/ /app/prometheus
root@elk150:/app # ll
总用量 0
lrwxrwxrwx 1 root root  35 12月 30 21:49 prometheus -> /app/prometheus-2.33.3.linux-amd64/
drwxr-xr-x 4 3434 3434 132 2月  12 2022 prometheus-2.33.3.linux-amd64

root@elk150:/app/prometheus # ./prometheus --version
prometheus, version 2.33.3 (branch: HEAD, revision: 56e14463bccfbb6a8facfb663fed5e0ca9f8b387)
  build user:       root@4ee34e4f7340
  build date:       20220211-20:48:21
  go version:       go1.17.7
  platform:         linux/amd64
启动、systemctl 配置
bash
root@elk150:/app/prometheus # /app/prometheus/prometheus
ts=2025-12-30T13:52:20.731Z caller=main.go:475 level=info msg="No time or size retention was set so using the default time retention" duration=15d
root@elk150:~ # cd /app/prometheus
root@elk150:/app/prometheus # ps -ef |grep prome
root      81316  48156  0 21:52 pts/4    00:00:00 /app/prometheus/prometheus
root      90119  81639  0 21:54 pts/6    00:00:00 grep --color=auto prome
root@elk150:/app/prometheus # ps -ntlup
   PID TTY          TIME CMD
 81639 pts/6    00:00:00 bash
 91717 pts/6    00:00:00 ps
root@elk150:/app/prometheus # ss -ntlup |grep prome
tcp    LISTEN     0      128      :::9090                 :::*                   users:(("prometheus",pid=81316,fd=7))

root@elk150:/app/prometheus # ./prometheus -h
usage: prometheus [<flags>]

The Prometheus monitoring server

Flags:
  -h, --help                     Show context-sensitive help (also try --help-long and --help-man).
      --version                  Show application version.
      --config.file="prometheus.yml"
                                 Prometheus configuration file path.
      --web.listen-address="0.0.0.0:9090"
                                 Address to listen on for UI, API, and telemetry.
      --web.config.file=""       [EXPERIMENTAL] Path to configuration file that can enable TLS or authentication.
      --web.read-timeout=5m      Maximum duration before timing out read of the request, and closing idle connections.
      --web.max-connections=512  Maximum number of simultaneous connections.
      --web.external-url=<URL>   The URL under which Prometheus is externally reachable (for example, if Prometheus is served via a
                                 reverse proxy). Used for generating relative and absolute links back to Prometheus itself. If the URL
                                 has a path portion, it will be used to prefix all HTTP endpoints served by Prometheus. If omitted,
                                 relevant URL components will be derived automatically.
      --web.route-prefix=<path>  Prefix for the internal routes of web endpoints. Defaults to path of --web.external-url.
      --web.user-assets=<path>   Path to static asset directory, available at /user.
      --web.enable-lifecycle     Enable shutdown and reload via HTTP request.
      --web.enable-admin-api     Enable API endpoints for admin control actions.
      --web.enable-remote-write-receiver
                                 Enable API endpoint accepting remote write requests.
      --web.console.templates="consoles"
                                 Path to the console template directory, available at /consoles.
      --web.console.libraries="console_libraries"
                                 Path to the console library directory.
      --web.page-title="Prometheus Time Series Collection and Processing Server"
                                 Document title of Prometheus instance.
      --web.cors.origin=".*"     Regex for CORS origin. It is fully anchored. Example: 'https?://(domain1|domain2)\.com'
      --storage.tsdb.path="data/"
                                 Base path for metrics storage. Use with server mode only.
      --storage.tsdb.retention=STORAGE.TSDB.RETENTION
                                 [DEPRECATED] How long to retain samples in storage. This flag has been deprecated, use
                                 "storage.tsdb.retention.time" instead. Use with server mode only.
      --storage.tsdb.retention.time=STORAGE.TSDB.RETENTION.TIME
                                 How long to retain samples in storage. When this flag is set it overrides "storage.tsdb.retention". If
                                 neither this flag nor "storage.tsdb.retention" nor "storage.tsdb.retention.size" is set, the retention
                                 time defaults to 15d. Units Supported: y, w, d, h, m, s, ms. Use with server mode only.
      --storage.tsdb.retention.size=STORAGE.TSDB.RETENTION.SIZE
                                 Maximum number of bytes that can be stored for blocks. A unit is required, supported units: B, KB, MB,
                                 GB, TB, PB, EB. Ex: "512MB". Use with server mode only.
      --storage.tsdb.no-lockfile
                                 Do not create lockfile in data directory. Use with server mode only.
      --storage.tsdb.allow-overlapping-blocks
                                 Allow overlapping blocks, which in turn enables vertical compaction and vertical query merge. Use with
                                 server mode only.
      --storage.agent.path="data-agent/"
                                 Base path for metrics storage. Use with agent mode only.
      --storage.agent.wal-compression
                                 Compress the agent WAL. Use with agent mode only.
      --storage.agent.retention.min-time=STORAGE.AGENT.RETENTION.MIN-TIME
                                 Minimum age samples may be before being considered for deletion when the WAL is truncated Use with agent
                                 mode only.
      --storage.agent.retention.max-time=STORAGE.AGENT.RETENTION.MAX-TIME
                                 Maximum age samples may be before being forcibly deleted when the WAL is truncated Use with agent mode
                                 only.
      --storage.agent.no-lockfile
                                 Do not create lockfile in data directory. Use with agent mode only.
      --storage.remote.flush-deadline=<duration>
                                 How long to wait flushing sample on shutdown or config reload.
      --storage.remote.read-sample-limit=5e7
                                 Maximum overall number of samples to return via the remote read interface, in a single query. 0 means no
                                 limit. This limit is ignored for streamed response types. Use with server mode only.
      --storage.remote.read-concurrent-limit=10
                                 Maximum number of concurrent remote read calls. 0 means no limit. Use with server mode only.
      --storage.remote.read-max-bytes-in-frame=1048576
                                 Maximum number of bytes in a single frame for streaming remote read response types before marshalling.
                                 Note that client might have limit on frame size as well. 1MB as recommended by protobuf by default. Use
                                 with server mode only.
      --rules.alert.for-outage-tolerance=1h
                                 Max time to tolerate prometheus outage for restoring "for" state of alert. Use with server mode only.
      --rules.alert.for-grace-period=10m
                                 Minimum duration between alert and restored "for" state. This is maintained only for alerts with
                                 configured "for" time greater than grace period. Use with server mode only.
      --rules.alert.resend-delay=1m
                                 Minimum amount of time to wait before resending an alert to Alertmanager. Use with server mode only.
      --alertmanager.notification-queue-capacity=10000
                                 The capacity of the queue for pending Alertmanager notifications. Use with server mode only.
      --query.lookback-delta=5m  The maximum lookback duration for retrieving metrics during expression evaluations and federation. Use
                                 with server mode only.
      --query.timeout=2m         Maximum time a query may take before being aborted. Use with server mode only.
      --query.max-concurrency=20
                                 Maximum number of queries executed concurrently. Use with server mode only.
      --query.max-samples=50000000
                                 Maximum number of samples a single query can load into memory. Note that queries will fail if they try
                                 to load more samples than this into memory, so this also limits the number of samples a query can
                                 return. Use with server mode only.
      --enable-feature= ...      Comma separated feature names to enable. Valid options: agent, exemplar-storage, expand-external-labels,
                                 memory-snapshot-on-shutdown, promql-at-modifier, promql-negative-offset, remote-write-receiver
                                 (DEPRECATED), extra-scrape-metrics, new-service-discovery-manager. See
                                 https://prometheus.io/docs/prometheus/latest/feature_flags/ for more details.
      --log.level=info           Only log messages with the given severity or above. One of: [debug, info, warn, error]
      --log.format=logfmt        Output format of log messages. One of: [logfmt, json]

root@elk150:/app/prometheus # nohup /app/prometheus/prometheus &>>/var/log/promethus.log &
[1] 62290
root@elk150:/app/prometheus # ps -ef |grep prome
root      35856  81639  0 22:38 pts/6    00:00:00 grep --color=auto prome
root      81316  48156  0 21:52 pts/4    00:00:01 /app/prometheus/prometheus
[1]+  退出 1                nohup /app/prometheus/prometheus &>>/var/log/promethus.log
root@elk150:/app/prometheus # kill 81316
root@elk150:/app/prometheus # ps -ef |grep prome
root      39447  81639  0 22:39 pts/6    00:00:00 grep --color=auto prome

root@elk150:/app/prometheus # nohup /app/prometheus/prometheus &>>/var/log/promethus.log &
[1] 43209
root@elk150:/app/prometheus # tail -f /var/log/promethus.log
console_libraries/ consoles/          data/              LICENSE            NOTICE             prometheus         prometheus.yml     promtool
root@elk150:/app/prometheus # tail -f /var/log/promethus.log
ts=2025-12-30T14:40:28.319Z caller=head.go:527 level=info component=tsdb msg="On-disk memory mappable chunks replay completed" duration=7.816µs
root@elk150:/app/prometheus # ss -tnl
State       Recv-Q Send-Q                                   Local Address:Port                                                  Peer Address:Port
LISTEN      0      128                                                  *:22                                                               *:*
LISTEN      0      100                                          127.0.0.1:25                                                               *:*
LISTEN      0      128                                                 :::22                                                              :::*
LISTEN      0      100                                                ::1:25                                                              :::*
LISTEN      0      128                                                 :::9090                                                            :::*
root@elk150:/app/prometheus # tail -f /var/log/promethus.log
ts=2025-12-30T14:40:28.319Z caller=head.go:527 level=info component=tsdb msg="On-disk memory mappable chunks replay completed" duration=7.816µs
# 没有启动成 lookup localhost on 8.8.8.8:53: no such host
root@elk150:/app/prometheus # curl localhost:9090/api/v1/targets
# {"status":"success","data":{"activeTargets":[{"discoveredLabels":{"__address__":"localhost:9090","__metrics_path__":"/metrics","__scheme__":"http","__scrape_interval__":"15s","__scrape_timeout__":"10s","job":"prometheus"},"labels":{"instance":"localhost:9090","job":"prometheus"},"scrapePool":"prometheus","scrapeUrl":"http://localhost:9090/metrics","globalUrl":"http://elk150:9090/metrics","lastError":"Get \"http://localhost:9090/metrics\": dial tcp: lookup localhost on 8.8.8.8:53: no such host","lastScrape":"2025-12-30T23:00:44.881241501+08:00","lastScrapeDuration":0.06180609,
# "health":"down","scrapeInterval":"15s","scrapeTimeout":"10s"}],"droppedTargets":[]}}root@elk150:/app/prometheus #
root@elk150:/app/prometheus # ping -c1 localhost   # 能通即可
PING localhost (127.0.0.1) 56(84) bytes of data.
64 bytes from localhost (127.0.0.1): icmp_seq=1 ttl=64 time=0.054 ms

--- localhost ping statistics ---
root@elk150:/app/prometheus # vim  /etc/hosts localhost
root@elk150:/app/prometheus # curl localhost:9090/api/v1/targets
# {"status":"success","data":{"activeTargets":[{"discoveredLabels":{"__address__":"localhost:9090","__metrics_path__":"/metrics","__scheme__":"http","__scrape_interval__":"15s","__scrape_timeout__":"10s","job":"prometheus"},"labels":{"instance":"localhost:9090","job":"prometheus"},"scrapePool":"prometheus","scrapeUrl":"http://localhost:9090/metrics","globalUrl":"http://elk150:9090/metrics","lastError":"","lastScrape":"2025-12-30T23:04:44.881241501+08:00","lastScrapeDuration":0.003697863,
# "health":"up","scrapeInterval":"15s","scrapeTimeout":"10s"}],"droppedTargets":[]}}root@elk150:/app/prometheus #
root@elk150:/app/prometheus #
root@elk150:/app/prometheus # curl -s http://10.0.0.150:9090/metrics | grep -v "#" | wc -l
691
root@elk150:/app/prometheus # cat /etc/rc
rc0.d/    rc1.d/    rc2.d/    rc3.d/    rc4.d/    rc5.d/    rc6.d/    rc.d/     rc.local
root@elk150:/app/prometheus # cat /etc/rc.local
#!/bin/bash
# THIS FILE IS ADDED FOR COMPATIBILITY PURPOSES
#
# It is highly advisable to create own systemd services or udev rules
# to run scripts during boot instead of using this file.
#
# In contrast to previous versions due to parallel execution during boot
# this script will NOT be run after all other services.
#
# Please note that you must run 'chmod +x /etc/rc.d/rc.local' to ensure
# that this script will be executed during boot.

touch /var/lock/subsys/local
root@elk150:/app/prometheus # sudo vim /etc/systemd/system/prometheus.service
root@elk150:/app/prometheus # cat /etc/systemd/system/prometheus.service
[Unit]
Description=Prometheus Monitoring
Documentation=https://prometheus.io/docs/introduction/overview/
After=network.target

[Service]
Type=simple
User=prometheus
Group=prometheus
ExecStart=/app/prometheus/prometheus  \
  --config.file=/app/prometheus/prometheus.yml \
  --web.listen-address=0.0.0.0:9090 \
  --web.max-connections=512 \
  --storage.tsdb.path=/app/prometheus/data/ \
  --log.level=info \
  --log.format=logfmt
Restart=on-failure
RestartSec=5

[Install]
WantedBy=multi-user.target
root@elk150:/app/prometheus # ss -ntl
State       Recv-Q Send-Q                                   Local Address:Port                                                  Peer Address:Port
LISTEN      0      128                                                  *:22                                                               *:*
LISTEN      0      100                                          127.0.0.1:25                                                               *:*
LISTEN      0      128                                                 :::22                                                              :::*
LISTEN      0      100                                                ::1:25                                                              :::*
LISTEN      0      128                                                 :::9090                                                            :::*
root@elk150:/app/prometheus # ps -ef |grep prometheus
root      43209  81639  0 12月30 pts/6  00:00:34 /app/prometheus/prometheus
root      51844  81639  0 09:04 pts/6    00:00:00 grep --color=auto prometheus
root@elk150:/app/prometheus # kill -9 43209
root@elk150:/app/prometheus # ps -ef |grep prometheus
root      52852  81639  0 09:04 pts/6    00:00:00 grep --color=auto prometheus
[1]+  已杀死               nohup /app/prometheus/prometheus &>>/var/log/promethus.log

root@elk150:/app/prometheus # sudo groupadd --system prometheus
root@elk150:/app/prometheus # sudo useradd --system --no-create-home --shell /sbin/nologin --gid prometheus prometheus
root@elk150:/app/prometheus # sudo chown -R prometheus:prometheus /app/prometheus
root@elk150:/app/prometheus # sudo chmod -R 750 /app/prometheus

root@elk150:/app/prometheus # id prometheus
uid=995(prometheus) gid=993(prometheus) 组=993(prometheus)

root@elk150:/app/prometheus # sudo systemctl daemon-reload
root@elk150:/app/prometheus # sudo systemctl start prometheus
root@elk150:/app/prometheus # sudo systemctl status -l prometheus
● prometheus.service - Prometheus Monitoring
   Loaded: loaded (/etc/systemd/system/prometheus.service; disabled; vendor preset: disabled)
   Active: activating (auto-restart) (Result: exit-code) since 三 2025-12-31 09:15:40 CST; 802ms ago

root@elk150:/app/prometheus # journalctl -u prometheus -f
-- Logs begin at 二 2025-12-23 15:26:08 CST. --
12月 31 09:15:46 elk150 systemd[115875]: Failed at step EXEC spawning /app/prometheus/prometheus: Permission denied

root@elk150:/app/prometheus # sudo chown -R prometheus:prometheus /app/prometheus-2.33.3.linux-amd64
root@elk150:/app/prometheus # ls -l /app/prometheus/prometheus
-rwxr-x--- 1 prometheus prometheus 104427627 2月  12 2022 /app/prometheus/prometheus
root@elk150:/app/prometheus # ll
总用量 196072
drwxr-x--- 2 prometheus prometheus        38 2月  12 2022 console_libraries
drwxr-x--- 2 prometheus prometheus       173 2月  12 2022 consoles
drwxr-x--- 8 prometheus prometheus       206 12月 31 09:00 data
-rwxr-x--- 1 prometheus prometheus     11357 2月  12 2022 LICENSE
-rwxr-x--- 1 prometheus prometheus      3773 2月  12 2022 NOTICE
-rwxr-x--- 1 prometheus prometheus 104427627 2月  12 2022 prometheus
-rwxr-x--- 1 prometheus prometheus       934 2月  12 2022 prometheus.yml
-rwxr-x--- 1 prometheus prometheus  96322328 2月  12 2022 promtool
root@elk150:/app/prometheus # sudo systemctl start prometheus
root@elk150:/app/prometheus # sudo systemctl status -l prometheus
● prometheus.service - Prometheus Monitoring
   Loaded: loaded (/etc/systemd/system/prometheus.service; disabled; vendor preset: disabled)
   Active: active (running) since 三 2025-12-31 09:16:49 CST; 1min 20s ago
     Docs: https://prometheus.io/docs/introduction/overview/
 Main PID: 121978 (prometheus)
   CGroup: /system.slice/prometheus.service
           └─121978 /app/prometheus/prometheus --config.file=/app/prometheus/prometheus.yml --web.listen-address=0.0.0.0:9090 --web.max-connections=512 --storage.tsdb.path=/app/prometheus/data/ --log.level=info --log.format=logfmt

12月 31 09:16:49 elk150 prometheus[121978]: ts=2025-12-31T01:16:49.431Z caller=head.go:604 level=info component=tsdb msg="WAL segment loaded" segment=5 maxSegment=8
root@elk150:/app/prometheus # journalctl -u prometheus -f
-- Logs begin at 二 2025-12-23 15:26:08 CST. --
12月 31 09:16:49 elk150 prometheus[121978]: ts=2025-12-31T01:16:4
grafana-enterprise_12.3.1_20271043721_linux_amd64.tar.gz
bash
root@elk150:~ # ll
总用量 769096
-rw-------. 1 root root      1432 12月 17 21:50 anaconda-ks.cfg
-rw-r--r--  1 root root         0 12月 26 17:32 -d
-rw-r--r--  1 root root 311873551 4月  20 2022 elasticsearch-7.17.3-x86_64.rpm
drwxr-xr-x  2 root root        45 12月 19 09:07 es
-rw-r--r--  1 root root 207315531 12月 31 16:00 grafana-enterprise_12.3.1_20271043721_linux_amd64.tar.gz
-rw-r--r--  1 root root         0 12月 26 17:32 -H
-rw-r--r--  1 root root 268348045 4月  20 2022 kibana-7.17.3-x86_64.rpm
lrwxrwxrwx  1 root root         4 12月 18 22:35 t -> test
drwxr-xr-x  2 root root         6 12月 18 22:32 textd
-rw-r--r--. 1 root root         4 12月 18 15:49 text.txt
root@elk150:~ # tar -xf grafana-enterprise_12.3.1_20271043721_linux_amd64.tar.gz -C /app/
root@elk150:~ # ss -tnl
State       Recv-Q Send-Q           Local Address:Port                          Peer Address:Port
LISTEN      0      128                          *:22                                       *:*
LISTEN      0      100                  127.0.0.1:25                                       *:*
LISTEN      0      128                         :::9100                                    :::*
LISTEN      0      128                         :::22                                      :::*
LISTEN      0      128                         :::3000                                    :::*
LISTEN      0      100                        ::1:25                                      :::*
LISTEN      0      128                         :::9090                                    :::*
root@elk150:~ # ll
总用量 769096
-rw-------. 1 root root      1432 12月 17 21:50 anaconda-ks.cfg
-rw-r--r--  1 root root         0 12月 26 17:32 -d
-rw-r--r--  1 root root 311873551 4月  20 2022 elasticsearch-7.17.3-x86_64.rpm
drwxr-xr-x  2 root root        45 12月 19 09:07 es
-rw-r--r--  1 root root 207315531 12月 31 16:00 grafana-enterprise_12.3.1_20271043721_linux_amd64.tar.gz
-rw-r--r--  1 root root         0 12月 26 17:32 -H
-rw-r--r--  1 root root 268348045 4月  20 2022 kibana-7.17.3-x86_64.rpm
lrwxrwxrwx  1 root root         4 12月 18 22:35 t -> test
drwxr-xr-x  2 root root         6 12月 18 22:32 textd
-rw-r--r--. 1 root root         4 12月 18 15:49 text.txt
root@elk150:~ # ll /server/tools/
总用量 82868
drwxr-xr-x 2 root root        6 12月 31 10:59 -
-r-------- 1 root root  9033415 12月 31 10:57 node_exporter-1.3.1.linux-amd64.tar.gz
-r-------- 1 root root 75819309 12月 30 21:43 prometheus-2.33.3.linux-amd64.tar.gz
root@elk150:~ # mv grafana-enterprise_12.3.1_20271043721_linux_amd64.tar.gz  /server/tools/
root@elk150:~ # ll
总用量 566636
-rw-------. 1 root root      1432 12月 17 21:50 anaconda-ks.cfg
-rw-r--r--  1 root root         0 12月 26 17:32 -d
-rw-r--r--  1 root root 311873551 4月  20 2022 elasticsearch-7.17.3-x86_64.rpm
drwxr-xr-x  2 root root        45 12月 19 09:07 es
-rw-r--r--  1 root root         0 12月 26 17:32 -H
-rw-r--r--  1 root root 268348045 4月  20 2022 kibana-7.17.3-x86_64.rpm
lrwxrwxrwx  1 root root         4 12月 18 22:35 t -> test
drwxr-xr-x  2 root root         6 12月 18 22:32 textd
-rw-r--r--. 1 root root         4 12月 18 15:49 text.txt
root@elk150:~ # cd /server/tools/
root@elk150:/server/tools # ll
总用量 285328
drwxr-xr-x 2 root root         6 12月 31 10:59 -
-rw-r--r-- 1 root root 207315531 12月 31 16:00 grafana-enterprise_12.3.1_20271043721_linux_amd64.tar.gz
-r-------- 1 root root   9033415 12月 31 10:57 node_exporter-1.3.1.linux-amd64.tar.gz
-r-------- 1 root root  75819309 12月 30 21:43 prometheus-2.33.3.linux-amd64.tar.gz
root@elk150:/server/tools # rz
root@elk150:/server/tools # ll /app/
grafana/                       grafana-12.3.1/                prometheus/                    prometheus-2.33.3.linux-amd64/
root@elk150:/server/tools # ll /app/
grafana/                       grafana-12.3.1/                prometheus/                    prometheus-2.33.3.linux-amd64/
root@elk150:/server/tools # ll /app/prometheus
lrwxrwxrwx 1 prometheus prometheus 35 12月 30 21:49 /app/prometheus -> /app/prometheus-2.33.3.linux-amd64/
root@elk150:/server/tools # ll /app/prometheus/
console_libraries/   data/                node-exporter/       prometheus           prometheus-back.yml  promtool
consoles/            LICENSE              NOTICE               prometheus1.yml      prometheus.yml       targets/
root@elk150:/server/tools #
启动、systemctl 配置
bash
root@elk150:/app/alertmanager # cd ../
root@elk150:/app # cd prometheus
root@elk150:/app/prometheus # vim alertmanager.yml
root@elk150:/app/prometheus # cat alertmanager.yml
global:
  resolve_timeout: 5m
  smtp_smarthost: 'smtp.exmail.qq.com:465'
  smtp_from: 'alert@yourcompany.com'
  smtp_auth_username: 'alert@yourcompany.com'
  smtp_auth_password: 'your_email_password_or_token'
  smtp_require_tls: false

route:
  group_by: ['alertname', 'job']
  group_wait: 30s
  group_interval: 5m
  repeat_interval: 3h
  receiver: 'email'

receivers:
  - name: 'email'
    email_configs:
      - to: 'ops-team@yourcompany.com'
        send_resolved: true
root@elk150:/app/prometheus # ll
总用量 196088
-rw-r--r--  1 root       root             473 1月   3 11:54 alertmanager.yml
drwxr-x---  2 prometheus prometheus        38 2月  12 2022 console_libraries
drwxr-x---  2 prometheus prometheus       173 2月  12 2022 consoles
drwxr-x--- 13 prometheus prometheus      4096 1月   3 11:00 data
-rwxr-x---  1 prometheus prometheus     11357 2月  12 2022 LICENSE
drwxr-xr-x  3 root       root              45 12月 31 11:01 node-exporter
-rwxr-x---  1 prometheus prometheus      3773 2月  12 2022 NOTICE
-rwxr-x---  1 prometheus prometheus 104427627 2月  12 2022 prometheus
-rwxr-x---  1 root       root             453 12月 31 14:22 prometheus1.yml
-rwxr-x---  1 root       root             938 12月 31 10:18 prometheus-back.yml
-rwxr-x---  1 prometheus prometheus       620 12月 31 15:13 prometheus.yml
-rwxr-x---  1 prometheus prometheus  96322328 2月  12 2022 promtool
drwxr-xr-x  2 root       root              57 12月 31 15:05 targets
root@elk150:/app/prometheus # systemctl status prometheus.service
● prometheus.service - Prometheus Monitoring
   Loaded: loaded (/etc/systemd/system/prometheus.service; disabled; vendor preset: disabled)
   Active: active (running) since 三 2025-12-31 15:15:00 CST; 2 days ago
     Docs: https://prometheus.io/docs/introduction/overview/
 Main PID: 63750 (prometheus)
   CGroup: /system.slice/prometheus.service
           └─63750 /app/prometheus/prometheus --config.file=/app/prometheus/prometheus.yml --web.listen-address=0.0.0.0:9090 --web.max-conne...

1月 03 11:00:05 elk150 prometheus[63750]: ts=2026-01-03T03:00:05.189Z caller=checkpoint.go:98 level=info component=tsdb msg="Creatin...5600000
1月 03 11:00:05 elk150 prometheus[63750]: ts=2026-01-03T03:00:05.237Z caller=head.go:987 level=info component=tsdb msg="WAL checkpoi...85467ms
Hint: Some lines were ellipsized, use -l to show in full.
root@elk150:/app/prometheus # systemctl stop prometheus.service
root@elk150:/app/prometheus # systemctl start prometheus
root@elk150:/app/prometheus # systemctl stop prometheus.service
root@elk150:/app/prometheus # systemctl start  prometheus.service
root@elk150:/app/prometheus # systemctl status prometheus.service -l
● prometheus.service - Prometheus Monitoring
   Loaded: loaded (/etc/systemd/system/prometheus.service; disabled; vendor preset: disabled)
   Active: activating (auto-restart) (Result: exit-code) since 六 2026-01-03 12:45:04 CST; 2s ago
     Docs: https://prometheus.io/docs/introduction/overview/
  Process: 58107 ExecStart=/app/prometheus/prometheus --config.file=/app/prometheus/prometheus.yml --web.listen-address=0.0.0.0:9090 --web.max-connections=512 --storage.tsdb.path=/app/prometheus/data/ --log.level=info --log.format=logfmt (code=exited, status=1/FAILURE)
 Main PID: 58107 (code=exited, status=1/FAILURE)

1月 03 12:45:04 elk150 systemd[1]: Unit prometheus.service entered failed state.
1月 03 12:45:04 elk150 systemd[1]: prometheus.service failed.
root@elk150:/app/prometheus # systemctl status prometheus.service
● prometheus.service - Prometheus Monitoring
   Loaded: loaded (/etc/systemd/system/prometheus.service; disabled; vendor preset: disabled)
   Active: activating (auto-restart) (Result: exit-code) since 六 2026-01-03 12:45:21 CST; 3s ago
     Docs: https://prometheus.io/docs/introduction/overview/
  Process: 58833 ExecStart=/app/prometheus/prometheus --config.file=/app/prometheus/prometheus.yml --web.listen-address=0.0.0.0:9090 --web.max-connections=512 --storage.tsdb.path=/app/prometheus/data/ --log.level=info --log.format=logfmt (code=exited, status=1/FAILURE)
 Main PID: 58833 (code=exited, status=1/FAILURE)

1月 03 12:45:21 elk150 systemd[1]: Unit prometheus.service entered failed state.
1月 03 12:45:21 elk150 systemd[1]: prometheus.service failed.
root@elk150:/app/prometheus # journalctl -u   prometheus.service -f
root@elk150:/app/prometheus #
root@elk150:/app/prometheus # systemctl stop prometheus.service
root@elk150:/app/prometheus # systemctl stop alertmanager.service
root@elk150:/app/prometheus # systemctl start  prometheus.service
root@elk150:/app/prometheus # systemctl status  prometheus.service
● prometheus.service - Prometheus Monitoring
   Loaded: loaded (/etc/systemd/system/prometheus.service; disabled; vendor preset: disabled)
   Active: active (running) since 六 2026-01-03 13:03:11 CST; 14s ago
     Docs: https://prometheus.io/docs/introduction/overview/
 Main PID: 101842 (prometheus)
   CGroup: /system.slice/prometheus.service
           └─101842 /app/prometheus/prometheus --config.file=/app/prometheus/prometheus.yml --web.listen-address=0.0.0.0:9090 --web.max-conn...

root@elk150:/app/prometheus # systemctl start alertmanager.service
root@elk150:/app/prometheus # systemctl status  alertmanager.service
● alertmanager.service - Alertmanager
   Loaded: loaded (/etc/systemd/system/alertmanager.service; disabled; vendor preset: disabled)
   Active: active (running) since 六 2026-01-03 13:03:37 CST; 13s ago
 Main PID: 102912 (alertmanager)
   CGroup: /system.slice/alertmanager.service
           └─102912 /app/alertmanager/alertmanager --config.file=/app/alertmanager/alertmanager.yml --storage.path=/app/alertmanager/data --...


root@elk150:/app/prometheus # cat > /etc/systemd/system/grafana.service <<EOF
> [Unit]
> Description=Grafana
> After=network.target
>
> [Service]
> Type=simple
> User=root
> Group=root
> WorkingDirectory=/app/grafana
> ExecStart=/app/grafana/bin/grafana-server --config /app/grafana/conf/custom.ini
> Restart=on-failure
> RestartSec=10
>
> [Install]
> WantedBy=multi-user.target
> EOF
root@elk150:/app/prometheus # systemctl daemon-reload
root@elk150:/app/prometheus # systemctl start gra
grafana.service   graphical.target
root@elk150:/app/prometheus # systemctl start gra
grafana.service   graphical.target
root@elk150:/app/prometheus # systemctl start grafana.service
root@elk150:/app/prometheus # systemctl status  grafana.service
● grafana.service - Grafana
   Loaded: loaded (/etc/systemd/system/grafana.service; disabled; vendor preset: disabled)
   Active: activating (auto-restart) (Result: exit-code) since 六 2026-01-03 17:02:55 CST; 5s ago
  Process: 4839 ExecStart=/app/grafana/bin/grafana-server --config /app/grafana/conf/custom.ini (code=exited, status=1/FAILURE)
 Main PID: 4839 (code=exited, status=1/FAILURE)

1月 03 17:02:55 elk150 systemd[1]: Unit grafana.service entered failed state.
1月 03 17:02:55 elk150 systemd[1]: grafana.service failed.
root@elk150:/app/prometheus # cd ..
root@elk150:/app # cd grafana
root@elk150:/app/grafana # cd conf/
root@elk150:/app/grafana/conf # ll
总用量 340
-rw-r--r-- 1 root root 110610 12月 31 16:06 defaults-back.ini
-rw-rw-r-- 1 root root 110610 12月 16 22:26 defaults.ini
-rw-rw-r-- 1 root root   1045 12月 16 22:19 ldap_multiple.toml
-rw-rw-r-- 1 root root   3137 12月 16 22:19 ldap.toml
drwxrwxr-x 8 root root    110 12月 16 22:20 provisioning
-rw-rw-r-- 1 root root 108900 12月 16 22:26 sample.ini
root@elk150:/app/grafana/conf # cat > /etc/systemd/system/grafana.service <<EOF
[Unit]
Description=Grafana
After=network.target

[Service]
Type=simple
User=root
Group=root
WorkingDirectory=/app/grafana
ExecStart=/app/grafana/bin/grafana-server --config /app/grafana/conf/custom.ini
Restart=on-failure
RestartSec=10

[Install]
WantedBy=multi-user.target
EOF
root@elk150:/app/grafana/conf # vim /etc/systemd/system/grafana.service
root@elk150:/app/grafana/conf # systemctl daemon-reload
root@elk150:/app/grafana/conf # systemctl start grafana.service
root@elk150:/app/grafana/conf # systemctl status  grafana.service
● grafana.service - Grafana
   Loaded: loaded (/etc/systemd/system/grafana.service; disabled; vendor preset: disabled)
   Active: active (running) since 六 2026-01-03 17:05:21 CST; 10s ago
 Main PID: 10843 (grafana)
   CGroup: /system.slice/grafana.service
           └─10843 grafana server --config /app/grafana/conf/defaults.ini
alertmanager-0.25.0.linux-amd64.tar.gz
启动、systemctl 配置
bash
root@elk150:/server/tools # tar xf alertmanager-0.25.0.linux-amd64.tar.gz  -C /app/
root@elk150:/server/tools # cd /app
root@elk150:/app # ln -s /app/alertmanager-0.25.0.linux-amd64/ /app/alertmanager
root@elk150:/app # ll
总用量 0
lrwxrwxrwx  1 root       root        37 1月   3 11:38 alertmanager -> /app/alertmanager-0.25.0.linux-amd64/
drwxr-xr-x  2       3434       3434  93 12月 22 2022 alertmanager-0.25.0.linux-amd64
lrwxrwxrwx  1 root       root        20 12月 31 16:01 grafana -> /app/grafana-12.3.1/
drwxr-xr-x 10 root       root       202 12月 31 16:09 grafana-12.3.1
lrwxrwxrwx  1 prometheus prometheus  35 12月 30 21:49 prometheus -> /app/prometheus-2.33.3.linux-amd64/
drwxr-x---  7 prometheus prometheus 230 12月 31 14:36 prometheus-2.33.3.linux-amd64
root@elk150:/app # cd alertmanager
root@elk150:/app/alertmanager # ll
总用量 61016
-rwxr-xr-x 1 3434 3434 34546840 12月 22 2022 alertmanager
-rw-r--r-- 1 3434 3434      356 12月 22 2022 alertmanager.yml
-rwxr-xr-x 1 3434 3434 27906085 12月 22 2022 amtool
-rw-r--r-- 1 3434 3434    11357 12月 22 2022 LICENSE
-rw-r--r-- 1 3434 3434      457 12月 22 2022 NOTICE

root@elk150:/app/alertmanager # mkdir -p /app/alertmanager/data
root@elk150:/app/alertmanager # ll
总用量 61016
-rwxr-xr-x 1 3434 3434 34546840 12月 22 2022 alertmanager
-rw-r--r-- 1 3434 3434      356 12月 22 2022 alertmanager.yml
-rwxr-xr-x 1 3434 3434 27906085 12月 22 2022 amtool
drwxr-xr-x 2 root root        6 1月   3 11:41 data
-rw-r--r-- 1 3434 3434    11357 12月 22 2022 LICENSE
-rw-r--r-- 1 3434 3434      457 12月 22 2022 NOTICE
root@elk150:/app/alertmanager # cat > /etc/systemd/system/alertmanager.service <<EOF
> [Unit]
> Description=Alertmanager
> After=network.target
>
> [Service]
> Type=simple
> User=root
> Group=root
> WorkingDirectory=/app/alertmanager
> ExecStart=/app/alertmanager/alertmanager \
>   --config.file=/app/alertmanager/alertmanager.yml \
>   --storage.path=/app/alertmanager/data \
>   --web.listen-address=:9093
> Restart=on-failure
> RestartSec=10
>
> [Install]
> WantedBy=multi-user.target
> EOF
root@elk150:/app/alertmanager # ll /etc/systemd/system/prometheus.service
alertmanager      alertmanager.yml  amtool            data/             LICENSE           NOTICE
root@elk150:/app/alertmanager # ll /etc/systemd/system/
alertmanager.service                         getty.target.wants/                          prometheus.service
basic.target.wants/                          kibana.service                               sockets.target.wants/
dbus-org.freedesktop.NetworkManager.service  local-fs.target.wants/                       sysinit.target.wants/
dbus-org.freedesktop.nm-dispatcher.service   multi-user.target.wants/                     system-update.target.wants/
default.target                               network-online.target.wants/                 vmtoolsd.service.requires/
default.target.wants/                        node_exporter.service
root@elk150:/app/alertmanager # systemctl daemon-reload
root@elk150:/app/alertmanager # systemctl start alertmanager.service
root@elk150:/app/alertmanager # journalctl -u alertmanager.service -f
-- Logs begin at 二 2025-12-23 15:26:08 CST. --

root@elk150:/app/alertmanager # systemctl sta
start   status
root@elk150:/app/alertmanager # systemctl status -l alertmanager.service
● alertmanager.service - Alertmanager
   Loaded: loaded (/etc/systemd/system/alertmanager.service; disabled; vendor preset: disabled)
   Active: active (running) since 六 2026-01-03 11:46:45 CST; 4min 20s ago
 Main PID: 53224 (alertmanager)
   CGroup: /system.slice/alertmanager.service
           └─53224 /app/alertmanager/alertmanager --config.file=/app/alertmanager/alertmanager.yml --storage.path=/app/alertmanager/data --web.listen-address=:9093
prometheus配置
yml
# my global config
global:
  scrape_interval: 15s # Set the scrape interval to every 15 seconds. Default is every 1 minute.将刮擦间隔设置为每15秒一次。默认是每1分钟一次。
  evaluation_interval: 15s # Evaluate rules every 15 seconds. The default is every 1 minute. 评估规则每隔15秒一次。默认是每1分钟一次。
  # scrape_timeout is set to the global default (10s). scrape_timeout设置为全局默认值(10秒)。

# Alertmanager configuration  告管理器配置
alerting:
  alertmanagers:
    - static_configs:
        - targets:
          # - alertmanager:9093

# Load rules once and periodically evaluate them according to the global 'evaluation_interval'.
# 根据全局"evaluation_interval"加载规则一次并定期评估它们。
rule_files:
  # - "first_rules.yml"
  # - "second_rules.yml"

# A scrape configuration containing exactly one endpoint to scrape:  这是一个包含一个端点的刮擦配置:
# Here it's Prometheus itself. 这里是Prometheus本身。
scrape_configs:
  # The job name is added as a label `job=<job_name>` to any timeseries scraped from this config.
  # 作业名称添加为标签`job=<job_name>`到从此配置中抓取的任何时间序列。
  - job_name: "prometheus"

    # metrics_path defaults to '/metrics'  metrics_path默认为'/metrics'
    # scheme defaults to 'http'. scheme默认为'http'。

    static_configs:
      - targets: ["localhost:9090"]
  - job_name: 'node'
    static_configs:
      - targets: ['localhost:9100']  # node_exporter

  - job_name: 'mysql'
    static_configs:
      - targets: ['localhost:9104']  # mysqld_exporter
exporter
https://prometheus.io/docs/instrumenting/exporters/
node_exporter-1.3.1.linux-amd64
bash
root@elk150:/app/prometheus # ss -ntl
State Recv-Q Send-Q Local Address:Port Peer Address:Port
LISTEN 0 128 *:22 *:*
LISTEN 0 100 127.0.0.1:25 *:*
LISTEN 0 128 :::22 :::*
LISTEN 0 100 ::1:25 :::*
LISTEN 0 128 :::9090 :::*
root@elk150:/app/prometheus # cp prometheus.yml prometheus-back.yml
root@elk150:/app/prometheus # cat prometheus.yml
global:
scrape_interval: 15s
evaluation_interval: 15s
alerting:
alertmanagers:
- static_configs:
- targets:
rule_files:
scrape_configs:
- job_name: "prometheus-150"
static_configs:
- targets: ["localhost:9090"]
root@elk150:/app/prometheus # cd /server/tools/
root@elk150:/server/tools # ll
总用量 74044
-r-------- 1 root root 75819309 12月 30 21:43 prometheus-2.33.3.linux-amd64.tar.gz
root@elk150:/server/tools # rz
root@elk150:/server/tools # ll
总用量 92280
-r-------- 1 root root 9634286 12月 31 10:57 mysqld_exporter-0.18.0.linux-amd64.tar.gz
-r-------- 1 root root 9033415 12月 31 10:57 node_exporter-1.3.1.linux-amd64.tar.gz
-r-------- 1 root root 75819309 12月 30 21:43 prometheus-2.33.3.linux-amd64.tar.gz
root@elk150:/server/tools # tar -xf mysqld_exporter-0.18.0.linux-amd64.tar.gz /app/prometheus/mysql-exporter
tar: /app/prometheus/mysql-exporter:归档中找不到
tar: 由于前次错误,将以上次的错误状态退出
root@elk150:/server/tools # tar -xf mysqld_exporter-0.18.0.linux-amd64.tar.gz -C /app/prometheus/mysql-exporter
tar: /app/prometheus/mysql-exporter:无法 open: 没有那个文件或目录
tar: Error is not recoverable: exiting now
root@elk150:/server/tools # mkdir - p /app/prometheus/mysql-exporter
root@elk150:/server/tools # tar -xf mysqld_exporter-0.18.0.linux-amd64.tar.gz -C /app/prometheus/mysql-exporter
root@elk150:/server/tools # ll /app/prometheus/
总用量 196076
drwxr-x--- 2 prometheus prometheus 38 2月 12 2022 console_libraries
drwxr-x--- 2 prometheus prometheus 173 2月 12 2022 consoles
drwxr-x--- 9 prometheus prometheus 240 12月 31 11:00 data
-rwxr-x--- 1 prometheus prometheus 11357 2月 12 2022 LICENSE
drwxr-xr-x 3 root root 48 12月 31 10:59 mysql-exporter
drwxr-xr-x 2 root root 6 12月 31 11:00 node-exporter
-rwxr-x--- 1 prometheus prometheus 3773 2月 12 2022 NOTICE
-rwxr-x--- 1 prometheus prometheus 104427627 2月 12 2022 prometheus
-rwxr-x--- 1 root root 938 12月 31 10:18 prometheus-back.yml
-rwxr-x--- 1 prometheus prometheus 243 12月 31 10:23 prometheus.yml
-rwxr-x--- 1 prometheus prometheus 96322328 2月 12 2022 promtool
root@elk150:/server/tools # tar -xf node_exporter-1.3.1.linux-amd64.tar.gz -C /app/prometheus/node-exporter
root@elk150:/server/tools # cd /app/prometheus
root@elk150:/app/prometheus # ll
总用量 196076
drwxr-x--- 2 prometheus prometheus 38 2月 12 2022 console_libraries
drwxr-x--- 2 prometheus prometheus 173 2月 12 2022 consoles
drwxr-x--- 9 prometheus prometheus 240 12月 31 11:00 data
-rwxr-x--- 1 prometheus prometheus 11357 2月 12 2022 LICENSE
drwxr-xr-x 3 root root 48 12月 31 10:59 mysql-exporter
drwxr-xr-x 3 root root 45 12月 31 11:01 node-exporter
-rwxr-x--- 1 prometheus prometheus 3773 2月 12 2022 NOTICE
-rwxr-x--- 1 prometheus prometheus 104427627 2月 12 2022 prometheus
-rwxr-x--- 1 root root 938 12月 31 10:18 prometheus-back.yml
-rwxr-x--- 1 prometheus prometheus 243 12月 31 10:23 prometheus.yml
-rwxr-x--- 1 prometheus prometheus 96322328 2月 12 2022 promtool
root@elk150:/app/prometheus # cd node-exporter/
root@elk150:/app/prometheus/node-exporter # ll
总用量 0
drwxr-xr-x 2 3434 3434 56 12月 5 2021 node_exporter-1.3.1.linux-amd64
root@elk150:/app/prometheus/node-exporter # ll
总用量 0
drwxr-xr-x 2 3434 3434 56 12月 5 2021 node_exporter-1.3.1.linux-amd64
root@elk150:/app/prometheus/node-exporter # cd node_exporter-1.3.1.linux-amd64/
root@elk150:/app/prometheus/node-exporter/node_exporter-1.3.1.linux-amd64 # ll
总用量 17820
-rw-r--r-- 1 3434 3434 11357 12月 5 2021 LICENSE
-rwxr-xr-x 1 3434 3434 18228926 12月 5 2021 node_exporter
-rw-r--r-- 1 3434 3434 463 12月 5 2021 NOTICE
root@elk150:/app/prometheus/node-exporter/node_exporter-1.3.1.linux-amd64 # ln -s /app/prometheus/node-exporter/node_exporter-1.3.1.linux-amd64/node_exporter /bin/
root@elk150:/app/prometheus/node-exporter/node_exporter-1.3.1.linux-amd64 # ll /bin/node_exporter
lrwxrwxrwx 1 root root 75 12月 31 11:02 /bin/node_exporter -> /app/prometheus/node-exporter/node_exporter-1.3.1.linux-amd64/node_exporter
root@elk150:/app/prometheus/mysql-exporter/mysqld_exporter-0.18.0.linux-amd64 # ln -s /app/prometheus/mysql-exporter/mysqld_exporter-0.18.0.linux-amd64/mysqld_exporter /bin/
root@elk150:/app/prometheus/mysql-exporter/mysqld_exporter-0.18.0.linux-amd64 # node_exporter -h
usage: node_exporter [<flags>]
Flags:
-h, --help Show context-sensitive help (also try --help-long and --help-man).
--collector.bcache.priorityStats
Expose expensive priority stats.
--collector.cpu.guest Enables metric node_cpu_guest_seconds_total
--collector.cpu.info Enables metric cpu_info
--collector.cpu.info.flags-include=COLLECTOR.CPU.INFO.FLAGS-INCLUDE
Filter the `flags` field in cpuInfo with a value that must be a regular expression
--collector.cpu.info.bugs-include=COLLECTOR.CPU.INFO.BUGS-INCLUDE
Filter the `bugs` field in cpuInfo with a value that must be a regular expression
--collector.diskstats.ignored-devices="^(ram|loop|fd|(h|s|v|xv)d[a-z]|nvme\\d+n\\d+p)\\d+$"
Regexp of devices to ignore for diskstats.
--collector.ethtool.device-include=COLLECTOR.ETHTOOL.DEVICE-INCLUDE
Regexp of ethtool devices to include (mutually exclusive to device-exclude).
--collector.ethtool.device-exclude=COLLECTOR.ETHTOOL.DEVICE-EXCLUDE
Regexp of ethtool devices to exclude (mutually exclusive to device-include).
--collector.ethtool.metrics-include=".*"
Regexp of ethtool stats to include.
--collector.filesystem.mount-points-exclude="^/(dev|proc|run/credentials/.+|sys|var/lib/docker/.+)($|/)"
Regexp of mount points to exclude for filesystem collector.
--collector.filesystem.fs-types-exclude="^(autofs|binfmt_misc|bpf|cgroup2?|configfs|debugfs|devpts|devtmpfs|fusectl|hugetlbfs|iso9660|mqueue|nsfs|overlay|proc|procfs|pstore|rpc_pipefs|securityfs|selinuxfs|squashfs|sysfs|tracefs)$"
Regexp of filesystem types to exclude for filesystem collector.
--collector.ipvs.backend-labels="local_address,local_port,remote_address,remote_port,proto,local_mark"
Comma separated list for IPVS backend stats labels.
--collector.netclass.ignored-devices="^$"
Regexp of net devices to ignore for netclass collector.
--collector.netclass.ignore-invalid-speed
Ignore devices where the speed is invalid. This will be the default behavior in 2.x.
--collector.netdev.device-include=COLLECTOR.NETDEV.DEVICE-INCLUDE
Regexp of net devices to include (mutually exclusive to device-exclude).
--collector.netdev.device-exclude=COLLECTOR.NETDEV.DEVICE-EXCLUDE
Regexp of net devices to exclude (mutually exclusive to device-include).
--collector.netdev.address-info
Collect address-info for every device
--collector.netstat.fields="^(.*_(InErrors|InErrs)|Ip_Forwarding|Ip(6|Ext)_(InOctets|OutOctets)|Icmp6?_(InMsgs|OutMsgs)|TcpExt_(Listen.*|Syncookies.*|TCPSynRetrans|TCPTimeouts)|Tcp_(ActiveOpens|InSegs|OutSegs|OutRsts|PassiveOpens|RetransSegs|CurrEstab)|Udp6?_(InDatagrams|OutDatagrams|NoPorts|RcvbufErrors|SndbufErrors))$"
Regexp of fields to return for netstat collector.
--collector.ntp.server="127.0.0.1"
NTP server to use for ntp collector
--collector.ntp.protocol-version=4
NTP protocol version
--collector.ntp.server-is-local
Certify that collector.ntp.server address is not a public ntp server
--collector.ntp.ip-ttl=1 IP TTL to use while sending NTP query
--collector.ntp.max-distance=3.46608s
Max accumulated distance to the root
--collector.ntp.local-offset-tolerance=1ms
Offset between local clock and local ntpd time to tolerate
--path.procfs="/proc" procfs mountpoint.
--path.sysfs="/sys" sysfs mountpoint.
--path.rootfs="/" rootfs mountpoint.
--collector.perf.cpus="" List of CPUs from which perf metrics should be collected
--collector.perf.tracepoint=COLLECTOR.PERF.TRACEPOINT ...
perf tracepoint that should be collected
--collector.powersupply.ignored-supplies="^$"
Regexp of power supplies to ignore for powersupplyclass collector.
--collector.qdisc.fixtures=""
test fixtures to use for qdisc collector end-to-end testing
--collector.runit.servicedir="/etc/service"
Path to runit service directory.
--collector.supervisord.url="http://localhost:9001/RPC2"
XML RPC endpoint.
--collector.systemd.unit-include=".+"
Regexp of systemd units to include. Units must both match include and not match exclude to be included.
--collector.systemd.unit-exclude=".+\\.(automount|device|mount|scope|slice)"
Regexp of systemd units to exclude. Units must both match include and not match exclude to be included.
--collector.systemd.enable-task-metrics
Enables service unit tasks metrics unit_tasks_current and unit_tasks_max
--collector.systemd.enable-restarts-metrics
Enables service unit metric service_restart_total
--collector.systemd.enable-start-time-metrics
Enables service unit metric unit_start_time_seconds
--collector.tapestats.ignored-devices="^$"
Regexp of devices to ignore for tapestats.
--collector.textfile.directory=""
Directory to read text files with metrics from.
--collector.vmstat.fields="^(oom_kill|pgpg|pswp|pg.*fault).*"
Regexp of fields to return for vmstat collector.
--collector.wifi.fixtures=""
test fixtures to use for wifi collector metrics
--collector.arp Enable the arp collector (default: enabled).
--collector.bcache Enable the bcache collector (default: enabled).
--collector.bonding Enable the bonding collector (default: enabled).
--collector.btrfs Enable the btrfs collector (default: enabled).
--collector.buddyinfo Enable the buddyinfo collector (default: disabled).
--collector.conntrack Enable the conntrack collector (default: enabled).
--collector.cpu Enable the cpu collector (default: enabled).
--collector.cpufreq Enable the cpufreq collector (default: enabled).
--collector.diskstats Enable the diskstats collector (default: enabled).
--collector.dmi Enable the dmi collector (default: enabled).
--collector.drbd Enable the drbd collector (default: disabled).
--collector.drm Enable the drm collector (default: disabled).
--collector.edac Enable the edac collector (default: enabled).
--collector.entropy Enable the entropy collector (default: enabled).
--collector.ethtool Enable the ethtool collector (default: disabled).
--collector.fibrechannel Enable the fibrechannel collector (default: enabled).
--collector.filefd Enable the filefd collector (default: enabled).
--collector.filesystem Enable the filesystem collector (default: enabled).
--collector.hwmon Enable the hwmon collector (default: enabled).
--collector.infiniband Enable the infiniband collector (default: enabled).
--collector.interrupts Enable the interrupts collector (default: disabled).
--collector.ipvs Enable the ipvs collector (default: enabled).
--collector.ksmd Enable the ksmd collector (default: disabled).
--collector.lnstat Enable the lnstat collector (default: disabled).
--collector.loadavg Enable the loadavg collector (default: enabled).
--collector.logind Enable the logind collector (default: disabled).
--collector.mdadm Enable the mdadm collector (default: enabled).
--collector.meminfo Enable the meminfo collector (default: enabled).
--collector.meminfo_numa Enable the meminfo_numa collector (default: disabled).
--collector.mountstats Enable the mountstats collector (default: disabled).
--collector.netclass Enable the netclass collector (default: enabled).
--collector.netdev Enable the netdev collector (default: enabled).
--collector.netstat Enable the netstat collector (default: enabled).
--collector.network_route Enable the network_route collector (default: disabled).
--collector.nfs Enable the nfs collector (default: enabled).
--collector.nfsd Enable the nfsd collector (default: enabled).
--collector.ntp Enable the ntp collector (default: disabled).
--collector.nvme Enable the nvme collector (default: enabled).
--collector.os Enable the os collector (default: enabled).
--collector.perf Enable the perf collector (default: disabled).
--collector.powersupplyclass
Enable the powersupplyclass collector (default: enabled).
--collector.pressure Enable the pressure collector (default: enabled).
--collector.processes Enable the processes collector (default: disabled).
--collector.qdisc Enable the qdisc collector (default: disabled).
--collector.rapl Enable the rapl collector (default: enabled).
--collector.runit Enable the runit collector (default: disabled).
--collector.schedstat Enable the schedstat collector (default: enabled).
--collector.sockstat Enable the sockstat collector (default: enabled).
--collector.softnet Enable the softnet collector (default: enabled).
--collector.stat Enable the stat collector (default: enabled).
--collector.supervisord Enable the supervisord collector (default: disabled).
--collector.systemd Enable the systemd collector (default: disabled).
--collector.tapestats Enable the tapestats collector (default: enabled).
--collector.tcpstat Enable the tcpstat collector (default: disabled).
--collector.textfile Enable the textfile collector (default: enabled).
--collector.thermal_zone Enable the thermal_zone collector (default: enabled).
--collector.time Enable the time collector (default: enabled).
--collector.timex Enable the timex collector (default: enabled).
--collector.udp_queues Enable the udp_queues collector (default: enabled).
--collector.uname Enable the uname collector (default: enabled).
--collector.vmstat Enable the vmstat collector (default: enabled).
--collector.wifi Enable the wifi collector (default: disabled).
--collector.xfs Enable the xfs collector (default: enabled).
--collector.zfs Enable the zfs collector (default: enabled).
--collector.zoneinfo Enable the zoneinfo collector (default: disabled).
--web.listen-address=":9100"
Address on which to expose metrics and web interface.
--web.telemetry-path="/metrics"
Path under which to expose metrics.
--web.disable-exporter-metrics
Exclude metrics about the exporter itself (promhttp_*, process_*, go_*).
--web.max-requests=40 Maximum number of parallel scrape requests. Use 0 to disable.
--collector.disable-defaults
Set all collectors to disabled by default.
--web.config="" [EXPERIMENTAL] Path to config yaml file that can enable TLS or authentication.
--log.level=info Only log messages with the given severity or above. One of: [debug, info, warn, error]
--log.format=logfmt Output format of log messages. One of: [logfmt, json]
--version Show application version.
root@elk150:/app/prometheus/mysql-exporter/mysqld_exporter-0.18.0.linux-amd64 # cd ..
root@elk150:/app/prometheus/mysql-exporter # cd ..
root@elk150:/app/prometheus # sudo tee /etc/systemd/system/node_exporter.service <<EOF
> [Unit]
> Description=Node Exporter
> Wants=network-online.target
> After=network-online.target
>
> [Service]
> #User=prometheus
> ExecStart=/bin/node_exporter
> Restart=on-failure
>
> [Install]
> WantedBy=default.target
> EOF
[Unit]
Description=Node Exporter
Wants=network-online.target
After=network-online.target
[Service]
#User=prometheus
ExecStart=/bin/node_exporter
Restart=on-failure
[Install]
WantedBy=default.target
root@elk150:/app/prometheus # systemctl daemon-reload
root@elk150:/app/prometheus # systemctl start node_exporter.service
root@elk150:/app/prometheus # ss -ntl
State Recv-Q Send-Q Local Address:Port Peer Address:Port
LISTEN 0 128 *:22 *:*
LISTEN 0 100 127.0.0.1:25 *:*
LISTEN 0 128 :::9100 :::*
LISTEN 0 128 :::22 :::*
LISTEN 0 100 ::1:25 :::*
LISTEN 0 128 :::9090 :::*
root@elk150:/app/prometheus # rm -rf /app/prometheus/
console_libraries/ data/ mysql-exporter/ NOTICE prometheus-back.yml promtool
consoles/ LICENSE node-exporter/ prometheus prometheus.yml
root@elk150:/app/prometheus # rm -rf /app/prometheus/mysql-exporter/*
root@elk150:/app/prometheus # ll
总用量 196076
drwxr-x--- 2 prometheus prometheus 38 2月 12 2022 console_libraries
drwxr-x--- 2 prometheus prometheus 173 2月 12 2022 consoles
drwxr-x--- 9 prometheus prometheus 240 12月 31 11:00 data
-rwxr-x--- 1 prometheus prometheus 11357 2月 12 2022 LICENSE
drwxr-xr-x 2 root root 6 12月 31 11:31 mysql-exporter
drwxr-xr-x 3 root root 45 12月 31 11:01 node-exporter
-rwxr-x--- 1 prometheus prometheus 3773 2月 12 2022 NOTICE
-rwxr-x--- 1 prometheus prometheus 104427627 2月 12 2022 prometheus
-rwxr-x--- 1 root root 938 12月 31 10:18 prometheus-back.yml
-rwxr-x--- 1 prometheus prometheus 452 12月 31 11:29 prometheus.yml
-rwxr-x--- 1 prometheus prometheus 96322328 2月 12 2022 promtool
root@elk150:/app/prometheus # cd mysql-exporter/
root@elk150:/app/prometheus/mysql-exporter # ll
总用量 0
root@elk150:/app/prometheus/mysql-exporter # cd ..
root@elk150:/app/prometheus # rm -rf ./mysql-exporter
root@elk150:/app/prometheus # rm -f /bin/mysqld_exporter
root@elk150:/app/prometheus # cd /server/tools
root@elk150:/server/tools # ll
总用量 92280
drwxr-xr-x 2 root root 6 12月 31 10:59 -
-r-------- 1 root root 9634286 12月 31 10:57 mysqld_exporter-0.18.0.linux-amd64.tar.gz
-r-------- 1 root root 9033415 12月 31 10:57 node_exporter-1.3.1.linux-amd64.tar.gz
drwxr-xr-x 2 root root 6 12月 31 10:59 p
-r-------- 1 root root 75819309 12月 30 21:43 prometheus-2.33.3.linux-amd64.tar.gz
root@elk150:/server/tools # rm -f p
rm: 无法删除"p": 是一个目录
root@elk150:/server/tools # cd p
root@elk150:/server/tools/p # ll
总用量 0
root@elk150:/server/tools/p # cd ..
root@elk150:/server/tools # re -rf ./p
-bash: re: 未找到命令
root@elk150:/server/tools # rm -rf ./p
root@elk150:/server/tools # rm -rf ./mysqld_exporter-0.18.0.linux-amd64.tar.gz
root@elk150:/server/tools # ll
总用量 82868
drwxr-xr-x 2 root root 6 12月 31 10:59 -
-r-------- 1 root root 9033415 12月 31 10:57 node_exporter-1.3.1.linux-amd64.tar.gz
-r-------- 1 root root 75819309 12月 30 21:43 prometheus-2.33.3.linux-amd64.tar.gz
root@elk150:/server/tools # cd /app/prometheus
root@elk150:/app/prometheus # systemctl restart prometheus.service
root@elk150:/app/prometheus # ss -ntl
State Recv-Q Send-Q Local Address:Port Peer Address:Port
LISTEN 0 128 *:22 *:*
LISTEN 0 100 127.0.0.1:25 *:*
LISTEN 0 128 :::9100 :::*
LISTEN 0 128 :::22 :::*
LISTEN 0 100 ::1:25 :::*
LISTEN 0 128 :::9090 :::*
root@elk150:/app/prometheus # systemctl restart prometheus.service
root@elk150:/app/prometheus # systemctl restart prometheus.service mysqld_exporter-0.18.0.linux-amd64
- show grants for 'root'@'localhost'; 检查用户权限
bash
root@elk153:~ # cat  /etc/systemd/system/mysqld_exporter.service
[Unit]
Description=MySQL Exporter
Wants=network-online.target
After=network-online.target

[Service]
# User=prometheus
Environment=DATA_SOURCE_NAME="mysqld_exporter:strong_password@(localhost:3306)/"
ExecStart=/bin/mysqld_exporter     --config.my-cnf=/etc/prometheus/.my.cnf     --collect.global_status     --collect.info_schema.innodb_metrics     --collect.auto_increment.columns     --collect.info_schema.processlist
Restart=on-failure

[Install]
WantedBy=default.target
root@elk153:~ # ^C
root@elk153:~ # cat /etc/prometheus/.my.cnf
[client]
user=root
password=xxxx
host=localhost
domain_exporter_1.24.1_linux_amd64.tar.gz
bash
root@elk153:/app/domain_exporter # ./domain_exporter --config=domains.yaml
2:45PM INF starting domain_exporter 1.24.1
2:45PM INF trying to load config from file domains.yaml
2:45PM INF listening on :9222
2:45PM INF run refresher
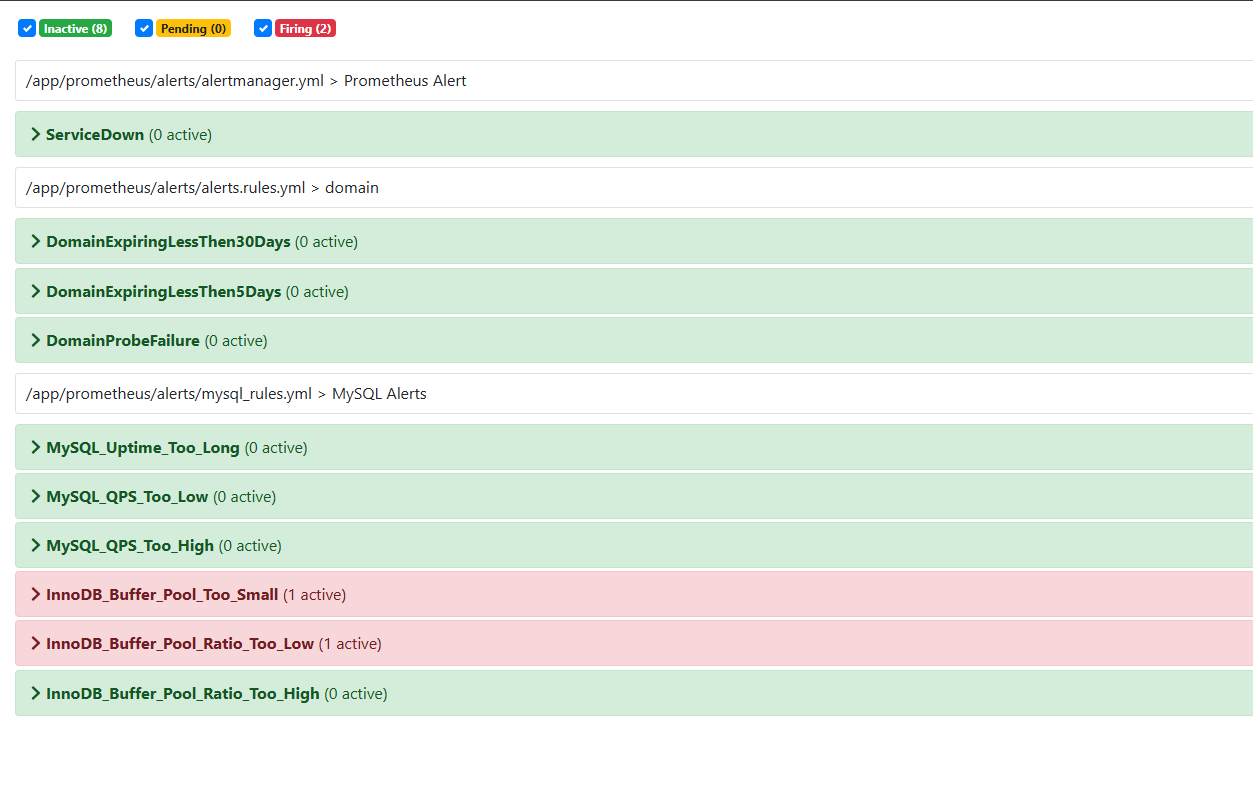
root@elk150:/app/prometheus/alerts # vim alerts.rules.yml
root@elk150:/app/prometheus/alerts # ll
总用量 12
-rw-r--r-- 1 root root 315 1月 5 21:49 alertmanager.yml
-rw-r--r-- 1 root root 931 1月 7 15:14 alerts.rules.yml
-rw-r--r-- 1 root root 3149 1月 5 21:44 mysql_rules.yml
root@elk150:/app/prometheus/alerts # cd ..
root@elk150:/app/prometheus # curl http://localhost:9090/-/reload -X POST- prometeus 服务发现
yml
  - job_name: 'domain_exporter'
    file_sd_configs:
      - files:
          - '/app/prometheus/targets/domain_targets.json'
        refresh_interval: 30s
    relabel_configs:
      - source_labels: [__address__]
        regex: "(.*):.*"
        target_label: instance
replacement: "${1}" # 只保留 IP,去掉端口- /app/prometheus/targets/domain_targets.json
josn
[
  {
    "targets": ["10.0.0.153:9222" ],
    "labels": {
      "env": "prod",
      "team": "domain"
    }
  }
]- prometeus 告警模板
yml
groups:
- name: domain
  rules:
  - alert: DomainExpiringLessThen30Days
    expr: domain_expiry_days != -1 AND domain_expiry_days < 30 AND domain_expiry_days > 5
    for: 1h
    labels:
      severity: warning
    annotations:
      description: 'Domain {{ $labels.domain }} will expire in less than 30 days'
      summary: '{{ $labels.domain }}: domain is expiring'

  - alert: DomainExpiringLessThen5Days
    expr: domain_expiry_days != -1 AND domain_expiry_days <= 5
    for: 1h
    labels:
      severity: page
    annotations:
      description: 'Domain {{ $labels.domain }} will expire in less than 5 days'
      summary: '{{ $labels.domain }}: domain is expiring'

  - alert: DomainProbeFailure
    expr: domain_probe_success == 0
    for: 1h
    labels:
      severity: warning
    annotations:
      description: 'Domain {{ $labels.domain }} is not valid. Cannot probe'
summary: '{{ $labels.domain }}: cannot probe'- domain_exporter --config=domains.yaml
yaml
domains:
- google.com
- name: reddit.com
pushgateway-1.10.2.linux-amd64.tar.gz
yml
  - job_name: 'pushgateway'
    honor_labels: true  # 避免覆盖推送的标签
    #static_configs:
     # - targets: ['10.0.0.193:9091']
    file_sd_configs:
      - files:
          - '/app/prometheus/targets/pushgateway_targets.json'
        refresh_interval: 30s
bash
root@elk153:/app/pushgateway # ./pushgateway --persistence.file=/app/pushgateway/pushgateway.data
ts=2026-01-07T09:17:14.524Z level=info caller=main.go:82 msg="starting pushgateway" version="(version=1.11.2, branch=HEAD, revision=ace6bf252df95246501059f17ace076f1081144e)"


root@elk153:~ # cat <<EOF | curl --data-binary @- http://10.0.0.153:9091/metrics/job/test_job/instance/test_instance
> # HELP test_push_metric A test metric pushed to Pushgateway
> # TYPE test_push_metric gauge
> test_push_metric{region="cn"} 123.45
> EOF
root@elk153:~ # curl http://10.0.0.150:9090/api/v1/query?query=test_push_metric
# {"status":"success","data":{"resultType":"vector","result":[{"metric":{"__name__":"test_push_metric","env":"prod","instance":"test_instance","job":"test_job","region":"cn","team":"pushgateway"},"value":[1767777989.386,"123.45"]}]}}root@elk153:~ # cat <<'EOF' | curl -H "TTL: 3600" --data-binary @- http://10.0.0.153:9091/metrics/job/backup/instance/db1
# > backup_duration_seconds 123.45
# > EOF
root@elk153:~ # ^C
root@elk153:~ # curl "http://10.0.0.153:9091/metrics?match[]=\{job=\"test_job\"\}"
curl: (3) [globbing] illegal character in range specification at pos 38
root@elk153:~ # ^C
root@elk153:~ # curl -g 'http://10.0.0.153:9091/metrics?match[]={job="test_job"}'
# TYPE backup_duration_seconds untyped
backup_duration_seconds{instance="db1",job="backup"} 123.45
# HELP go_gc_duration_seconds A summary of the wall-time pause (stop-the-world) duration in garbage collection cycles.
# TYPE go_gc_duration_seconds summary
go_gc_duration_seconds{quantile="0"} 2.2391e-05
go_
test_push_metric{instance="test_instance",job="test_job",region="cn"} 123.45
root@elk153:~ # curl -X DELETE http://10.0.0.153:9091/metrics/job/test_job/instance/test_instance
root@elk153:~ # curl -g 'http://10.0.0.153:9091/metrics?match[]={job="test_job"}'
# TYPE bac
root@elk153:~ # curl -X DELETE http://10.0.0.153:9091/metrics/job/backup/instance/db1
root@elk153:~ # curl -g 'http://10.0.0.153:9091/metrics?match[]={job="test_job"}'
# HELP go_gc_duration_seconds A summary of the wall-time pause (stop-the-world) duration in garbage collection cycles.
# TYPE go_gc_duration_seconds summary