前置 Prometheus2.33.3grafana12.3.1监控安装
prometheus http://10.0.0.150:9090/targets#pool-node-exporter
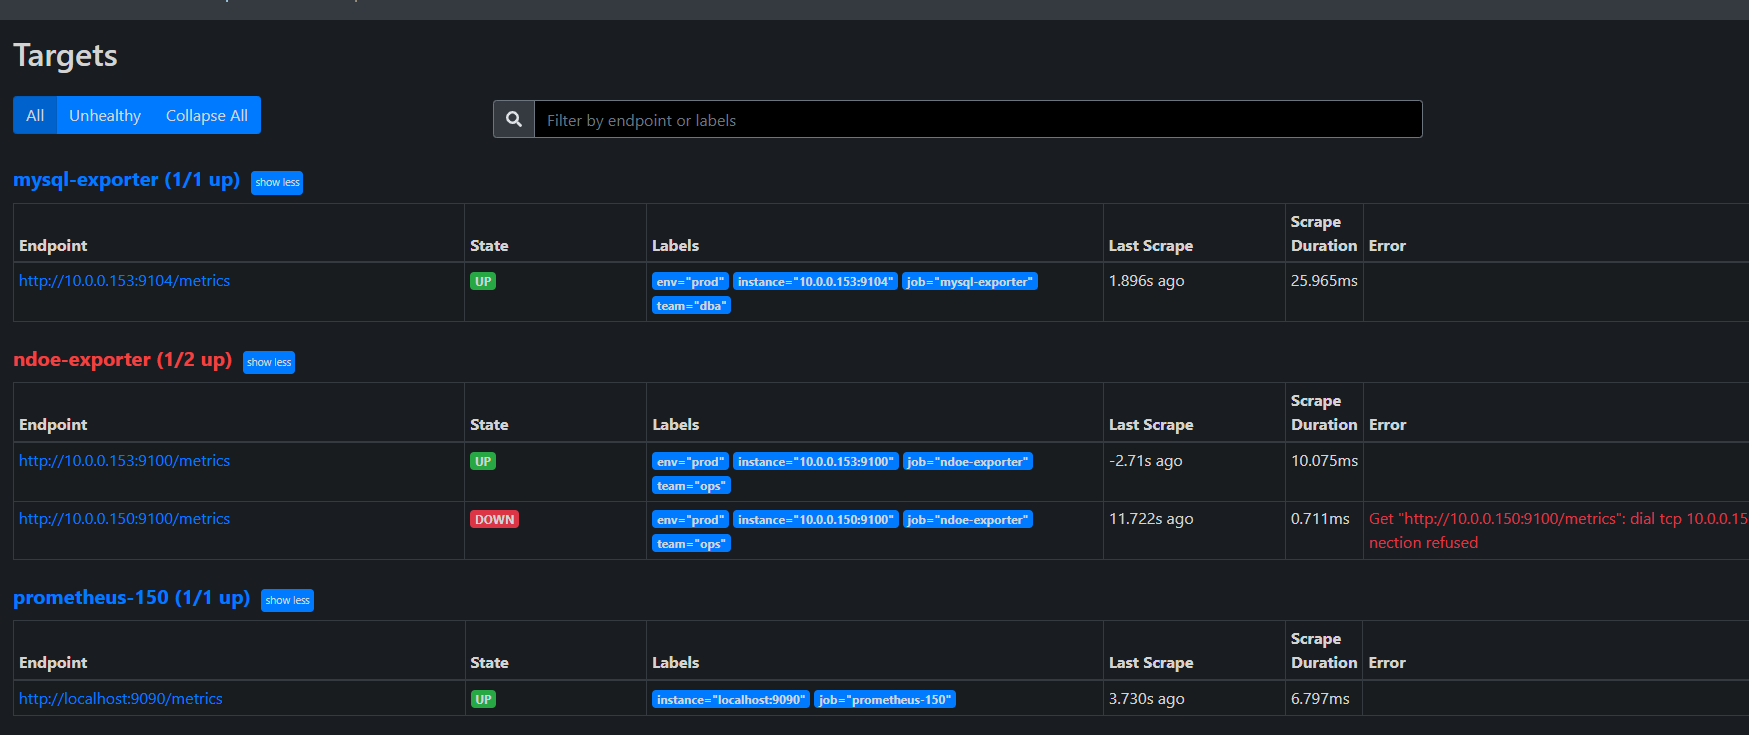
- Prometheus 默认将 address(即 IP:Port)作为 instance 标签。无法通过 on(instance) 关联!
- mysql-exporter 和 node-exporter 的 instance 标签不一致(端口不同),且你的 PromQL 使用了 on(instance),导致无法关联
bash
global:
scrape_interval: 15s
evaluation_interval: 15s
alerting:
alertmanagers:
- static_configs:
- targets: ['localhost:9093']
rule_files:
- '/app/prometheus/alertmanager.yml'
scrape_configs:
- job_name: "prometheus-150"
static_configs:
- targets: ["localhost:9090"]
- job_name: 'mysql-exporter'
file_sd_configs:
- files:
- '/app/prometheus/targets/mysql_targets.json'
refresh_interval: 30s
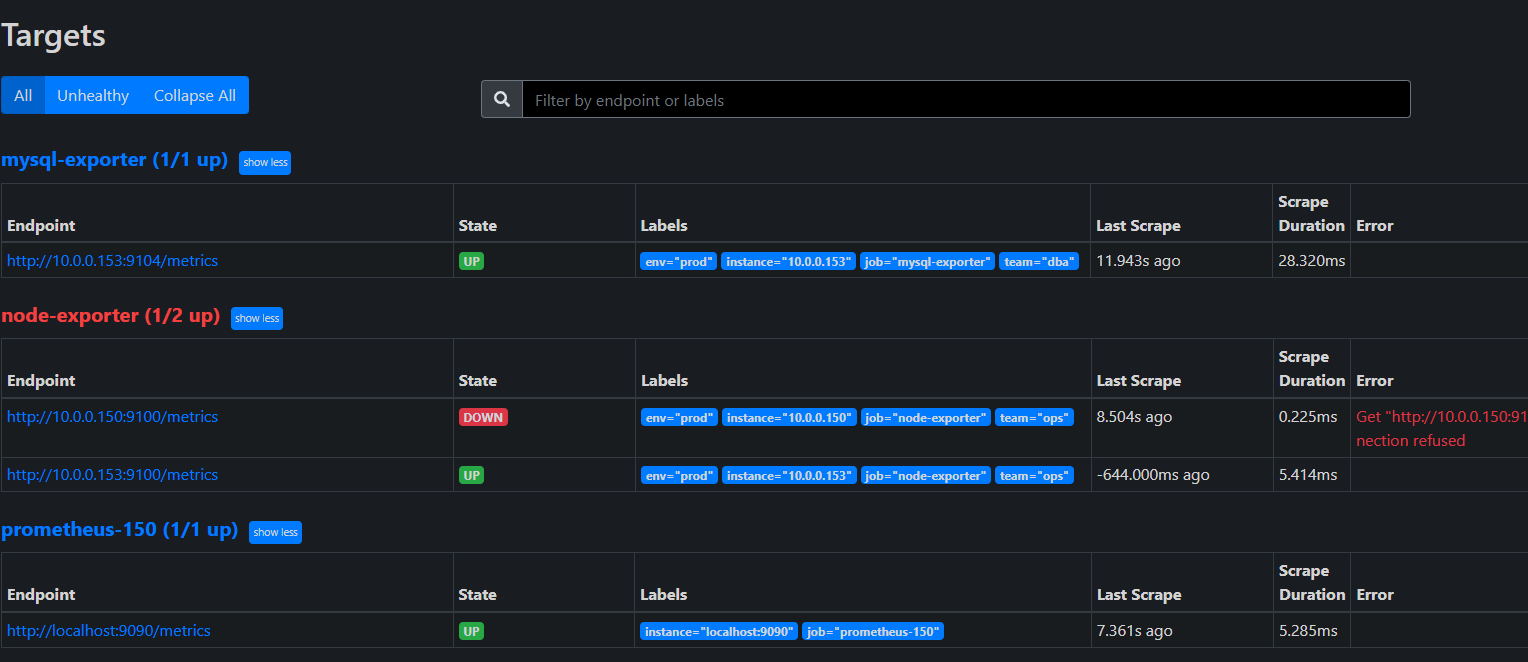
relabel_configs:
- source_labels: [__address__]
regex: "(.*):.*"
target_label: instance
replacement: "${1}" # 只保留 IP,去掉端口
- job_name: 'node-exporter'
file_sd_configs:
- files:
- '/app/prometheus/targets/node_targets.json'
refresh_interval: 30s
relabel_configs:
- source_labels: [__address__]
regex: "(.*):.*"
target_label: instance
replacement: "${1}" # 只保留 IP,去掉端口动态发现文件
bash
[
  {
    "targets": ["10.0.0.153:9104" ],
    "labels": {
      "env": "prod",
      "team": "dba"
    }
  }
]
bash
[
  {
    "targets": ["10.0.0.153:9100","10.0.0.150:9100" ],
    "labels": {
      "env": "prod",
      "team": "ops"
    }
  }
]
relabel_configs
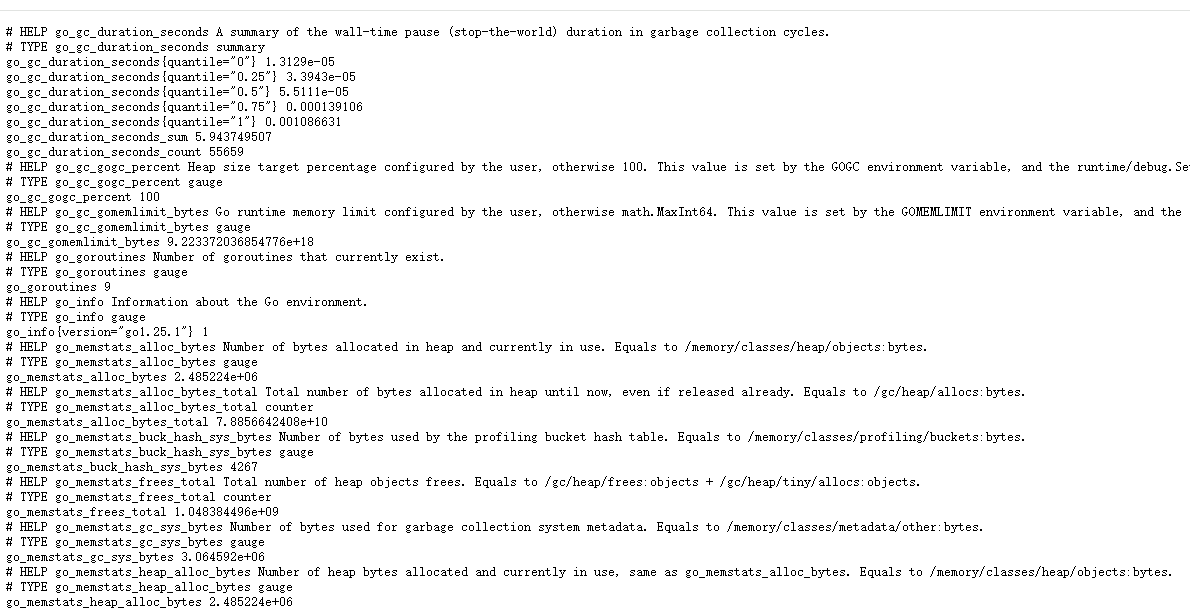
mysql-exporter http://10.0.0.153:9104/metrics
bash
# TYPE ... counter → Counter(计数器)
# TYPE ... gauge → Gauge(瞬时值)
# TYPE ... histogram → Histogram(直方图)
# TYPE ... summary → Summary(摘要)
https://prometheus.io/docs/concepts/metric_types/?spm=5176.28103460.0.0.48217551920O6F
https://github.com/prometheus/mysqld_exporter?tab=readme-ov-file
mysql 指标核实
bash
  703  systemctl cat grafana-server
  704  systemctl cat grafana.service
  705  netstat -tulnp | grep grafana
  706  ss -tulnp | grep grafana
  707  ss -tulnp | grep 9094
  708  curl http://10.0.0.153:9104/metrics:9104/metrics | grep -A 5 "innodb_buffer_pool_size"
  709  curl http://10.0.0.153:9104/metrics | grep -A 5 "innodb_buffer_pool_size"
  710  curl http://10.0.0.153:9100/metrics | grep "node_memory_MemTotal_bytes"
  711  ss -ntlup
  712  cd prometheus
  713  cp prometheus.yml prometheus-re.yml


root@elk153:~ # mysql -u root -p
Enter password:
Welcome to the MySQL monitor.  Commands end with ; or \g.
Your MySQL connection id is 22302
Server version: 8.0.44 MySQL Community Server - GPL

Copyright (c) 2000, 2025, Oracle and/or its affiliates.

Oracle is a registered trademark of Oracle Corporation and/or its
affiliates. Other names may be trademarks of their respective
owners.

Type 'help;' or '\h' for help. Type '\c' to clear the current input statement.

mysql> show status like 'innodb_buffer_pool_%';
+-------------------------------------------+--------------------------------------------------+
| Variable_name                             | Value                                            |
+-------------------------------------------+--------------------------------------------------+
| Innodb_buffer_pool_dump_status            | Dumping of buffer pool not started               |
| Innodb_buffer_pool_load_status            | Buffer pool(s) load completed at 251229 17:40:59 |
| Innodb_buffer_pool_resize_status          |                                                  |
| Innodb_buffer_pool_resize_status_code     | 0                                                |
| Innodb_buffer_pool_resize_status_progress | 0                                                |
| Innodb_buffer_pool_pages_data             | 1204                                             |
| Innodb_buffer_pool_bytes_data             | 19726336                                         |
| Innodb_buffer_pool_pages_dirty            | 0                                                |
| Innodb_buffer_pool_bytes_dirty            | 0                                                |
| Innodb_buffer_pool_pages_flushed          | 23318                                            |
| Innodb_buffer_pool_pages_free             | 6978                                             |
| Innodb_buffer_pool_pages_misc             | 10                                               |
| Innodb_buffer_pool_pages_total            | 8192                                             |
| Innodb_buffer_pool_read_ahead_rnd         | 0                                                |
| Innodb_buffer_pool_read_ahead             | 0                                                |
| Innodb_buffer_pool_read_ahead_evicted     | 0                                                |
| Innodb_buffer_pool_read_requests          | 183899199                                        |
| Innodb_buffer_pool_reads                  | 1001                                             |
| Innodb_buffer_pool_wait_free              | 0                                                |
| Innodb_buffer_pool_write_requests         | 1028190                                          |
+-------------------------------------------+--------------------------------------------------+
20 rows in set (0.04 sec)

root@elk153:~ #
root@elk153:~ # mysql -u root -p -e "SHOW STATUS LIKE 'Uptime';"
Enter password:
+---------------+--------+
| Variable_name | Value  |
+---------------+--------+
| Uptime        | 601259 |
+---------------+--------+
root@elk153:~ # awk 'BEGIN{print 598764 / 60 / 60 / 24}'
6.93014
root@elk153:~ # echo $((598764 / 60 / 60 / 24))
6
root@elk153:~ # echo "598764 / 60 / 60 / 24" | bc -l
-bash: bc: 未找到命令
root@elk153:~ # yum -y install bc

  bc.x86_64 0:1.06.95-13.el7

完毕!
root@elk153:~ # echo "598764 / 60 / 60 / 24" | bc -l
6.93013888888888888888
root@elk153:~ # echo "529642- 529278 / 300" | bc -l
527877.74000000000000000000
root@elk153:~ # echo "(529642- 529278) / 300" | bc -l
1.21333333333333333333


mysql> SHOW GLOBAL STATUS LIKE 'Queries';


root@elk153:~ # grep -i huge /proc/meminfo
AnonHugePages:    452608 kB
HugePages_Total:       0
HugePages_Free:        0
HugePages_Rsvd:        0
HugePages_Surp:        0
Hugepagesize:       2048 kB
root@elk153:~ # cat /proc/cmdline | grep -o 'hugepages=[0-9]*'
root@elk153:~ # # 查看当前进程的 cgroup 内存上限
root@elk153:~ # cat /sys/fs/cgroup/memory/memory.limit_in_bytes
9223372036854771712
root@elk153:~ #
root@elk153:~ # cat /sys/fs/cgroup/memory.max
cat: /sys/fs/cgroup/memory.max: 没有那个文件或目录
root@elk153:~ # cat /sys/kernel/mm/transparent_hugepage/enabled
[always] madvise never
grafana http://10.0.0.150:3000/
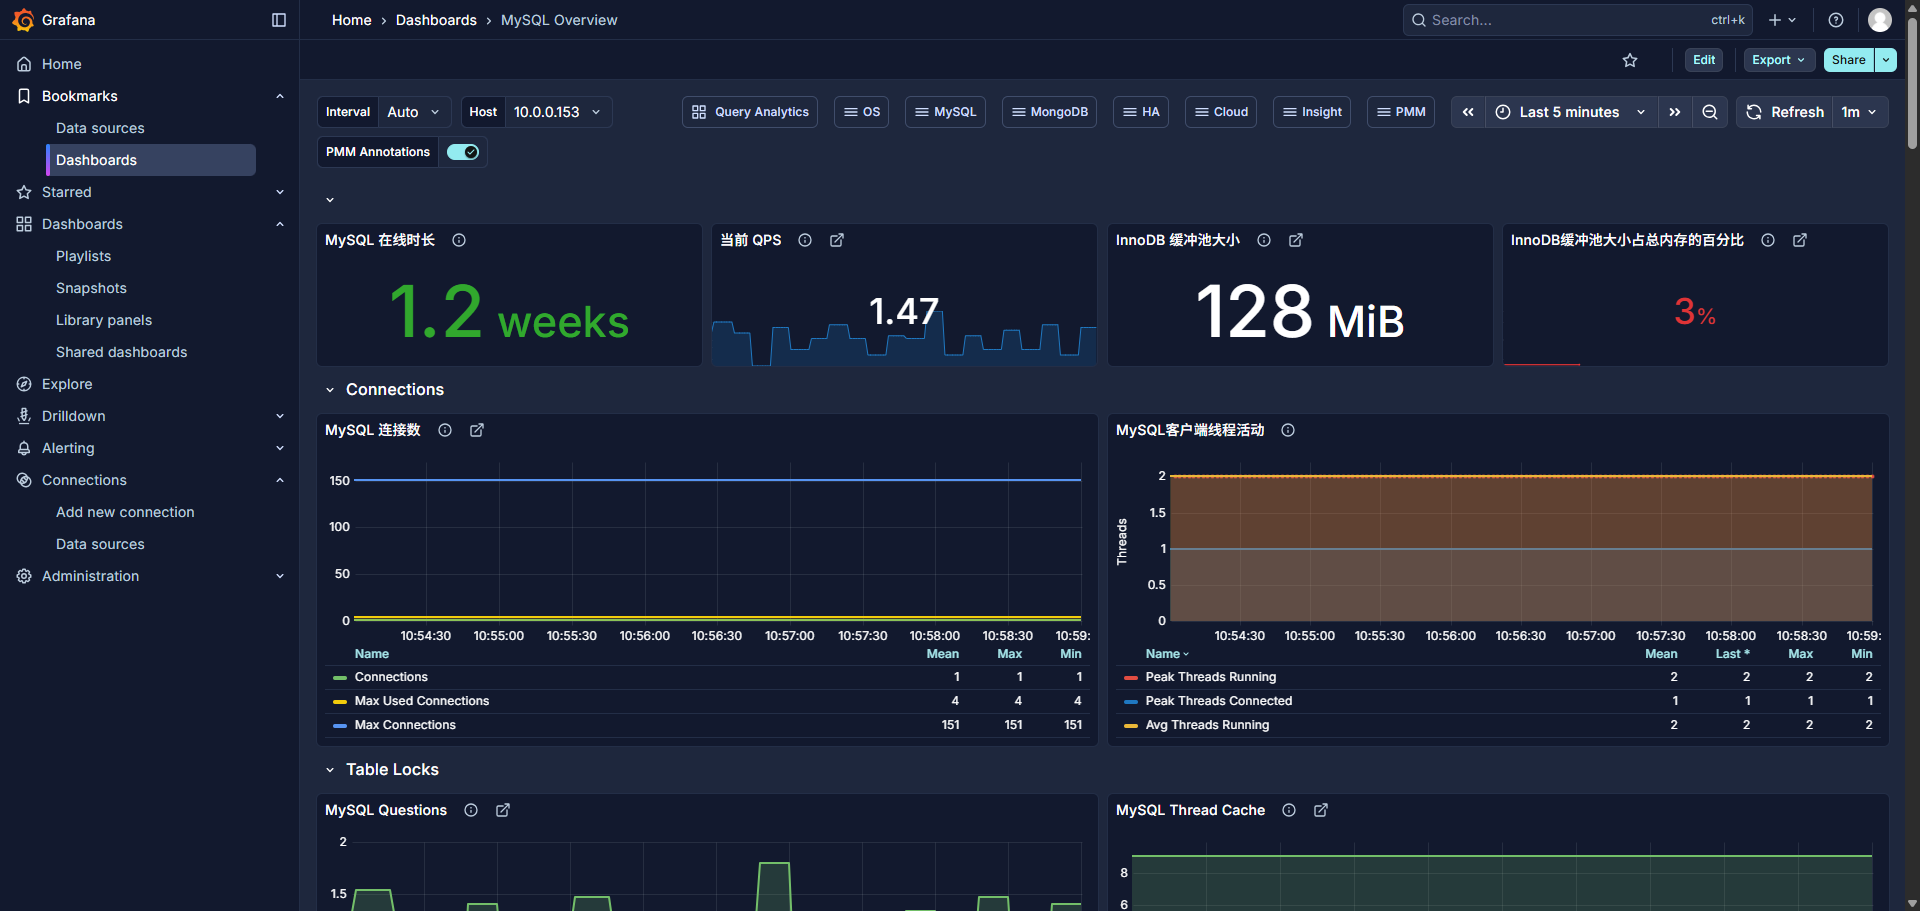
MySQL Uptime
sql
mysql_global_status_uptime{instance="$host"}
bash
root@elk153:~ # mysql -u root -p -e "SHOW STATUS LIKE 'Uptime';"
Enter password:
+---------------+--------+
| Variable_name | Value  |
+---------------+--------+
| Uptime        | 601259 |
+---------------+--------+
root@elk153:~ # awk 'BEGIN{print 598764 / 60 / 60 / 24}'
6.93014
Current QPs 当前 QPS
Based on the queries reported by MySQL'S SHOW STATUScommand, it is the number of statements executed by the serverwithin the last second. This variable includes statementsexecuted within stored programs, unlike the Questions variable. ltCOM_PINGCOM_STATISTICSdoes not countorcommands
根据MySQL的 SHOW STATUS命令报告的查询,这是服务器在上一秒内执行的语句数量。这个变量包括在存储程序中执行的语句,与Questions 变量不同。它不包括:COM_PING或COM_STATISTICS命令。
计算 QPS(每秒查询数):
QPS = (Queries2 − Queries1) / 时间间隔
sql
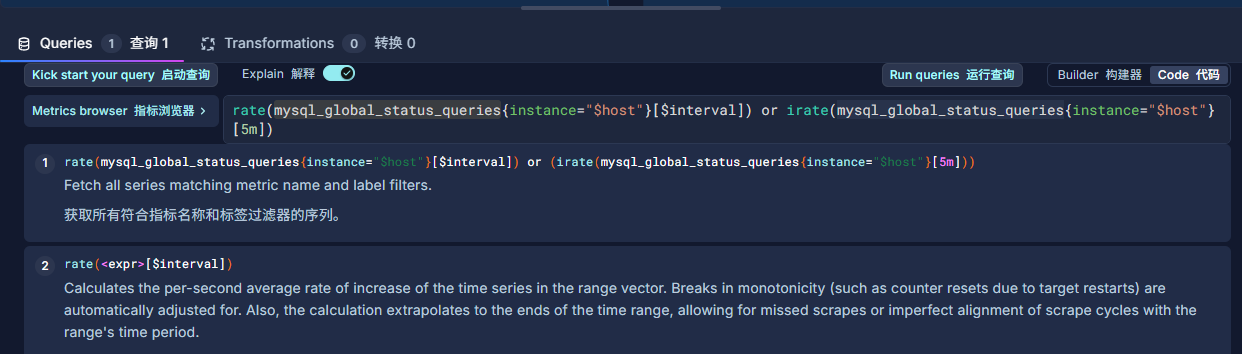
rate(mysql_global_status_queries{instance="$host"}[$interval]) or irate(mysql_global_status_queries{instance="$host"}[5m])
bash
root@elk153:~ # echo "598764 / 60 / 60 / 24" | bc -l
6.93013888888888888888
root@elk153:~ # echo "(529642- 529278) / 300" | bc -l
1.21333333333333333333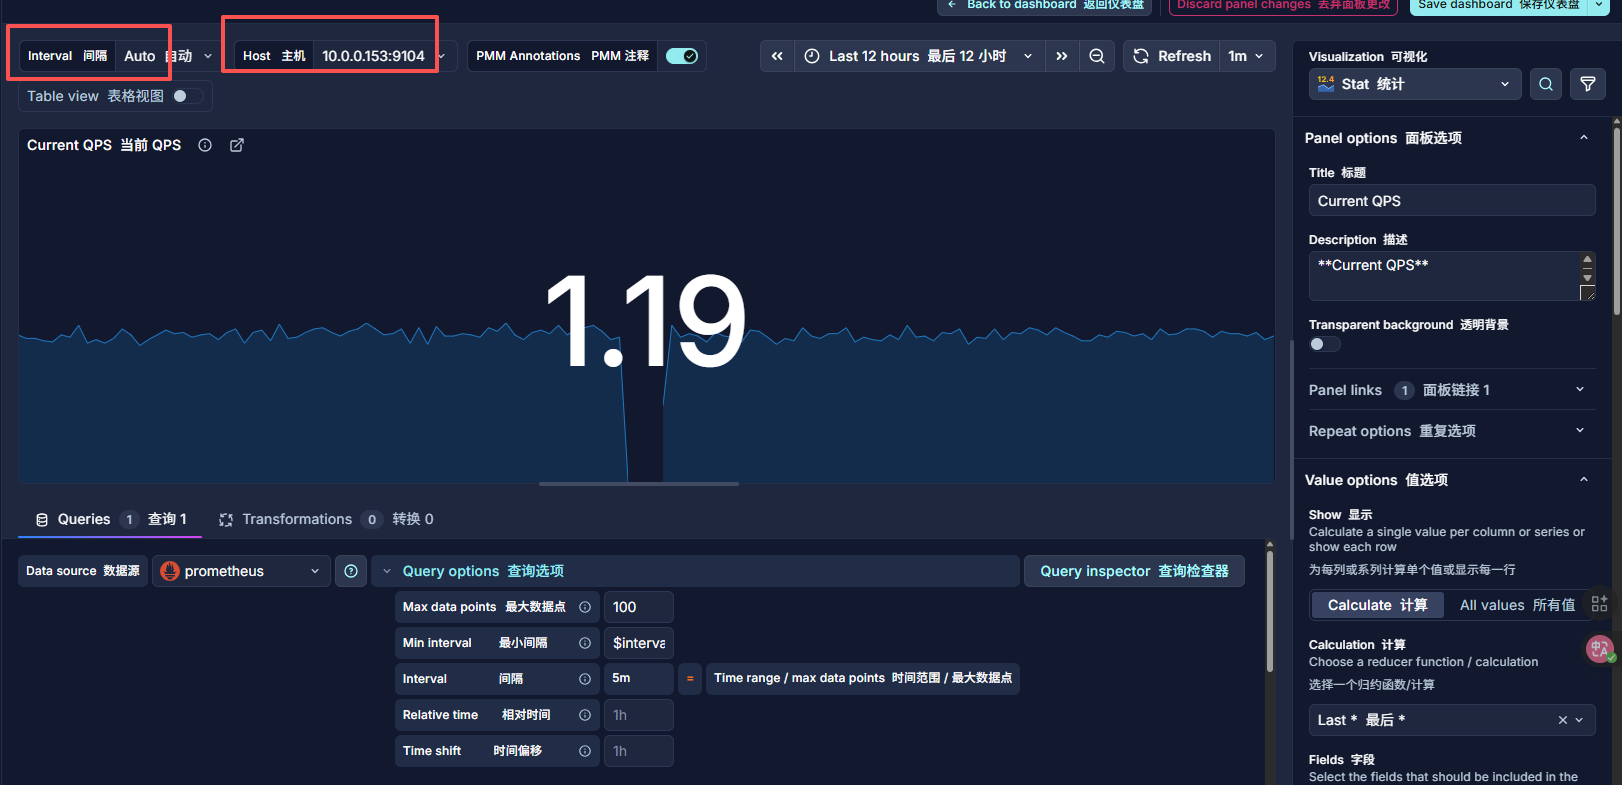
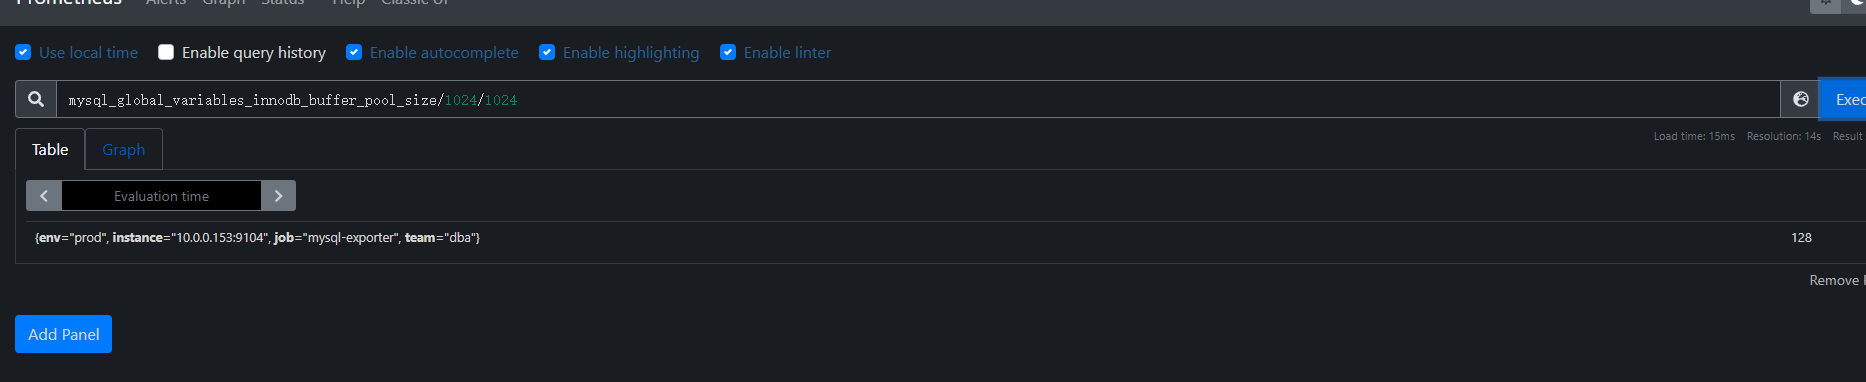
InnoDB Buffer Pool Size InnoDB 缓冲池大小
InnoDB maintains a storage area called the buffer pool forcaching data and indexes in memory. Knowing how the InnoDBbuffer pool works, and taking advantage of it to keep frequentlyaccessed data in memory, is one of the most important aspectsof MySQL tuning. The goal is to keep the working set in memoryIn most cases, this should be between 60%-90% of availablememory on a dedicated database host, but depends on manyfactors.
InnoDB 维护一个称为缓冲池的存储区域,用于在内存中缓存数据和索引。了解InnoDB 缓冲池的工作原理,并利用它将频繁访问的数据保留在内存中,是 MySQL 调优最重要的方面之一。目标是保持工作集在内存中。在大多数情况下,这应该是专用数据库主机上可用内存的60%-90%,但取决于许多因素。
sql
mysql_global_variables_innodb_buffer_pool_size{instance="$host"}
bash
mysql> SHOW VARIABLES LIKE 'innodb_buffer_pool_size';
+-------------------------+-----------+
| Variable_name           | Value     |
+-------------------------+-----------+
| innodb_buffer_pool_size | 134217728 |
+-------------------------+-----------+
1 row in set (0.00 sec)

Last login: Mon Jan  5 17:37:11 2026 from 10.0.0.1
root@elk153:~ # echo "134217728 / 1024 / 1024" | bc -l
128.00000000000000000000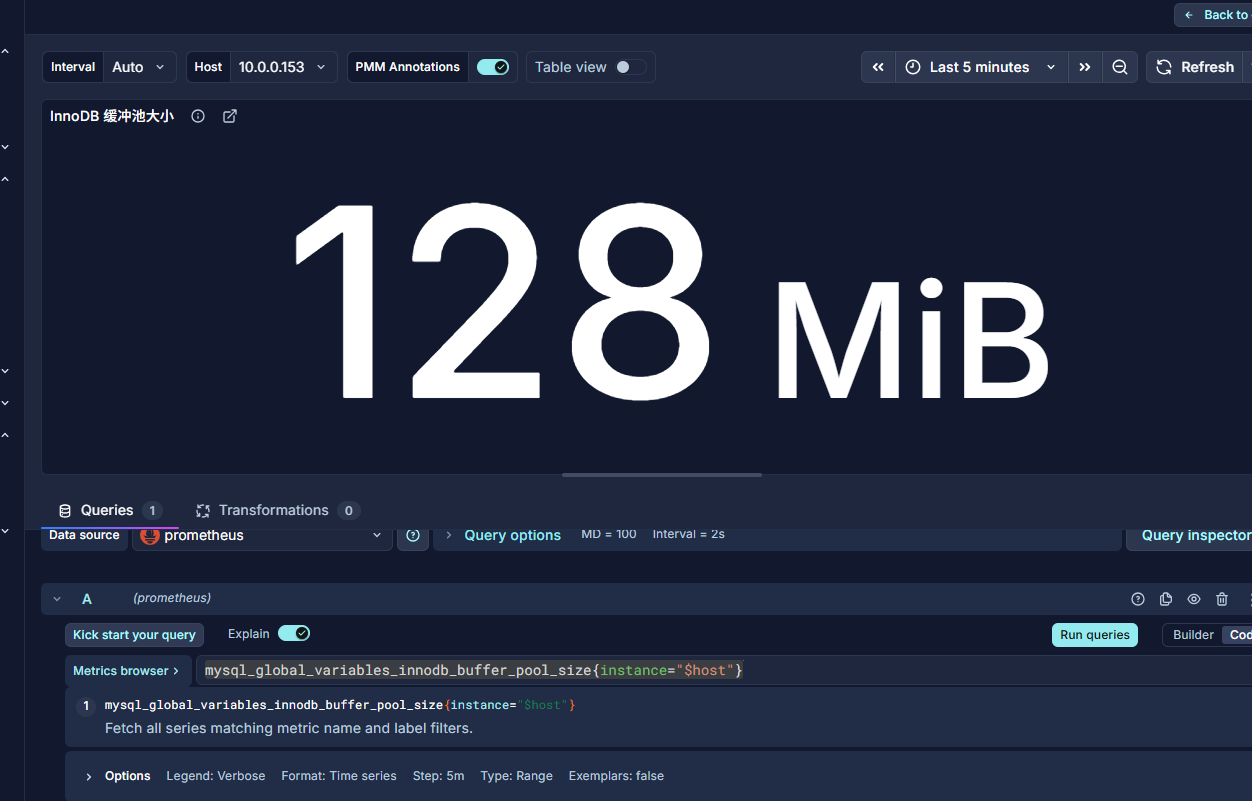
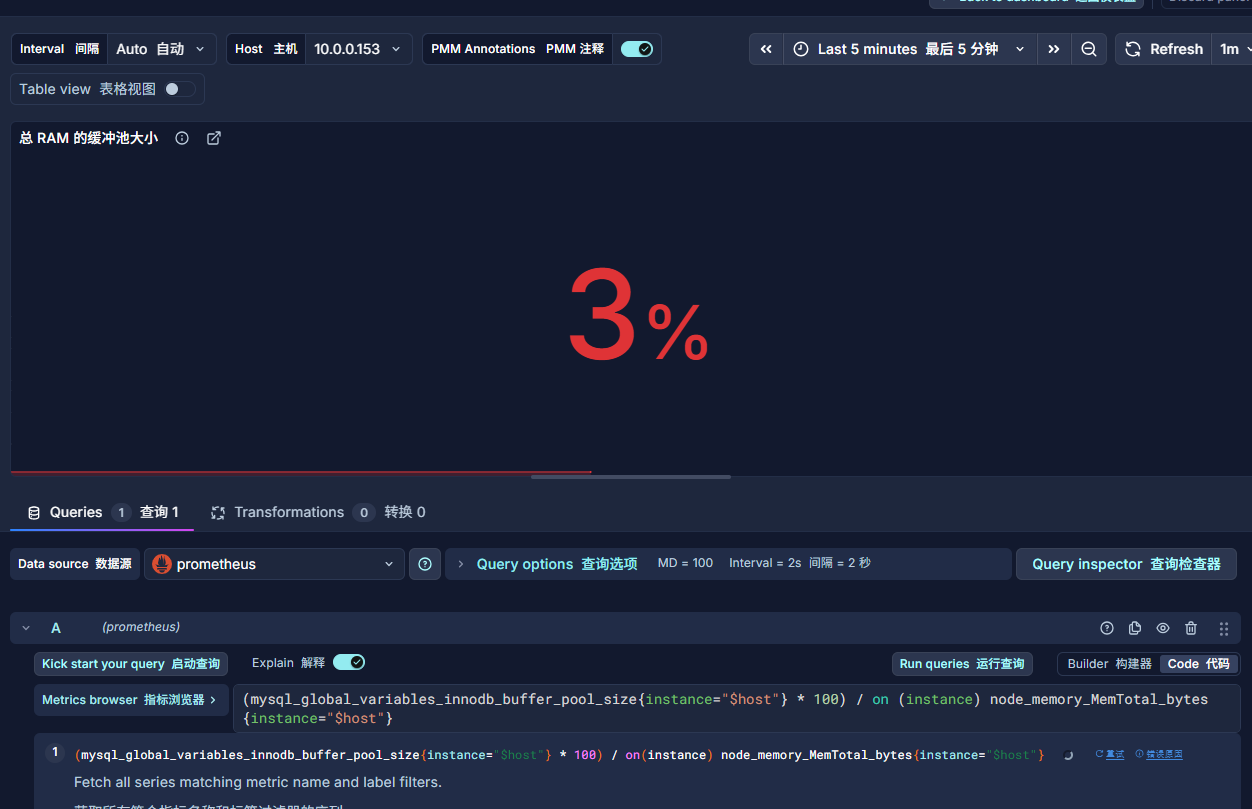
InnoDB缓冲池大小占总内存的百分比 InnoDB Buffer Pool Size % of Total RAM
InnoDB maintains a storage area called the buffer pool for caching data and indexes in memory. Knowing how the InnoDB buffer pool works, and taking advantage of it to keep frequently accessed data in memory, is one of the most important aspects of MySQL tuning. The goal is to keep the working set in memory. In most cases, this should be between 60%-90% of available memory on a dedicated database host, but depends on many factors.
- mysql-exporter 和 node-exporter 的 instance 标签不一致(端口不同),且你的 PromQL 使用了 on(instance),导致无法关联
sql
(mysql_global_variables_innodb_buffer_pool_size{instance="$host"} * 100) / on (instance) node_memory_MemTotal_bytes{instance="$host"}


round(
  (mysql_global_variables_innodb_buffer_pool_size{instance="$host"} * 100)
  /
  on(instance) node_memory_MemTotal_bytes{instance="$host"},
  0.01
)
存在误差,可能是:
Prometheus 抓取时间不同步
内存总量统计方式差异(如是否包含 swap)
四舍五入导致的小偏差
bash
mysql> SHOW VARIABLES LIKE 'innodb_buffer_pool_size';
+-------------------------+-----------+
| Variable_name           | Value     |
+-------------------------+-----------+
| innodb_buffer_pool_size | 134217728 |
+-------------------------+-----------+
1 row in set (0.00 sec)

Last login: Mon Jan  5 17:37:11 2026 from 10.0.0.1
root@elk153:~ # echo "134217728 / 1024 / 1024" | bc -l
128.00000000000000000000
root@elk153:~ # free -h
              total        used        free      shared  buff/cache   available
Mem:           4.9G        664M        1.1G         35M        3.2G        3.9G
Swap:          2.0G          0B        2.0G
root@elk153:~ # grep MemTotal /proc/meminfo
MemTotal:        5178384 kB
root@elk153:~ # echo "134217728 / 5302665216 * 100" | bc -l
2.53113712694925675600
root@elk153:~ # 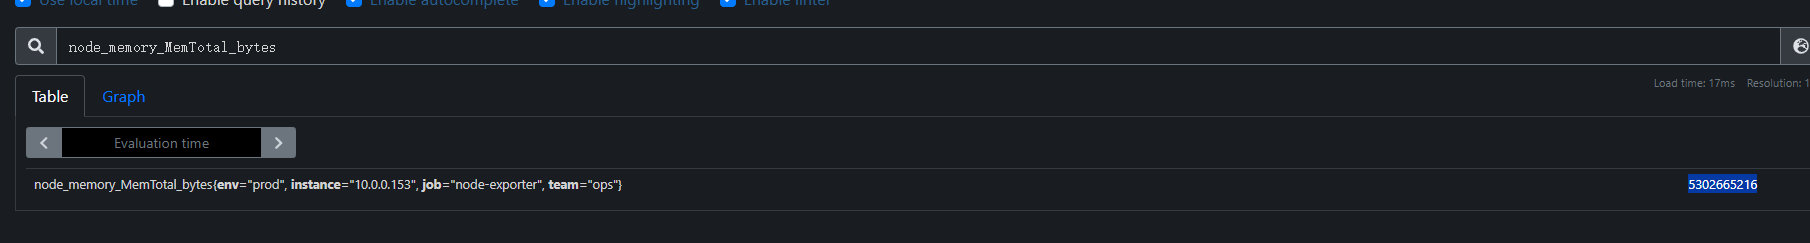
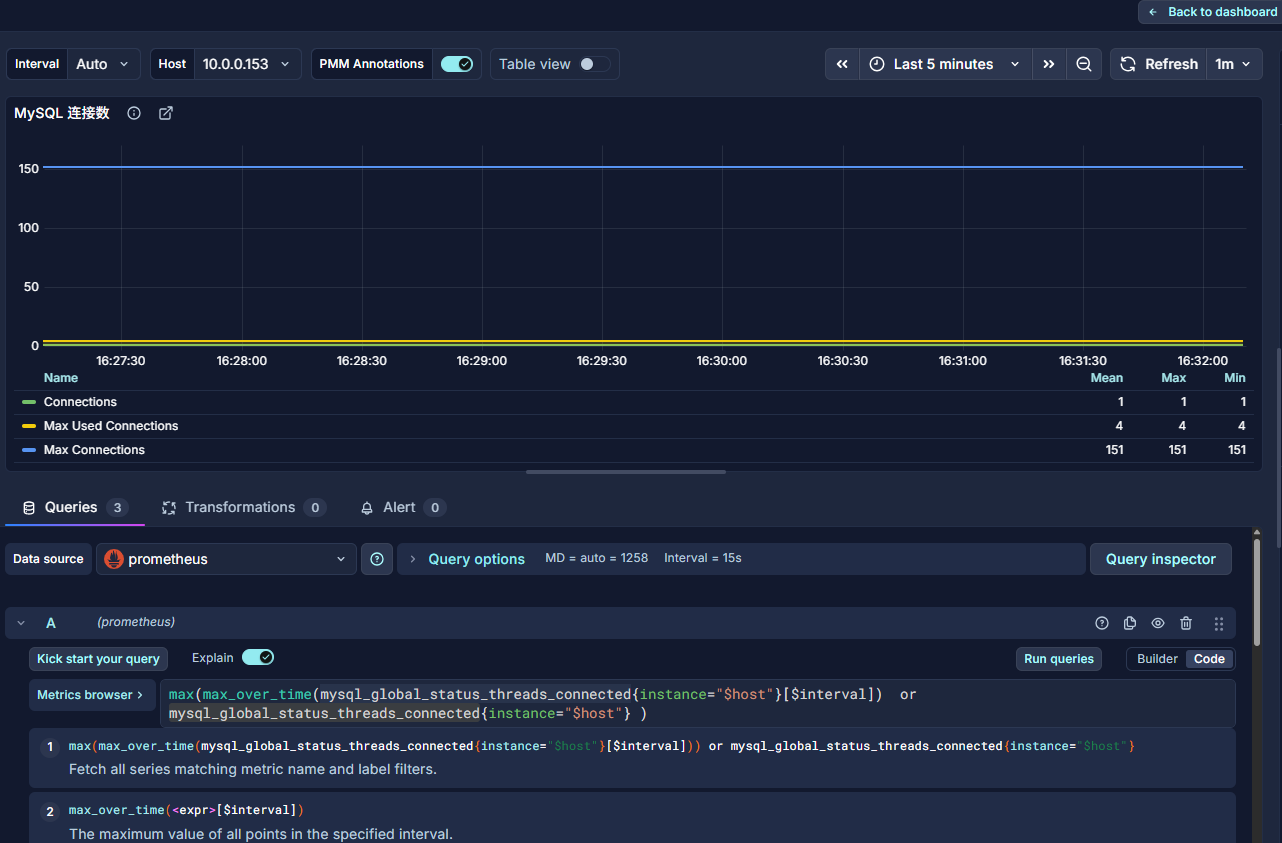
Max Connections 最大连接数
Max Connections is the maximum permitted number ofsimultaneous client connections. By default, this is 151.Increasing this value increases the number of file descriptors thatmysqld requires. If the required number of descriptors are notavailable, the server reduces the value of Max Connections.
最大连接数是允许的最大并发客户端连接数。默认情况下,这个值是151。增加这个值会增加 mysqld 所需的文件描述符数量。如果所需的描述符数量不可用,服务器会减少最大连接数的值。
16:2
mysqld actually permits Max Connections + 1 clients to connectThe extra connection is reserved for use by accounts that havethe SUPER privilege, such as root.
实际上,mysqld 允许MaxConnections+1个客户端连接。这个额外的连接是为具有 SUPER 权限的账户保留的,例如root。
Max Used Connections is the maximum number of connectionsthat have been in use simultaneously since the server started.
最大已用连接数是服务器启动以来同时使用的最大连接数。
Connections is the number of connection attempts (successful ornot) to the MySQL server.
连接数是到 MySQL 服务器的连接尝试次数(无论成功与否)。
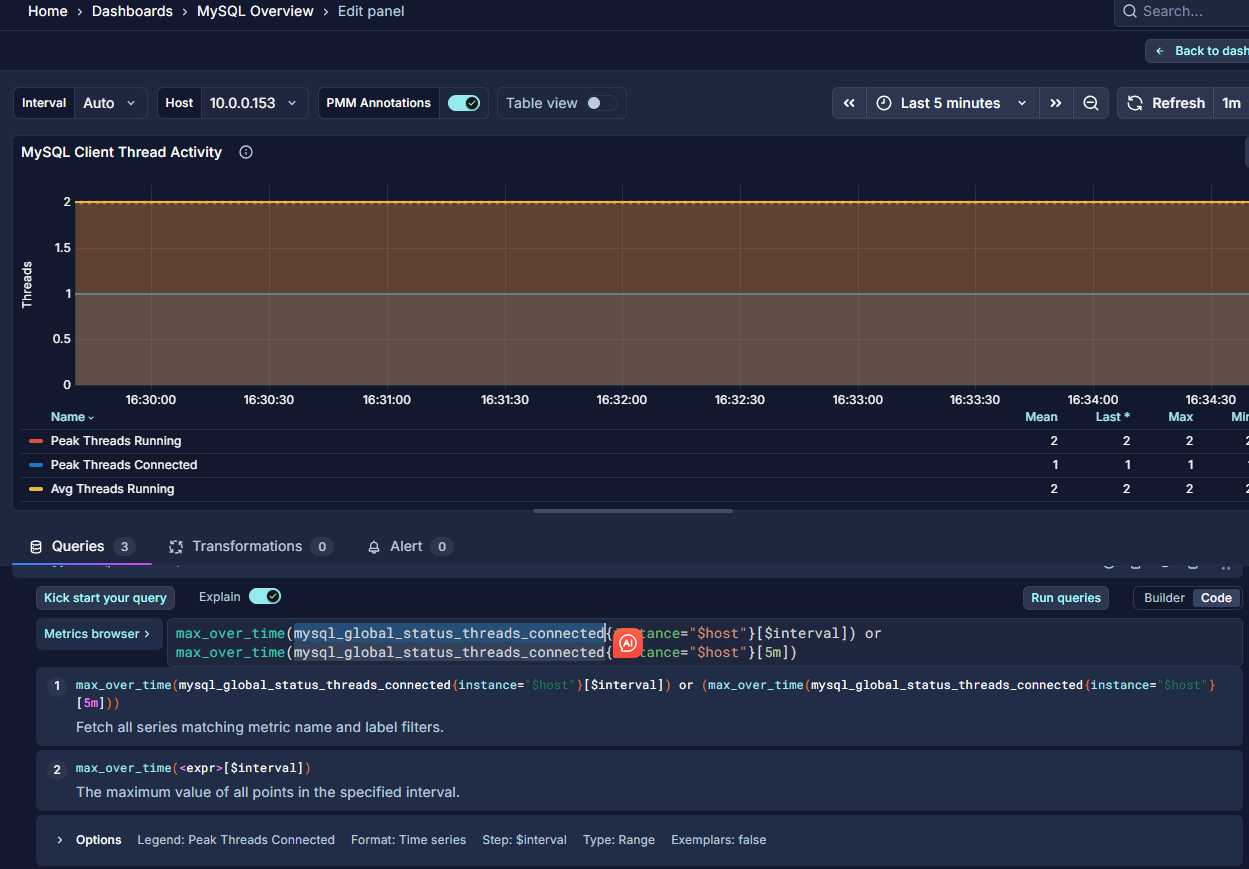
MySQL Active Threads MySQL 活跃线程
Threads Connected is the number of open connections, whileThreads Running is the number of threads not sleeping.
Threads Connected 是已打开的连接数量,而Threads Running 是未处于睡眠状态的线程数量。
MySQL Questions
The number of statements executed by the server. This includes only statements sent to the server by clients and not statements executed within stored programs, unlike the Queries used in the QPS calculation.
服务器执行的语句数量。这仅包括由客户端发送到服务器的语句,不包括在存储程序中执行的语句,这与用于 QPS 计算的查询不同。
This variable does not count the following commands:
此变量不计入以下命令:
COM_PING
COM_STATISTICS
COM_STMT_PREPARE
COM_STMT_CLOSE
COM_STMT_RESET
AlertManager 告警
https://prometheus.io/docs/alerting/latest/notification_examples/
- 配置
yml
global:
  resolve_timeout: 5m
  smtp_smarthost: 'smtp.qq.com:465'
  smtp_from: '你的@qq.com'
  smtp_auth_username: '你的@qq.com'
  smtp_auth_password: '你的xxx'
  smtp_require_tls: false

templates:
  - '/app/alertmanager/template/*.tmpl'

route:
  group_by: ['alertname', 'instance']
  group_wait: 5s           # 快速聚合
  group_interval: 10s        # 新告警 2 分钟内通知
  repeat_interval: 1m      # 未恢复的告警,每 10 分钟提醒一次
  receiver: 'default-noop'   # 默认不通知(安全兜底)

  routes:
    - match:
        severity: 'critical'
      receiver: 'critical-multi-channel'
    # warning → 仅钉钉(或可扩展为邮件+钉钉)
    - match:
        severity: 'warning'
      receiver: 'warning-dingtalk-only'
# 兜底接收器(避免告警丢失)
receivers:
  - name: 'default-noop'
    # 空接收器,不发送任何通知

  - name: 'critical-multi-channel'
    # 钉钉
    webhook_configs:
      - url: 'http://127.0.0.1:8060/dingtalk/webhook1/send'
        send_resolved: true
    # 邮件
    email_configs:
      - to: '接受的@qq.com'
        send_resolved: true
        headers:
          Subject: '[{{ .Status | toUpper }}] {{ .CommonLabels.alertname }} @ {{ .CommonLabels.instance }}'
        html: '{{ template "email.html" . }}'
 # warning 仅钉钉

  - name: 'warning-dingtalk-only'
    webhook_configs:
      - url: 'http://127.0.0.1:8060/dingtalk/webhook1/send'
        send_resolved: true
      - url: 'http://10.0.0.1:9119/wechat'
        send_resolved: true
inhibit_rules:
  - source_match:
      severity: 'critical'
    target_match:
      severity: 'warning'
equal: ['alertname', 'instance']- 模板
/app/alertmanager/template/email.html.tmpl
bash
{{ define "email.html" }}
<html>
<head>
<style>
body{font-family:Arial,Helvetica,sans-serif;font-size:14px;}
.status-critical{color:#d32f2f;font-weight:bold;}
.status-resolved{color:#388e3c;font-weight:bold;}
table{border-collapse:collapse;margin-top:8px;}
th,td{border:1px solid #ccc;padding:6px 10px;font-size:13px;}
th{background:#f5f5f5;}
</style>
</head>
<body>
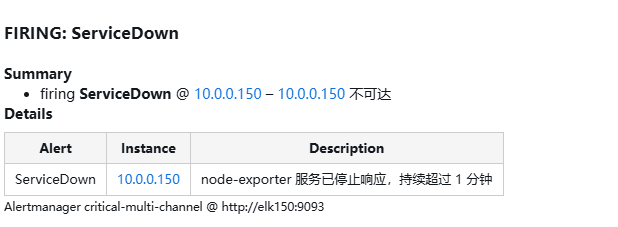
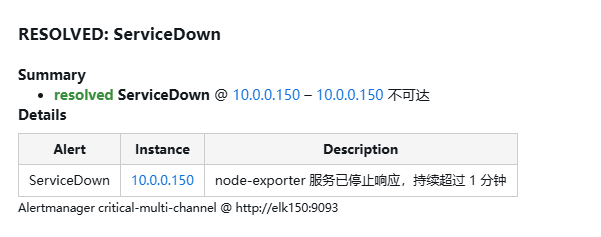
<h3>{{ .Status | toUpper }}: {{ .GroupLabels.alertname }}</h3>
<p><strong>Summary</strong></p>
<ul>
{{ range .Alerts }}
<li>
<span class="status-{{ .Status }}">{{ .Status }}</span>
<strong>{{ .Labels.alertname }}</strong> @ {{ .Labels.instance }}
{{ if .Annotations.summary }} -- {{ .Annotations.summary }}{{ end }}
</li>
{{ end }}
</ul>
<p><strong>Details</strong></p>
<table>
<tr><th>Alert</th><th>Instance</th><th>Description</th></tr>
{{ range .Alerts }}
<tr>
<td>{{ .Labels.alertname }}</td>
<td>{{ .Labels.instance }}</td>
<td>{{ .Annotations.description }}</td>
</tr>
{{ end }}
</table>
<p><small>Alertmanager {{ .Receiver }} @ {{ .ExternalURL }}</small></p>
</body>
</html>
{{ end }}邮箱
-
告警的
-
恢复
企业微信 webhook
https://cloud.tencent.com/document/product/1263/71731#.E5.88.9B.E5.BB.BA.E6.9C.BA.E5.99.A8.E4.BA.BA
https://developer.work.weixin.qq.com/document/path/91770
https://developer.work.weixin.qq.com/tutorial/全部
- python3
py
from flask import Flask, request, jsonify
import requests
import json
import logging

app = Flask(__name__)

# 可选:配置日志(更清晰)
logging.basicConfig(level=logging.INFO)
logger = logging.getLogger(__name__)

WECHAT_WEBHOOK = "https://qyapi.weixin.qq.com/cgi-bin/webhook/send?key=你的"

def format_alerts(alerts):
    lines = []
    for alert in alerts:
        status = alert.get('status', 'unknown')
        summary = alert.get('annotations', {}).get('summary', 'No summary')
        instance = alert.get('labels', {}).get('instance', 'unknown')
        alertname = alert.get('labels', {}).get('alertname', 'UnknownAlert')
        lines.append(f"[{status.upper()}] {alertname}: {summary} (instance: {instance})")
    return "\n".join(lines)

@app.route('/wechat', methods=['POST'])
def forward_to_wechat():
    # 获取原始 JSON 数据
    data = request.get_json()

    if not data:
        logger.error("Received empty or invalid JSON")
        return jsonify({"error": "Invalid JSON"}), 400

    # 🔍 调试:打印接收到的完整数据(关键!)
    logger.info("Received alert payload:")
    logger.info(json.dumps(data, indent=2, ensure_ascii=False))

    # 提取告警信息
    alerts = data.get('alerts', [])
    content = format_alerts(alerts)

    # 添加状态前缀
    if data.get('status') == 'resolved':
        content = "[✅已恢复]\n" + content
    else:
        content = "[🚨告警触发]\n" + content

    # 构造企业微信消息
    wechat_msg = {
        "msgtype": "text",
        "text": {
            "content": f"【Prometheus 告警】\n{content}"
        }
    }

    # 发送请求到企业微信
    try:
        resp = requests.post(
            WECHAT_WEBHOOK,
            json=wechat_msg,
            timeout=10
        )
        logger.info(f"Sent to WeChat, status: {resp.status_code}, response: {resp.text}")
    except Exception as e:
        logger.error(f"Failed to send to WeChat: {e}")
        return jsonify({"error": "Failed to send message"}), 500

    return jsonify({"status": "success"}), 200

# 可选:健康检查接口
@app.route('/health', methods=['GET'])
def health():
    return "OK", 200

if __name__ == '__main__':
    app.run(host='0.0.0.0', port=9119, debug=False)
AlertManager转发的内容信息
bash
INFO:werkzeug:Press CTRL+C to quit
INFO:__main__:Received alert payload:
INFO:__main__:{
  "receiver": "warning-dingtalk-only",
  "status": "firing",
  "alerts": [
    {
      "status": "firing",
      "labels": {
        "alertname": "InnoDB_Buffer_Pool_Ratio_Too_Low",
        "category": "database",
        "instance": "10.0.0.153",
        "severity": "warning",
        "team": "ops"
      },
      "annotations": {
        "description": "InnoDB 缓冲池仅占总内存的 2.5311371269492566%,建议调大以提升缓存命中率。",
        "summary": "MySQL 实例 10.0.0.153 InnoDB 缓冲池占比低于 10%"
      },
      "startsAt": "2026-01-06T03:13:28.606Z",
      "endsAt": "0001-01-01T00:00:00Z",
      "generatorURL": "http://elk150:9090/graph?g0.expr=%28mysql_global_variables_innodb_buffer_pool_size+%2F+on%28instance%29+node_memory_MemTotal_bytes%29+%2A+100+%3C+10&g0.tab=1",
      "fingerprint": "7701e18f0c8533f0"
    }
  ],
  "groupLabels": {
    "alertname": "InnoDB_Buffer_Pool_Ratio_Too_Low",
    "instance": "10.0.0.153"
  },
  "commonLabels": {
    "alertname": "InnoDB_Buffer_Pool_Ratio_Too_Low",
    "category": "database",
    "instance": "10.0.0.153",
    "severity": "warning",
    "team": "ops"
  },
  "commonAnnotations": {
    "description": "InnoDB 缓冲池仅占总内存的 2.5311371269492566%,建议调大以提升缓存命中率。",
    "summary": "MySQL 实例 10.0.0.153 InnoDB 缓冲池占比低于 10%"
  },
  "externalURL": "http://elk150:9093",
  "version": "4",
  "groupKey": "{}/{severity=\"warning\"}:{alertname=\"InnoDB_Buffer_Pool_Ratio_Too_Low\", instance=\"10.0.0.153\"}",
  "truncatedAlerts": 0
}
INFO:__main__:Received alert payload:
INFO:__main__:{
  "receiver": "warning-dingtalk-only",
  "status": "firing",
  "alerts": [
    {
      "status": "firing",
      "labels": {
        "alertname": "InnoDB_Buffer_Pool_Too_Small",
        "category": "database",
        "env": "prod",
        "instance": "10.0.0.153",
        "job": "mysql-exporter",
        "severity": "warning",
        "team": "ops"
      },
      "annotations": {
        "description": "InnoDB 缓冲池过小可能导致磁盘 I/O 增加,建议调大至 50%~70% 内存。",
        "summary": "MySQL 实例 10.0.0.153 InnoDB 缓冲池小于 256MiB"
      },
      "startsAt": "2026-01-06T03:13:28.606Z",
      "endsAt": "0001-01-01T00:00:00Z",
      "generatorURL": "http://elk150:9090/graph?g0.expr=mysql_global_variables_innodb_buffer_pool_size+%3C+2.68435456e%2B08&g0.tab=1",
      "fingerprint": "fb3885461354eca2"
    }
  ],
  "groupLabels": {
    "alertname": "InnoDB_Buffer_Pool_Too_Small",
    "instance": "10.0.0.153"
  },
  "commonLabels": {
    "alertname": "InnoDB_Buffer_Pool_Too_Small",
    "category": "database",
    "env": "prod",
    "instance": "10.0.0.153",
    "job": "mysql-exporter",
    "severity": "warning",
    "team": "ops"
  },
  "commonAnnotations": {
    "description": "InnoDB 缓冲池过小可能导致磁盘 I/O 增加,建议调大至 50%~70% 内存。",
    "summary": "MySQL 实例 10.0.0.153 InnoDB 缓冲池小于 256MiB"
  },
  "externalURL": "http://elk150:9093",
  "version": "4",
  "groupKey": "{}/{severity=\"warning\"}:{alertname=\"InnoDB_Buffer_Pool_Too_Small\", instance=\"10.0.0.153\"}",
  "truncatedAlerts": 0
}
INFO:__main__:Sent to WeChat, status: 200, response: {"errcode":0,"errmsg":"ok"}
INFO:werkzeug:10.0.0.150 - - [06/Jan/2026 16:07:50] "POST /wechat HTTP/1.1" 200 -
INFO:__main__:Sent to WeChat, status: 200, response: {"errcode":0,"errmsg":"ok"}
INFO:werkzeug:10.0.0.150 - - [06/Jan/2026 16:07:50] "POST /wechat HTTP/1.1" 200 -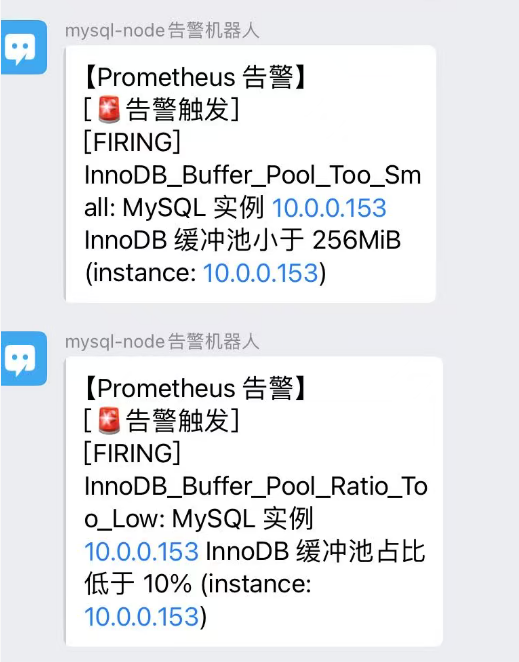
钉钉 webhook
https://open.dingtalk.com/document/development/assign-a-webhook-url-to-an-internal-chatbot
https://github.com/timonwong/prometheus-webhook-dingtalk/releases
- 安装
bash
Last login: Mon Jan  5 15:32:37 2026 from 10.0.0.1
root@elk150:~ # cd /app/prometheus
root@elk150:/app/prometheus # cd ..
root@elk150:/app # cd alertmanager
root@elk150:/app/alertmanager # cd  /server/tools/
root@elk150:/server/tools # rz
root@elk150:/server/tools # ll
总用量 322796
drwxr-xr-x 2 root root         6 12月 31 10:59 -
-r-------- 1 root root  29254678 1月   3 11:34 alertmanager-0.25.0.linux-amd64.tar.gz
-rw-r--r-- 1 root root 207315531 12月 31 16:00 grafana-enterprise_12.3.1_20271043721_linux_amd64.tar.gz
-r-------- 1 root root   9033415 12月 31 10:57 node_exporter-1.3.1.linux-amd64.tar.gz
-r-------- 1 root root  75819309 12月 30 21:43 prometheus-2.33.3.linux-amd64.tar.gz
-r-------- 1 root root   9107613 1月   5 22:32 prometheus-webhook-dingtalk-2.1.0.linux-amd64.tar.gz
root@elk150:/server/tools # tar xf  prometheus-webhook-dingtalk-2.1.0.linux-amd64.tar.gz -C /app/
root@elk150:/server/tools # cd /app/
root@elk150:/app # ll
总用量 0
lrwxrwxrwx  1 root       root        37 1月   3 11:38 alertmanager -> /app/alertmanager-0.25.0.linux-amd64/
drwxr-xr-x  3       3434       3434 105 1月   3 11:41 alertmanager-0.25.0.linux-amd64
lrwxrwxrwx  1 root       root        20 12月 31 16:01 grafana -> /app/grafana-12.3.1/
drwxr-xr-x 10 root       root       202 12月 31 16:09 grafana-12.3.1
lrwxrwxrwx  1 prometheus prometheus  35 12月 30 21:49 prometheus -> /app/prometheus-2.33.3.linux-amd64/
drwxr-x---  8 prometheus prometheus 269 1月   5 21:49 prometheus-2.33.3.linux-amd64
drwxr-xr-x  3       3434       3434  97 4月  21 2022 prometheus-webhook-dingtalk-2.1.0.linux-amd64
root@elk150:/app # ln -s /app/prometheus-webhook-dingtalk-2.1.0.linux-amd64/ /app/dingtalk
root@elk150:/app # ll
总用量 0
lrwxrwxrwx  1 root       root        37 1月   3 11:38 alertmanager -> /app/alertmanager-0.25.0.linux-amd64/
drwxr-xr-x  3       3434       3434 105 1月   3 11:41 alertmanager-0.25.0.linux-amd64
lrwxrwxrwx  1 root       root        51 1月   5 22:34 dingtalk -> /app/prometheus-webhook-dingtalk-2.1.0.linux-amd64/
lrwxrwxrwx  1 root       root        20 12月 31 16:01 grafana -> /app/grafana-12.3.1/
drwxr-xr-x 10 root       root       202 12月 31 16:09 grafana-12.3.1
lrwxrwxrwx  1 prometheus prometheus  35 12月 30 21:49 prometheus -> /app/prometheus-2.33.3.linux-amd64/
drwxr-x---  8 prometheus prometheus 269 1月   5 21:49 prometheus-2.33.3.linux-amd64
drwxr-xr-x 3 3434 3434 97 4月 21 2022 prometheus-webhook-dingtalk-2.1.0.linux-amd64- 使用 prometheus-webhook-dingtalk 转发
yml
targets:
  webhook1:
    url: https://oapi.dingtalk.com/robot/send?access_token=你的
    # secret for signature
    secret: 你的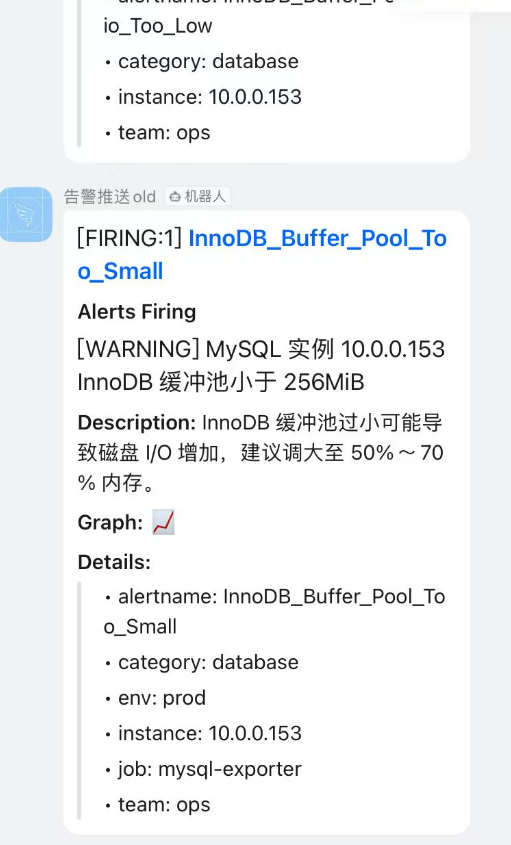
指令
- alertmanager
bash
连接主机...
连接主机成功
Last login: Tue Jan  6 08:39:38 2026 from 10.0.0.1
root@elk150:~ # cd /app/alertmanager
root@elk150:/app/alertmanager # ll
总用量 61020
-rwxr-xr-x 1 3434 3434 34546840 12月 22 2022 alertmanager
-rw-r--r-- 1 root root     1125 1月   5 22:40 alertmanager-back.yml
-rw-r--r-- 1 3434 3434     2770 1月   5 22:40 alertmanager.yml
-rwxr-xr-x 1 3434 3434 27906085 12月 22 2022 amtool
drwxr-xr-x 2 root root       35 1月   6 08:41 data
-rw-r--r-- 1 3434 3434    11357 12月 22 2022 LICENSE
-rw-r--r-- 1 3434 3434      457 12月 22 2022 NOTICE
root@elk150:/app/alertmanager # systemctl sta
start   status
root@elk150:/app/alertmanager # systemctl start a
arp-ethers.service  autovt@
root@elk150:/app/alertmanager # systemctl start alertmanager
root@elk150:/app/alertmanager # systemctl status  alertmanager
● alertmanager.service - Alertmanager
   Loaded: loaded (/etc/systemd/system/alertmanager.service; disabled; vendor preset: disabled)
   Active: activating (auto-restart) (Result: exit-code) since 二 2026-01-06 08:43:13 CST; 388ms ago
  Process: 120091 ExecStart=/app/alertmanager/alertmanager --config.file=/app/alertmanager/alertmanager.yml --storage.path=/app/alertmanager/data --web.listen-address=:9093 (code=exited, status=1/FAILURE)
 Main PID: 120091 (code=exited, status=1/FAILURE)

1月 06 08:43:13 elk150 systemd[1]: Unit alertmanager.service entered failed state.
1月 06 08:43:13 elk150 systemd[1]: alertmanager.service failed.
root@elk150:/app/alertmanager # systemctl cat   alertmanager
# /etc/systemd/system/alertmanager.service
[Unit]
Description=Alertmanager
After=network.target

[Service]
Type=simple
User=root
Group=root
WorkingDirectory=/app/alertmanager
ExecStart=/app/alertmanager/alertmanager   --config.file=/app/alertmanager/alertmanager.yml   --storage.path=/app/alertmanager/data   --web.lis
Restart=on-failure
RestartSec=10

[Install]
WantedBy=multi-user.target

root@elk150:/app/alertmanager # vim alertmanager-dingtalk.yml
root@elk150:/app/alertmanager # vim alertmanager-qq-email.yml
root@elk150:/app/alertmanager # vim alertmanager-webhook.yml
root@elk150:/app/alertmanager # systemctl start alertmanager
root@elk150:/app/alertmanager # systemctl status  alertmanager
● alertmanager.service - Alertmanager
   Loaded: loaded (/etc/systemd/system/alertmanager.service; disabled; vendor preset: disabled)
   Active: activating (auto-restart) (Result: exit-code) since 二 2026-01-06 08:56:33 CST; 4s ago
  Process: 20967 ExecStart=/app/alertmanager/alertmanager --config.file=/app/alertmanager/alertmanager.yml --storage.path=/app/alertmanager/data --web.listen-address=:9093 (code=exited, status=1/FAILURE)
 Main PID: 20967 (code=exited, status=1/FAILURE)

1月 06 08:56:33 elk150 systemd[1]: Unit alertmanager.service entered failed state.
1月 06 08:56:33 elk150 systemd[1]: alertmanager.service failed.
root@elk150:/app/alertmanager # journalctl -u alertmanager.service -f
-- Logs begin at 一 2026-01-05 08:48:16 CST. --

root@elk150:/app/alertmanager # vim alertmanager.yml
root@elk150:/app/alertmanager # al
alias         alternatives
root@elk150:/app/alertmanager # ./alertmanager --version
alertmanager, version 0.25.0 (branch: HEAD, revision: 258fab7cdd551f2cf251ed0348f0ad7289aee789)
  build user:       root@abe866dd5717
  build date:       20221222-14:51:36
  go version:       go1.19.4
  platform:         linux/amd64
root@elk150:/app/alertmanager # systemctl start alertmanager
root@elk150:/app/alertmanager # journalctl -u alertmanager.service -f
-- Logs begin at 一 2026-01-05 08:48:16 CST. --
root@elk150:/app/alertmanager # systemctl status  alertmanager
● alertmanager.service - Alertmanager
   Loaded: loaded (/etc/systemd/system/alertmanager.service; disabled; vendor preset: disabled)
   Active: activating (auto-restart) (Result: exit-code) since 二 2026-01-06 09:05:56 CST; 1s ago
  Process: 43248 ExecStart=/app/alertmanager/alertmanager --config.file=/app/alertmanager/alertmanager.yml --storage.path=/app/alertmanager/data --web.listen-address=:9093 (code=exited, status=1/FAILURE)
 Main PID: 43248 (code=exited, status=1/FAILURE)

1月 06 09:05:56 elk150 systemd[1]: Unit alertmanager.service entered failed state.
1月 06 09:05:56 elk150 systemd[1]: alertmanager.service failed.
root@elk150:/app/alertmanager # systemctl start alertmanager
root@elk150:/app/alertmanager # systemctl status  alertmanager
● alertmanager.service - Alertmanager
   Loaded: loaded (/etc/systemd/system/alertmanager.service; disabled; vendor preset: disabled)
   Active: active (running) since 二 2026-01-06 09:06:17 CST; 3s ago
 Main PID: 44069 (alertmanager)
   CGroup: /system.slice/alertmanager.service
           └─44069 /app/alertmanager/alertmanager --config.file=/app/alertmanager/alertmanager.yml --storage.path=/app/alertmanager/data --w...

1月 06 09:06:17 elk150 systemd[1]: Started Alertmanager.
root@elk150:/app/alertmanager # journalctl -u alertmanager.service -f
-- Logs begin at 一 2026-01-05 08:48:16 CST. --
root@elk150:/app/alertmanager # systemctl stop alertmanager
root@elk150:/app/alertmanager # systemctl start  alertmanager
root@elk150:/app/alertmanager # mkdir -p /app/alertmanager/template
root@elk150:/app/alertmanager # ll
总用量 61032
-rwxr-xr-x 1 3434 3434 34546840 12月 22 2022 alertmanager
-rw-r--r-- 1 root root     1125 1月   5 22:40 alertmanager-back.yml
-rw-r--r-- 1 root root      584 1月   6 08:53 alertmanager-dingtalk.yml
-rw-r--r-- 1 root root     1293 1月   6 08:54 alertmanager-qq-email.yml
-rw-r--r-- 1 root root      640 1月   6 08:55 alertmanager-webhook.yml
-rw-r--r-- 1 3434 3434     1767 1月   6 09:24 alertmanager.yml
-rwxr-xr-x 1 3434 3434 27906085 12月 22 2022 amtool
drwxr-xr-x 2 root root       35 1月   6 09:24 data
-rw-r--r-- 1 3434 3434    11357 12月 22 2022 LICENSE
-rw-r--r-- 1 3434 3434      457 12月 22 2022 NOTICE
drwxr-xr-x 2 root root        6 1月   6 09:28 template
root@elk150:/app/alertmanager # cp alertmanager-ok-qq-dingtalk.yml
cp: 在"alertmanager-ok-qq-dingtalk.yml" 后缺少了要操作的目标文件
Try 'cp --help' for more information.
root@elk150:/app/alertmanager # cp alertmanager.yml  alertmanager-ok-qq-dingtalk.yml
root@elk150:/app/alertmanager # systemctl stop alertmanager.service
root@elk150:/app/alertmanager # cd template/
root@elk150:/app/alertmanager/template # cat > /app/alertmanager/template/email.html.tmpl <<'EOF'
> {{ define "email.html" }}
> <!DOCTYPE html>
> <html>
> <head>
>   <meta charset="UTF-8">
>   <title>{{ .Subject }}</title>
> </head>
> <body>
>   <h2 style="color: red;">🚨 Prometheus 告警触发</h2>
>   <p><strong>告警名称:</strong> {{ .CommonLabels.alertname }}</p>
>   <p><strong>实例:</strong> {{ .CommonLabels.instance }}</p>
>   <p><strong>严重性:</strong> {{ .CommonLabels.severity }}</p>
>   <p><strong>描述:</strong> {{ .CommonAnnotations.description }}</p>
>   <p><strong>时间:</strong> {{ .Alerts[0].StartsAt.Format "2006-01-02 15:04:05 UTC" }}</p>
>   <p><strong>状态:</strong> {{ if eq .Status "firing" }}🔥 发生中 {{ else }}✅ 已恢复 {{ end }}</p>
>   <p><small>详情请查看: <a href="http://your-prometheus-url">Prometheus</a></small></p>
> </body>
> </html>
> {{ end }}
> EOF\
> EOF
root@elk150:/app/alertmanager/template # cd ...
-bash: cd: ...: 没有那个文件或目录
root@elk150:/app/alertmanager/template # cd ..
root@elk150:/app/alertmanager # systemctl start  alertmanager
root@elk150:/app/alertmanager # journalctl -u alertmanager.service -f
^C
root@elk150:/app/alertmanager # systemctl start  alertmanager
root@elk150:/app/alertmanager # journalctl -u alertmanager.service -f
-- Logs begin at 一 2026-01-05 08:48:16 CST. --
root@elk150:/app/alertmanager # systemctl status alertmanager
● alertmanager.service - Alertmanager
   Loaded: loaded (/etc/systemd/system/alertmanager.service; disabled; vendor preset: disabled)
   Active: active (running) since 二 2026-01-06 09:39:34 CST; 890us ago
 Main PID: 121410 (alertmanager)
   CGroup: /system.slice/alertmanager.service
           └─121410 /app/alertmanager/alertmanager --config.file=/app/alertmanager/alertmanager.yml --storage.path=/app/alertmanager/data --...

1月 06 09:39:34 elk150 systemd[1]: Started Alertmanager.
root@elk150:/app/alertmanager # journalctl -u alertmanager.service -f
^C
root@elk150:/app/alertmanager # systemctl start  alertmanager
root@elk150:/app/alertmanager # systemctl status alertmanager
● alertmanager.service - Alertmanager
   Loaded: loaded (/etc/systemd/system/alertmanager.service; disabled; vendor preset: disabled)
   Active: activating (auto-restart) (Result: exit-code) since 二 2026-01-06 09:52:02 CST; 2s ago
  Process: 20170 ExecStart=/app/alertmanager/alertmanager --config.file=/app/alertmanager/alertmanager.yml --storage.path=/app/alertmanager/data --web.listen-address=:9093 (code=exited, status=1/FAILURE)
 Main PID: 20170 (code=exited, status=1/FAILURE)

root@elk150:/app/alertmanager # systemctl status  alertmanager
● alertmanager.service - Alertmanager
   Loaded: loaded (/etc/systemd/system/alertmanager.service; disabled; vendor preset: disabled)
   Active: active (running) since 二 2026-01-06 09:59:43 CST; 29min ago
 Main PID: 38386 (alertmanager)
   CGroup: /system.slice/alertmanager.service
           └─38386 /app/alertmanager/alertmanager --config.file=/app/alertmanager/alertmanager.yml --storage.path=/app/alertmanager/data --w...

root@elk150:/app/alertmanager # cd template/
root@elk150:/app/alertmanager/template # journalctl -u alertmanager.service -f
-- Logs begin at 一 2026-01-05 08:48:16 CST. --
root@elk150:/app/alertmanager/template # cd ..

root@elk150:/app/alertmanager # systemctl stop alertmanager.service
root@elk150:/app/alertmanager # systemctl status alertmanager.service
● alertmanager.service - Alertmanager
   Loaded: loaded (/etc/systemd/system/alertmanager.service; disabled; vendor preset: disabled)
   Active: inactive (dead)

root@elk150:/app/alertmanager # systemctl start alertmanager.service
root@elk150:/app/alertmanager # systemctl status -l  alertmanager.service
● alertmanager.service - Alertmanager
   Loaded: loaded (/etc/systemd/system/alertmanager.service; disabled; vendor preset: disabled)
   Active: active (running) since 二 2026-01-06 11:15:09 CST; 34s ago
 Main PID: 82524 (alertmanager)
   CGroup: /system.slice/alertmanager.service
           └─82524 /app/alertmanager/alertmanager --config.file=/app/alertmanager/alertmanager.yml --storage.path=/app/alertmanager/data --web.listen-address=:9093

root@elk150:/app/alertmanager # journalctl -u alertmanager.service -f
-- Logs begin at 一 2026-01-05 08:48:16 CST. --

root@elk150:/app/alertmanager # journalctl -u alertmanager.service -f
-- Logs begin at 一 2026-01-05 08:48:16 CST. --
1月 06 11:15:09 elk150 alertmanager[82524]: ts=2026-01-06T03:15:09.725Z caller=cluster.go:681 level=info component=cluster msg="Waiting for gossip to settle..." interval=2s
                                           :::9094                                                         :::*                   users:(("alertmanager",pid=82524,fd=3))

root@elk150:/app/alertmanager # ps -ef |grep alertmanager
root      82524      1  0 11:15 ?        00:00:00 /app/alertmanager/alertmanager --config.file=/app/alertmanager/alertmanager.yml --storage.path=/app/alertmanager/data --web.listen-address=:9093
root     102832 115340  0 11:23 pts/3    00:00:00 grep --color=auto alertmanager
root@elk150:/app/alertmanager # ss -ntlup |grep 90
udp    UNCONN     0      0        :::9094                 :::*                   users:(("alertmanager",pid=82524,fd=7))
tcp    LISTEN     0      128       *:22                    *:*                   users:(("sshd",pid=9051,fd=3))
tcp    LISTEN     0      128      :::22                   :::*                   users:(("sshd",pid=9051,fd=4))
tcp    LISTEN     0      128      :::9090                 :::*                   users:(("prometheus",pid=66925,fd=8))
tcp    LISTEN     0      128      :::9093                 :::*                   users:(("alertmanager",pid=82524,fd=8))
tcp    LISTEN     0      128      :::9094                 :::*                   users:(("alertmanager",pid=82524,fd=3))
root@elk150:/app/alertmanager # systemctl stop  alertmanager
root@elk150:/app/alertmanager # systemctl start  alertmanager
root@elk150:/app/alertmanager # journalctl -u alertmanager.service -f
-- Logs begin at 一 2026-01-05 08:48:16 CST. --
1月 06 11:27:15 elk150 alertmanager[110584]: ts=201-06T03:33:29.270Z caller=email.go:164 level=warn integration=email msg="failed to close SMTP connection" err="short response: \u0000\u0000\u0000\u001a\u0000\u0000\u0000"
root@elk150:/app/alertmanager # cp alertmanager.yml alertmanager-ok-header.yml
root@elk150:/app/alertmanager # systemctl stop alertmanager.service
root@elk150:/app/alertmanager # systemctl start  alertmanager.service
root@elk150:/app/alertmanager # journalctl -u alertmanager.service -f
-- Logs begin at 一 2026-01-05 08:48:16 CST. --
1月 06 13:25:33 elk150 alertmanager[95721]: ts=2026-01-06T05:25:33.741Z caller=email.go:164 level=warn integration=email msg="failed to close SMTP connection" err="short response: \u0000\u0000\u0000\u001a\u0000\u0000\u0000"
root@elk150:/app/alertmanager # systemctl stop  alertmanager.service
root@elk150:/app/alertmanager # systemctl start  alertmanager.service
root@elk150:/app/alertmanager # journalctl -u alertmanager.service -f
-- Logs begin at 一 2026-01-05 08:48:16 CST. --
1月 06 14:59:32 elk150 systemd[1]: Started Alertmanager.
root@elk150:/app/alertmanager # pip --version
-bash: pip: 未找到命令
root@elk150:/app/alertmanager # pip --version
pip 8.1.2 from /usr/lib/python2.7/site-packages (python 2.7)
root@elk150:/app/alertmanager # systemctl stop alertmanager.service
root@elk150:/app/alertmanager # systemctl start alertmanager.service
root@elk150:/app/alertmanager #
root@elk150:/app/alertmanager # journalctl -u alertmanager.service -f
-- Logs begin at 一 2026-01-05 08:48:16 CST. --
1月 06 15:55:14 elk150 systemd[1]: Started Alertmanager.
root@elk150:/app/alertmanager # systemctl status alertmanager.service
● alertmanager.service - Alertmanager
   Loaded: loaded (/etc/systemd/system/alertmanager.service; disabled; vendor preset: disabled)
   Active: active (running) since 二 2026-01-06 15:55:14 CST; 14s ago
 Main PID: 124328 (alertmanager)
   CGroup: /system.slice/alertmanager.service
           └─124328 /app/alertmanager/alertmanager --config.file=/app/alertmanager/alertmanager.yml --storage.path=/app/alertmanager/data --web.listen-address=:9093

1月 06 15:55:14 elk150 alertmanager[124328]: ts=2026-01XZ caller=cluster.go:698 level=info component=cluster msg="gossip settled; proceeding" elapsed=10.00394965s
Hint: Some lines were ellipsized, use -l to show in full.
root@elk150:/app/alertmanager # systemctl stop alertmanager.service
root@elk150:/app/alertmanager # systemctl start alertmanager.service
root@elk150:/app/alertmanager # systemctl status alertmanager.service
● alertmanager.service - Alertmanager
   Loaded: loaded (/etc/systemd/system/alertmanager.service; disabled; vendor preset: disabled)
   Active: active (running) since 二 2026-01-06 15:59:26 CST; 2s ago
 Main PID: 8264 (alertmanager)
   CGroup: /system.slice/alertmanager.service
           └─8264 /app/alertmanager/alertmanager --config.file=/app/alertmanager/alertmanager.yml --storage.path=/app/alertmanager/data --web.listen-address=:9093

root@elk150:/app/alertmanager # systemctl stop alertmanager.service
root@elk150:/app/alertmanager # ll
总用量 61040
drwxr-xr-x 2 root root       31 1月   6 15:07 adaptor
-rwxr-xr-x 1 3434 3434 34546840 12月 22 2022 alertmanager
-rw-r--r-- 1 root root     1125 1月   5 22:40 alertmanager-back.yml
-rw-r--r-- 1 root root      584 1月   6 08:53 alertmanager-dingtalk.yml
-rw-r--r-- 1 root root     2089 1月   6 11:37 alertmanager-ok-header.yml
-rw-r--r-- 1 root root     1767 1月   6 09:29 alertmanager-ok-qq-dingtalk.yml
-rw-r--r-- 1 root root     1302 1月   6 09:30 alertmanager-qq-email.yml
-rw-r--r-- 1 root root      640 1月   6 08:55 alertmanager-webhook.yml
-rw-r--r-- 1 3434 3434     1775 1月   6 15:59 alertmanager.yml
-rwxr-xr-x 1 3434 3434 27906085 12月 22 2022 amtool
drwxr-xr-x 2 root root       35 1月   6 16:13 data
-rw-r--r-- 1 3434 3434    11357 12月 22 2022 LICENSE
-rw-r--r-- 1 3434 3434      457 12月 22 2022 NOTICE
drwxr-xr-x 2 root root       29 1月   6 09:37 template
root@elk150:/app/alertmanager # cd ..
root@elk150:/app # cd prometheus
root@elk150:/app/prometheus # - prometheus
bash
root@elk150:/app/prometheus # cd /app/prometheus
root@elk150:/app/prometheus # ll
总用量 196088
drwxr-xr-x  2 root       root              53 1月   5 21:49 alerts
drwxr-x---  2 prometheus prometheus        38 2月  12 2022 console_libraries
drwxr-x---  2 prometheus prometheus       173 2月  12 2022 consoles
drwxr-x--- 14 prometheus prometheus      4096 1月   6 08:23 data
-rwxr-x---  1 prometheus prometheus     11357 2月  12 2022 LICENSE
drwxr-xr-x  3 root       root              45 12月 31 11:01 node-exporter
-rwxr-x---  1 prometheus prometheus      3773 2月  12 2022 NOTICE
-rwxr-x---  1 prometheus prometheus 104427627 2月  12 2022 prometheus
-rwxr-x---  1 root       root             453 12月 31 14:22 prometheus1.yml
-rwxr-x---  1 root       root             938 12月 31 10:18 prometheus-back.yml
-rwxr-x---  1 root       root             707 1月   5 15:25 prometheus-re.yml
-rwxr-x---  1 prometheus prometheus      1066 1月   5 21:49 prometheus.yml
-rwxr-x---  1 prometheus prometheus  96322328 2月  12 2022 promtool
drwxr-xr-x  2 root       root              57 12月 31 15:05 targets
oot@elk150:/app/prometheus # journalctl -u alertmanager.service -f
-- Logs begin at 一 2026-01-05 08:48:16 CST. --
1月 06 08:45:06 elk150 alertmanager[124539]: ts=2026-01-06T00:45:06.355Z caller=cluster.go:690 level=info component=cluster msg="gossip not settled but continuing anyway" polls=0 elapsed=14.46792ms
1月 06 08:45:06 elk150 systemd[1]: alertmanager.service: main process exited, code=exited, status=1/FAILURE
1月 06 08:45:06 elk150 systemd[1]: Unit alertmanager.service entered failed state.
1月 06 08:45:06 elk150 systemd[1]: alertmanager.service failed.
^C
root@elk150:/app # cd prometheus
root@elk150:/app/prometheus # ss -ntlup
Netid State      Recv-Q Send-Q                        Local Address:Port                                       Peer Address:Port
udp   UNCONN     0      0                                         *:123                                                   *:*                   users:(("chronyd",pid=8782,fd=7))
udp   UNCONN     0      0                                 127.0.0.1:323                                                   *:*                   users:(("chronyd",pid=8782,fd=5))
udp   UNCONN     0      0                                       ::1:323                                                  :::*                   users:(("chronyd",pid=8782,fd=6))
udp   UNCONN     0      0                                        :::9094                                                 :::*                   users:(("alertmanager",pid=38386,fd=7))
tcp   LISTEN     0      128                                       *:22                                                    *:*                   users:(("sshd",pid=9051,fd=3))
tcp   LISTEN     0      100                               127.0.0.1:25                                                    *:*                   users:(("master",pid=9305,fd=13))
tcp   LISTEN     0      128                                      :::22                                                   :::*                   users:(("sshd",pid=9051,fd=4))
tcp   LISTEN     0      128                                      :::3000                                                 :::*                   users:(("grafana",pid=20781,fd=20))
tcp   LISTEN     0      100                                     ::1:25                                                   :::*                   users:(("master",pid=9305,fd=14))
tcp   LISTEN     0      128                                      :::8060                                                 :::*                   users:(("prometheus-webh",pid=67060,fd=3))
tcp   LISTEN     0      128                                      :::9090                                                 :::*                   users:(("prometheus",pid=48751,fd=8))
tcp   LISTEN     0      128                                      :::9093                                                 :::*                   users:(("alertmanager",pid=38386,fd=8))
tcp   LISTEN     0      128                                      :::9094                                                 :::*                   users:(("alertmanager",pid=38386,fd=3))
root@elk150:/app/prometheus # curl -X POST http://localhost:9090/-/reload
Lifecycle API is not enabled.root@elk150:/app/prometheus # sudo vim /etc/systemd/system/prometheus.service

连接主机成功
Last login: Tue Jan  6 11:02:03 2026 from 10.0.0.1
root@elk150:~ # sudo vim /etc/systemd/system/prometheus.service
root@elk150:~ # systecml daemon-reload
-bash: systecml: 未找到命令
root@elk150:~ # systemctl daemon-reload
root@elk150:~ # systemctl stop  prometheus
root@elk150:~ # systemctl start   prometheus
Failed to start prometheus.service: Unit is not loaded properly: Invalid argument.
See system logs and 'systemctl status prometheus.service' for details.
root@elk150:~ # systemctl start   prometheus
Failed to start prometheus.service: Unit is not loaded properly: Invalid argument.
See system logs and 'systemctl status prometheus.service' for details.
root@elk150:~ # journalctl -u prometheus.service -f
-- Logs begin at 一 2026-01-05 08:48:16 CST. --
1月 06 11:03:53 elk150 systemd[1]: prometheus.service lacks both ExecStart= and ExecStop= setting. Refusing.
1月 06 11:03:53 elk150 systemd[1]: [/etc/systemd/system/prometheus.service:10] Trailing garbage, ignoring.
1月 06 11:03:53 elk150 systemd[1]: [/etc/systemd/system/prometheus.service:11] Unknown lvalue '--storage.tsdb.path' in section 'Service'
1月 06 11:03:53 elk150 systemd[1]: prometheus.service lacks both ExecStart= and ExecStop= setting. Refusing.

root@elk150:~ # sudo vim /etc/systemd/system/prometheus.service
root@elk150:~ # systemctl daemon-reload
root@elk150:~ # systemctl start   prometheus
Failed to start prometheus.service: Unit is not loaded properly: Invalid argument.
See system logs and 'systemctl status prometheus.service' for details.
root@elk150:~ # systemctl start prometheus
Failed to start prometheus.service: Unit is not loaded properly: Invalid argument.
See system logs and 'systemctl status prometheus.service' for details.
root@elk150:~ # systemctl stop  prometheus
Failed to stop prometheus.service: Unit prometheus.service not loaded.
root@elk150:~ # ss -ntl
State       Recv-Q Send-Q                          Local Address:Port                                         Peer Address:Port
LISTEN      0      128                                         *:22                                                      *:*
LISTEN      0      100                                 127.0.0.1:25                                                      *:*
LISTEN      0      128                                        :::22                                                     :::*
LISTEN      0      128                                        :::3000                                                   :::*
LISTEN      0      100                                       ::1:25                                                     :::*
LISTEN      0      128                                        :::8060                                                   :::*
LISTEN      0      128                                        :::9093                                                   :::*
LISTEN      0      128                                        :::9094                                                   :::*
root@elk150:~ # ps -ef | grep pro
root      62092 115338  0 11:06 ?        00:00:00 bash -c export LANG="en_US";export LANGUAGE="en_US";export LC_ALL="en_US";free;echo finalshell_separator;uptime;echo finalshell_separator;cat /proc/net/dev;echo finalshell_separator;df;echo finalshell_separator;sleep 1;free;echo finalshell_separator;uptime;echo finalshell_separator;cat /proc/net/dev;echo finalshell_separator;df;echo finalshell_separator;
root      62106  52295  0 11:06 pts/0    00:00:00 grep --color=auto pro
root      67060      1  0 08:19 ?        00:00:00 ./prometheus-webhook-dingtalk --config.file=./config.example.yml
root@elk150:~ # sudo vim /etc/systemd/system/prometheus.service
root@elk150:~ # systemctl start prometheus
root@elk150:~ # journalctl -u prometheus.service -f
-- Logs begin at 一 2026-01-05 08:48:16 CST. --
root@elk150:~ # systemctl daemon-reload
root@elk150:~ # systemctl stop  prometheus
root@elk150:~ # systemctl start  prometheus
root@elk150:~ # journalctl -u prometheus.service -f
-- Logs begin at 一 2026-01-05 08:48:16 CST. --
1月 06 11:08:28 elk150 prometheus[66925]: ts=2026-01-06T03:08:28.618Z caller=checkpoint.go:98 level=info component=tsdb msg="Creating checkpoint" from_segment=242 to_segment=243 mint=1767636000000
1月 06 11:08:28 elk150 prometheus[66925]: ts=2026-01-06T03:08:28.696Z caller=head.go:987 level=info component=tsdb msg="WAL checkpoint complete" first=242 last=243 duration=78.121604ms
root@elk150:~ # curl -X POST http://localhost:9090/-/reload
root@elk150:~ # ss -ntlup
Netid  State      Recv-Q Send-Q                                Local Address:Port                                               Peer Address:Port
udp    UNCONN     0      0                                                 *:123                                                           *:*                   users:(("chronyd",pid=8782,fd=7))
udp    UNCONN     0      0                                         127.0.0.1:323                                                           *:*                   users:(("chronyd",pid=8782,fd=5))
udp    UNCONN     0      0                                               ::1:323                                                          :::*                   users:(("chronyd",pid=8782,fd=6))
udp    UNCONN     0      0                                                :::9094                                                         :::*                   users:(("alertmanager",pid=110584,fd=7))
tcp    LISTEN     0      128                                               *:22                                                            *:*                   users:(("sshd",pid=9051,fd=3))
tcp    LISTEN     0      100                                       127.0.0.1:25                                                            *:*                   users:(("master",pid=9305,fd=13))
tcp    LISTEN     0      128                                              :::22                                                           :::*                   users:(("sshd",pid=9051,fd=4))
tcp    LISTEN     0      128                                              :::3000                                                         :::*                   users:(("grafana",pid=20781,fd=20))
tcp    LISTEN     0      100                                             ::1:25                                                           :::*                   users:(("master",pid=9305,fd=14))
tcp    LISTEN     0      128                                              :::8060                                                         :::*                   users:(("prometheus-webh",pid=67060,fd=3))
tcp    LISTEN     0      128                                              :::9090                                                         :::*                   users:(("prometheus",pid=66925,fd=8))
tcp    LISTEN     0      128                                              :::9093                                                         :::*                   users:(("alertmanager",pid=110584,fd=8))
tcp    LISTEN     0      128                                              :::9094                                                         :::*                   users:(("alertmanager",pid=110584,fd=3))
root@elk150:~ # cd /app/
root@elk150:/app # ll
总用量 0
lrwxrwxrwx  1 root       root        37 1月   3 11:38 alertmanager -> /app/alertmanager-0.25.0.linux-amd64/
drwxr-xr-x  4       3434       3434 287 1月   6 09:29 alertmanager-0.25.0.linux-amd64
lrwxrwxrwx  1 root       root        51 1月   5 22:34 dingtalk -> /app/prometheus-webhook-dingtalk-2.1.0.linux-amd64/
lrwxrwxrwx  1 root       root        20 12月 31 16:01 grafana -> /app/grafana-12.3.1/
drwxr-xr-x 10 root       root       202 12月 31 16:09 grafana-12.3.1
lrwxrwxrwx  1 prometheus prometheus  35 12月 30 21:49 prometheus -> /app/prometheus-2.33.3.linux-amd64/
drwxr-x---  8 prometheus prometheus 269 1月   5 21:49 prometheus-2.33.3.linux-amd64
drwxr-xr-x  3       3434       3434 114 1月   5 22:46 prometheus-webhook-dingtalk-2.1.0.linux-amd64

root@elk150:/app # cd /server/
root@elk150:/server # cd tools/
root@elk150:/server/tools # ll
总用量 322796
drwxr-xr-x 2 root root         6 12月 31 10:59 -
-r-------- 1 root root  29254678 1月   3 11:34 alertmanager-0.25.0.linux-amd64.tar.gz
-rw-r--r-- 1 root root 207315531 12月 31 16:00 grafana-enterprise_12.3.1_20271043721_linux_amd64.tar.gz
-r-------- 1 root root   9033415 12月 31 10:57 node_exporter-1.3.1.linux-amd64.tar.gz
-r-------- 1 root root  75819309 12月 30 21:43 prometheus-2.33.3.linux-amd64.tar.gz
-r-------- 1 root root   9107613 1月   5 22:32 prometheus-webhook-dingtalk-2.1.0.linux-amd64.tar.gz
root@elk150:/server/tools # cd /app/
root@elk150:/app # cd prometheus
root@elk150:/app/prometheus # cd node-exporter/
root@elk150:/app/prometheus/node-exporter # ll
总用量 0
drwxr-xr-x 2 3434 3434 56 12月  5 2021 node_exporter-1.3.1.linux-amd64
root@elk150:/app/prometheus/node-exporter # cd node_exporter-1.3.1.linux-amd64/
root@elk150:/app/prometheus/node-exporter/node_exporter-1.3.1.linux-amd64 # node_exporter
root@elk150:/app/prometheus/node-exporter/node_exporter-1.3.1.linux-amd64 # node_exporter
root@elk150:/app/prometheus/node-exporter/node_exporter-1.3.1.linux-amd64 # ll /bin/no
node_exporter  nohup
root@elk150:/app/prometheus/node-exporter/node_exporter-1.3.1.linux-amd64 # cd ..
root@elk150:/app/prometheus/node-exporter # system
systemctl                       systemd-coredumpctl             systemd-inhibit                 systemd-run
systemd-analyze                 systemd-delta                   systemd-loginctl                systemd-stdio-bridge
systemd-ask-password            systemd-detect-virt             systemd-machine-id-setup        systemd-sysv-convert
systemd-cat                     systemd-escape                  systemd-notify                  systemd-tmpfiles
systemd-cgls                    systemd-firstboot               systemd-nspawn                  systemd-tty-ask-password-agent
systemd-cgtop                   systemd-hwdb                    systemd-path
root@elk150:/app/prometheus/node-exporter # systemctl start node_exporter.service