Python地图可视化库有大家熟知的pyecharts、plotly、folium,还有稍低调的bokeh、basemap、geopandas,也是地图可视化利器。
首先介绍下bokeh
bokeh擅长制作交互式图表,当然在地图展示方面也毫不逊色。
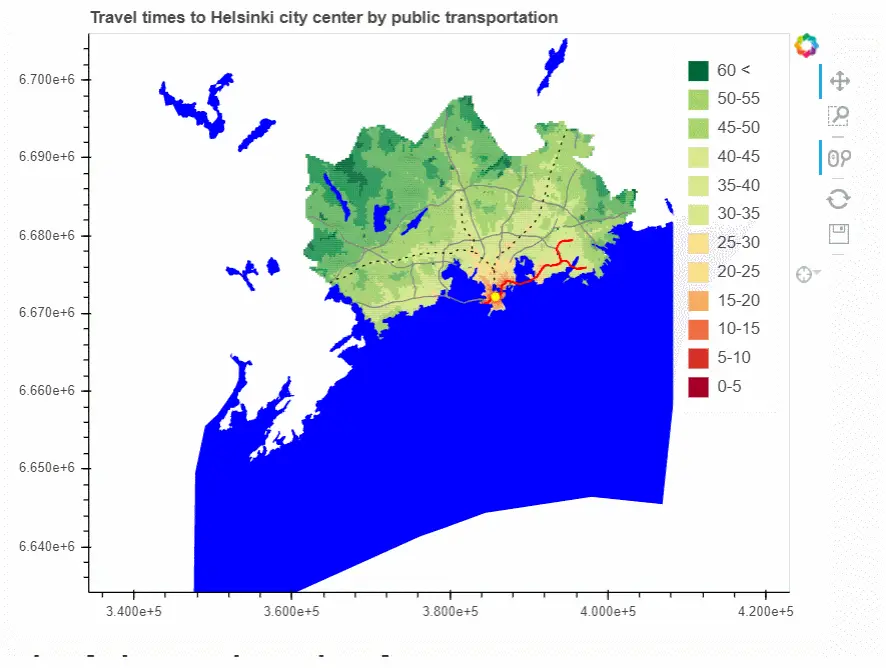
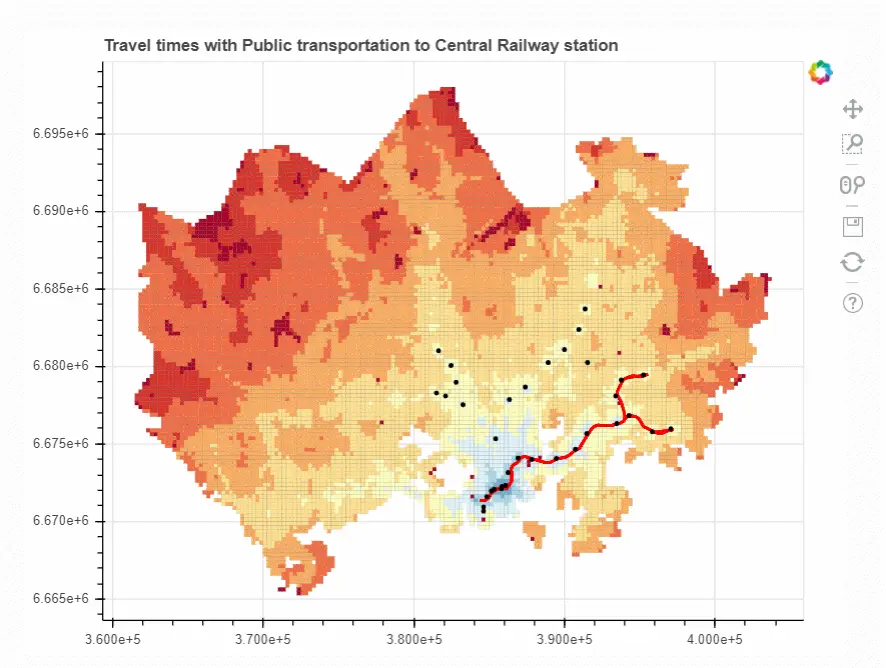
Bokeh支持google地图、geojson数据的地理可视化展示,关键是可以动态交互。
Bokeh官网提供了详细的地图可视化方案,感兴趣的把示例代码拉出来跑一跑。
basemap-专业地图可视化库
可以毫不夸张的说,basemap是python地图可视化最牛逼的第三方库,没有之一。
basemap基于matplotlib开发,所以它具有创建数据可视化的所有功能,必须配合matplotlib使用。
只需要几行代码就可以画一张世界地图:
python
from mpl_toolkits.basemap import Basemap
import matplotlib.pyplot as plt
map = Basemap()
map.drawcoastlines()
plt.show()
plt.savefig('test.png')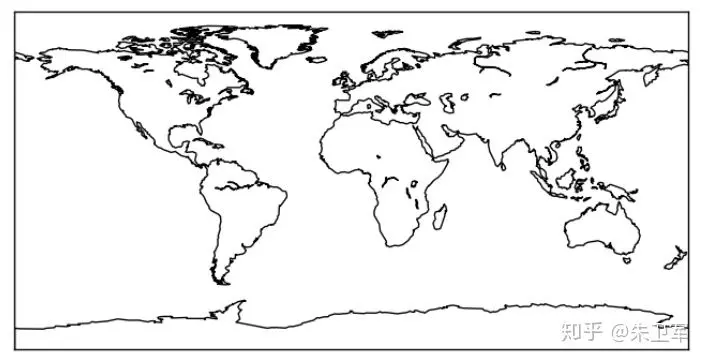
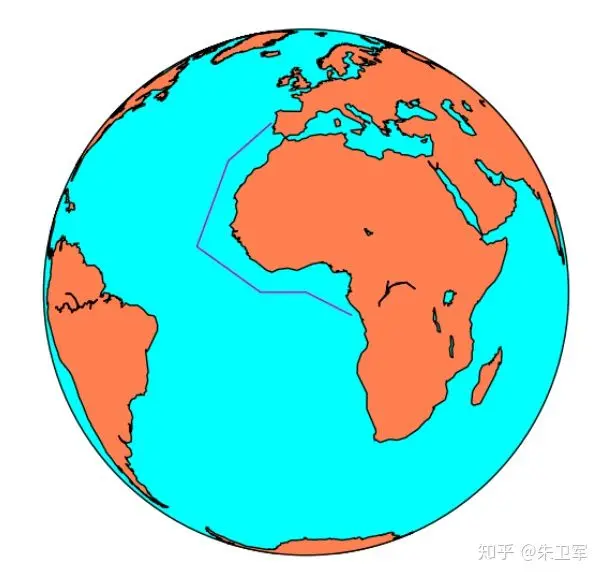
python
from mpl_toolkits.basemap import Basemap
import matplotlib.pyplot as plt
map = Basemap(projection='ortho',
              lat_0=0, lon_0=0)
#Fill the globe with a blue color
map.drawmapboundary(fill_color='aqua')
#Fill the continents with the land color
map.fillcontinents(color='coral',lake_color='aqua')
map.drawcoastlines()
plt.show()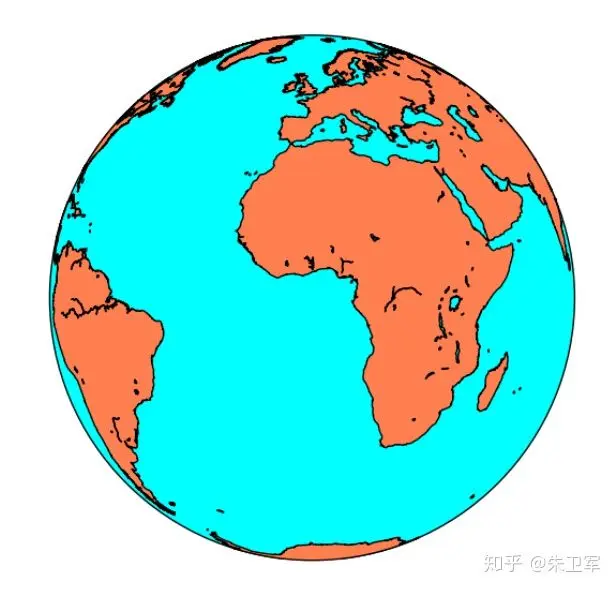
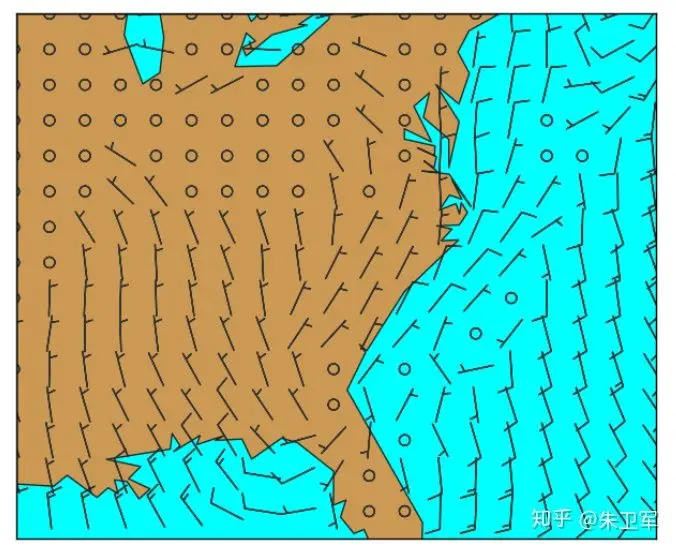
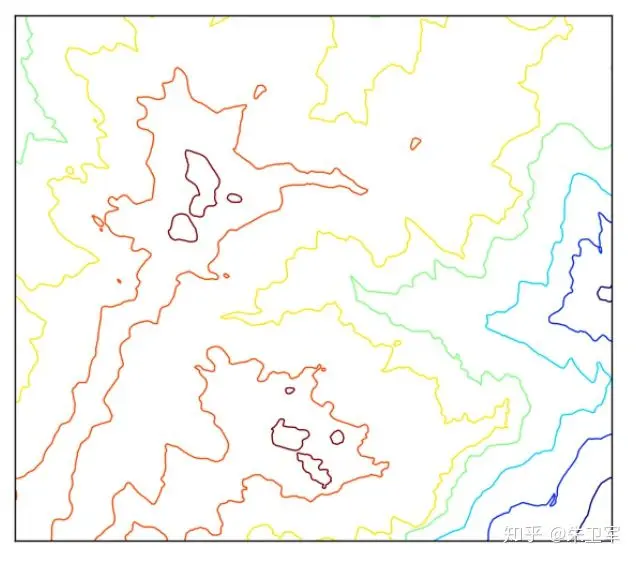
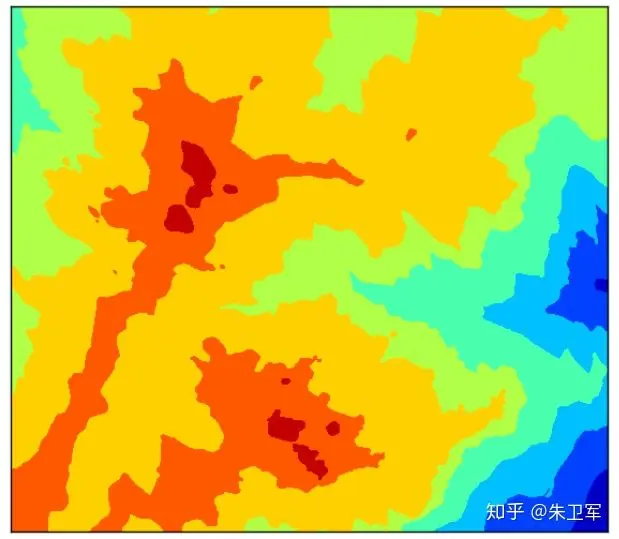
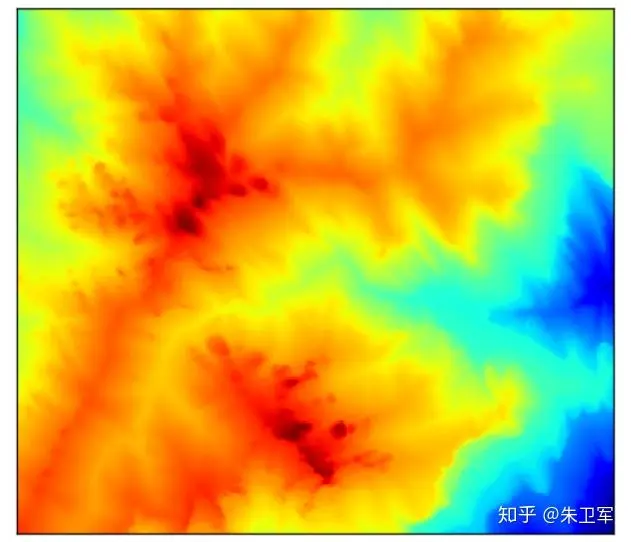
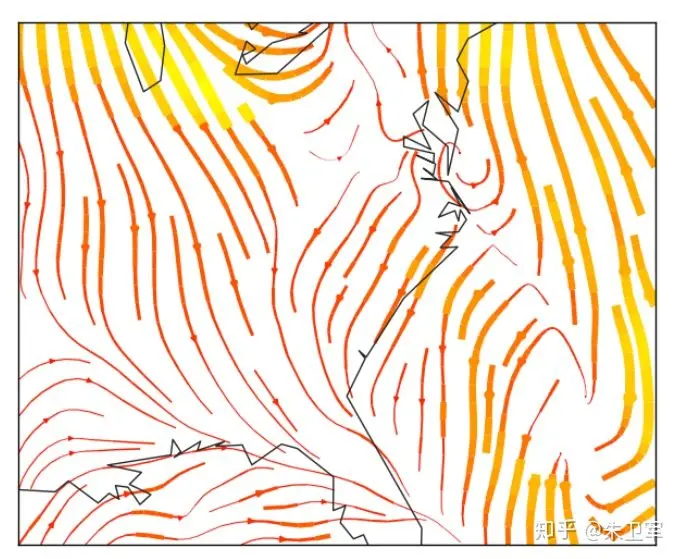
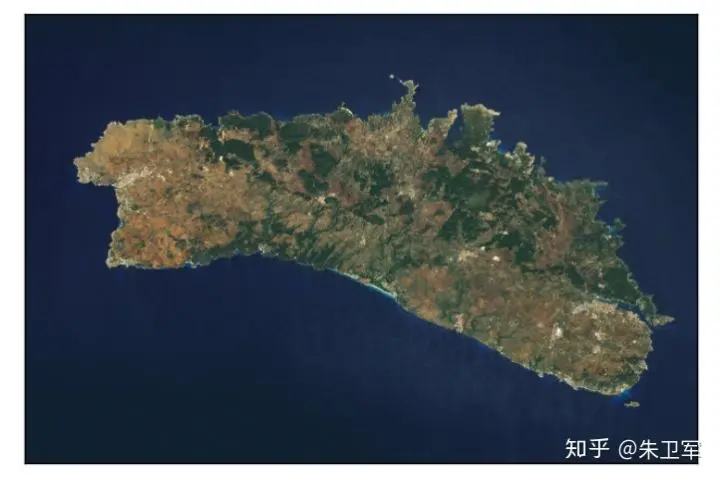
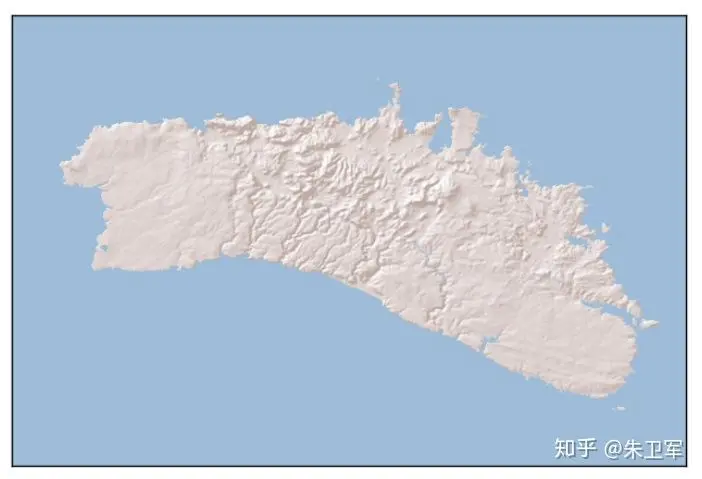
由于basemap无所不能的绘图能力,你还可以画:
风勾图
轮廓图
填充轮廓图
伪彩色图
地理标记图
矢量场流线图
实景地图
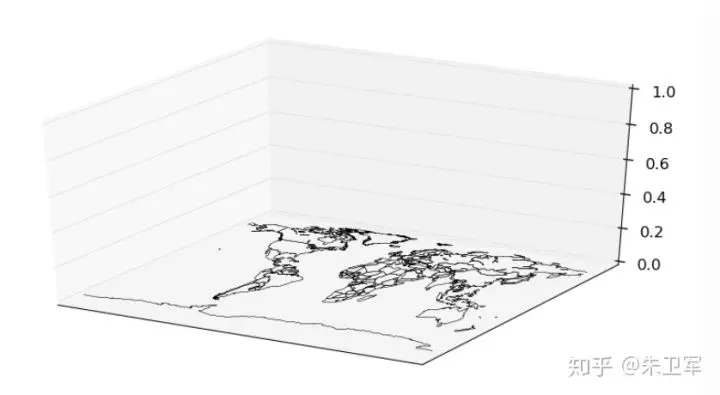
多子图地图
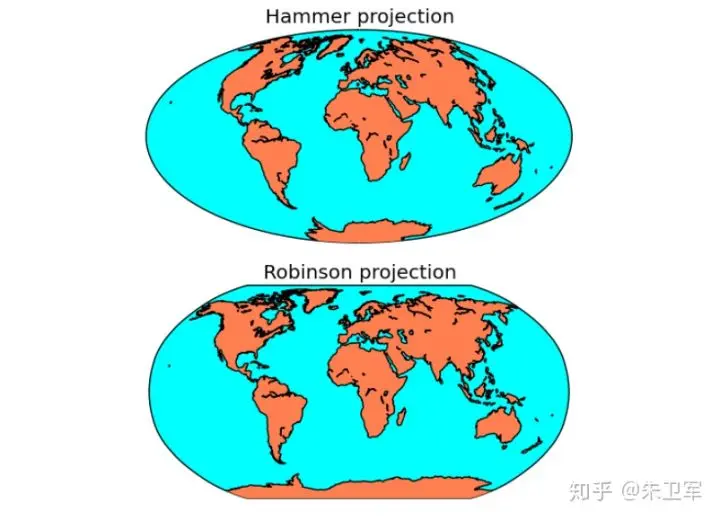
3D地图
最后说说geopandas
geopandas,顾名思义是基于pandas的地图可视化工具,所以它对地理数据的处理非常方便。
推荐大家将geopandas作为地理信息数据处理的主要工具。
配合使用matplotlib,很简单的代码就可以画出漂亮的地图: