本文为个人近期学习总结,若有错误之处,欢迎指出!
Echarts之折线图绘制
前言
在前文页面布局、DataV 的使用、Echarts 的基础使用的基础上,开始绘制大屏中的折线图。
1.需求
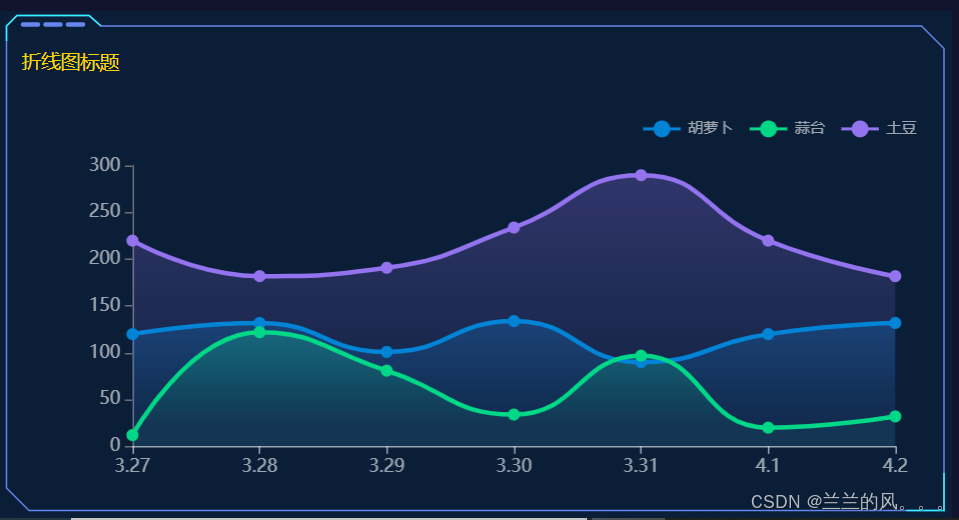
绘制近一周来三种蔬菜的销售量趋势图
2.实现效果

3.大概思路
为简化代码量,将折线图封装为组件:
(1)子组件绘制基本折线图,图中有四条折线,因此series里应有四个系列(type值为'line');
(2)父组件向子组件传递数据:
①标题:字符串格式;
②类似['3.27','3.28','3.29','3.30','3.31','4.1','4.2']这样的数组,作为子组件图表的横坐标值,即xAxis.data;
③类似['胡萝卜', '蒜台', '土豆', '豆角']这样的数组,作为子组件每一个系列的name值,即series[i].name。(说明具体是哪一种蔬菜);
④类似[[120, 132, 101, 134, 90, 120, 132],[...],[...]]这样的数组,作为子组件图表每一个系列的data值,即series[i].data。(说明③中具体蔬菜的销售量值)
4.代码实现
子组件写法
HTML
html
<template>
  <div class="block" style="height:100%;">
    <dv-border-box-13>
      <div class="title" style="height:20%;">
        {{ lineTitle }}
      </div>
      <div ref="lineArea" :style="{width: '100%',height: '80%'}" />
    </dv-border-box-13>
  </div>
</template>
javascript
<script>
export default {
  // 子组件接收的四个数据
  props: {
    lineTitle: {
      type: String,
      default: ''
    },
    linex: {
      type: Array,
      default: () => []
    },
    liney: {
      type: Array,
      default: () => []
    },
    types: {
      type: Array,
      default: () => []
    }
  },
  // eslint-disable-next-line max-lines-per-function
  data () {
    return {
      option: {
        tooltip: { // 悬浮框
          trigger: 'axis', // 坐标轴触发
          backgroundColor: 'rgba(83,164,230,.6)',
          borderColor: 'rgba(83,164,230,1)', // 边框颜色
          textStyle: {// 设置文字样式
            color: 'rgba(255,255,255,1)',
            fontSize: 10
          }
        },
        legend: {// 图例
          top: '0%',
          right: '3%', // 图例组件离容器右侧的距离
          textStyle: { // 图例文字的样式
            color: 'rgba(255, 255, 255, .6)',
            fontSize: 10
          }
        },
        grid: { // 直角坐标系绘图网格
          left: '14%',
          bottom: '18%',
          top: '13%',
          right: '6%',
          containLabel: false // grid区域是否包含刻度标签
        },
        xAxis: [
          {
            type: 'category',
            boundaryGap: false,
            axisLabel: {
              color: 'rgba(255, 255, 255, .6)'
            },
            axisTick: {
              show: 'true'
            },
            axisLine: {
              lineStyle: {
                color: 'rgba(255, 255, 255, .6)'
              }
            }

            // data: ['周一', '周二', '周三', '周四', '周五', '周六', '周日']
          }
        ],
        yAxis: [
          {
            type: 'value',
            axisLabel: {
              color: 'rgba(255, 255, 255, 0.6)'
            },
            axisLine: {
              show: true
            },
            axisTick: {
              show: true
            },
            splitLine: {
              show: false
            }
          }
        ],
        // eslint-disable-next-line no-sparse-arrays
        series: [
          {

            // name: '入网量',
            type: 'line',
            smooth: true,
            lineStyle: {// 单独修改线的样式
              color: '#0184d5',
              width: 3
            },
            areaStyle: {

              // 渐变色,只需要复制即可
              color: new this.$echarts.graphic.LinearGradient(
                0, 0, 0, 1,
                [
                  { offset: 0, color: 'rgba(1, 132, 213, 0.4)' }, // 渐变色的起始颜色
                  { offset: 0.8, color: 'rgba(1, 132, 213, 0.1)' } // 渐变线的结束颜色
                ],
                false
              ),
              shadowColor: 'rgba(0, 0, 0, 0.1)' // 图形阴影的模糊大小
            },
            symbol: 'circle',// 设置拐点 小圆点
            symbolSize: 8,// 拐点大小
            itemStyle: {// 设置拐点颜色以及边框
              color: '#0184d5'
            },
            showSymbol: true,// 开始显示拐点, 鼠标经过显示
            emphasis: {
              focus: 'series'
            }

            // data: [120, 132, 101, 134, 90, 230, 210]
          }
          //这里其它两个系列的配置代码与第一个对象元素相似,为节省篇幅,故省略
        ]
      }
    }
  },
  mounted () {
    //这块的赋值操作本应该是:监测liney的变化赋值才赋值,再绘制
    //详细内容请参考柱图绘制,这里不再详述
    this.option.xAxis[0].data = this.linex

    this.option.series[0].data = this.liney[0]
    this.option.series[1].data = this.liney[1]
    this.option.series[2].data = this.liney[2]

    this.option.series[0].name = this.types[0]
    this.option.series[1].name = this.types[1]
    this.option.series[2].name = this.types[2]
    this.drawLine()
  },
  methods: {
    drawLine () {
      let myLine = this.$echarts.init(this.$refs.lineArea)
      myLine.setOption(this.option, true)
      window.addEventListener('resize', () => {
        myLine.resize()
      })
    }
  }
}
</script>
CSS与前文"柱图绘制"相同,故这里省略。
父组件写法
HTML
html
<lines-chart :line-title="lineTitle" :liney="lineYvalue" :linex="lineXvalue" :types="types" />Javascript
引入组件和注册组件的部分代码与前文"柱图绘制"相似,这里写关键代码:
javascript
data(){
  return {
    lineTitle: '折线图标题',
    lineXvalue: ['3.27', '3.28', '3.29', '3.30', '3.31', '4.1', '4.2'],
    lineYvalue: [[120, 132, 101, 134, 90, 120, 132], [12, 122, 81, 34, 97, 20, 32], [220, 182, 191, 234, 290, 220, 182]],
    types: ['胡萝卜', '蒜台', '土豆', '豆角']
  }
}