|-----------------------------------------------------------------------------------------------------------------------------------------------------------------------------------------------------------------------------|
| > ##### 天气预报我们每天都会关注,我们可以根据未来的天气增减衣物、安排出行,每天的气温、风速风向、相对湿度、空气质量等成为关注的焦点。本次使用python中requests和BeautifulSoup库对中国天气网当天和未来14天的数据进行爬取,保存为csv文件,之后用matplotlib、numpy、pandas对数据进行可视化处理和分析,得到温湿度度变化曲线、空气质量图、风向雷达图等结果,为获得未来天气信息提供了有效方法。 |
数据采集逻辑
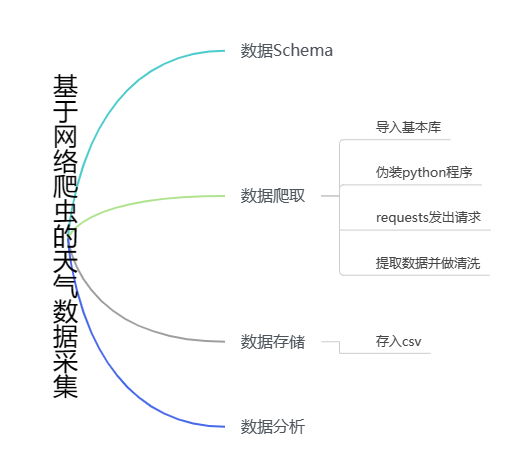
数据schema
历史天气数据schema
{
'当日信息':'2023-01-01 星期日',
'最高气温': 8℃'',
'最低气温': '5℃',
'天气': '多云',
'风向信息':'北风 3级'
}
数据爬取
1.导入库
python
import numpy as np
import pandas as pd
import requests
from bs4 import BeautifulSoup
from matplotlib import pyplot as plt
from pandas import Series, DataFrame
2.对程序进行伪装
python
headers = {
    'Host': 'lishi.tianqi.com',
    'user-agent': 'Mozilla/5.0 (Windows NT 10.0; Win64; x64) AppleWebKit/537.36 (KHTML, like Gecko) Chrome/110.0.0.0 Safari/537.36 Edg/110.0.1587.63'
}
3.抓取天气数据
python
url = 'https://lishi.tianqi.com/shanghai/202301.html'  # 上海 2023年1月天气
res = requests.get(url, headers=headers)

res.encodind = 'utf-8'
html = BeautifulSoup(res.text, 'html.parser')
data_all = []
tian_three = html.find("div", {"class": "tian_three"})
lishi = tian_three.find_all("li")
for i in lishi:
    lishi_div = i.find_all("div")
    data = []
    for j in lishi_div:
        data.append(j.text)
    data_all.append(data)
print(data_all)
4.数据存储
在数据存储前,对数据进行处理,便于后期的数据分析。将上面的"当天信息"字段拆分为"日期"和"星期"两个字段,"风向信息"也是如此。最后,将数据保存为csv文件中。
python
weather = pd.DataFrame(data_all)
weather.columns = ["当日信息", "最高气温", "最低气温", "天气", "风向信息"]
weather_shape = weather.shape
print(weather)
weather['当日信息'].apply(str)
result = DataFrame(weather['当日信息'].apply(lambda x: Series(str(x).split(' '))))
result = result.loc[:, 0:1]
result.columns = ['日期', '星期']
weather['风向信息'].apply(str)
result1 = DataFrame(weather['风向信息'].apply(lambda x: Series(str(x).split(' '))))
result1 = result1.loc[:, 0:1]
result1.columns = ['风向', '级数']
weather = weather.drop(columns='当日信息')
weather = weather.drop(columns='风向信息')
weather.insert(loc=0, column='日期', value=result['日期'])
weather.insert(loc=1, column='星期', value=result['星期'])
weather.insert(loc=5, column='风向', value=result1['风向'])
weather.insert(loc=6, column='级数', value=result1['级数'])
weather.to_csv("上海23年1月天气.csv", encoding="utf_8")
5.数据分析
注:数据分析用的是北京2023年1月的天气数据,如下图:

1.2023北京1月天气情况
python
# 数据处理
plt.rcParams['font.sans-serif'] = ['SimHei']
plt.rcParams['axes.unicode_minus'] = False


weather['最高气温'] = weather['最高气温'].map(lambda x: int(x.replace('℃', '')))
weather['最低气温'] = weather['最低气温'].map(lambda x: int(x.replace('℃', '')))

dates = weather['日期']
highs = weather['最高气温']
lows = weather['最低气温']

# 画图

fig = plt.figure(dpi=128, figsize=(10, 6))

plt.plot(dates, highs, c='red', alpha=0.5)
plt.plot(dates, lows, c='blue', alpha=0.5)

plt.fill_between(dates, highs, lows, facecolor='blue', alpha=0.2)
# 图表格式
# 设置图标的图形格式
plt.title('2023北京1月天气情况', fontsize=24)
plt.xlabel('', fontsize=6)
fig.autofmt_xdate()
plt.ylabel('气温', fontsize=12)
plt.tick_params(axis='both', which='major', labelsize=10)
# 修改刻度
plt.xticks(dates[::5])
# 显示
plt.show()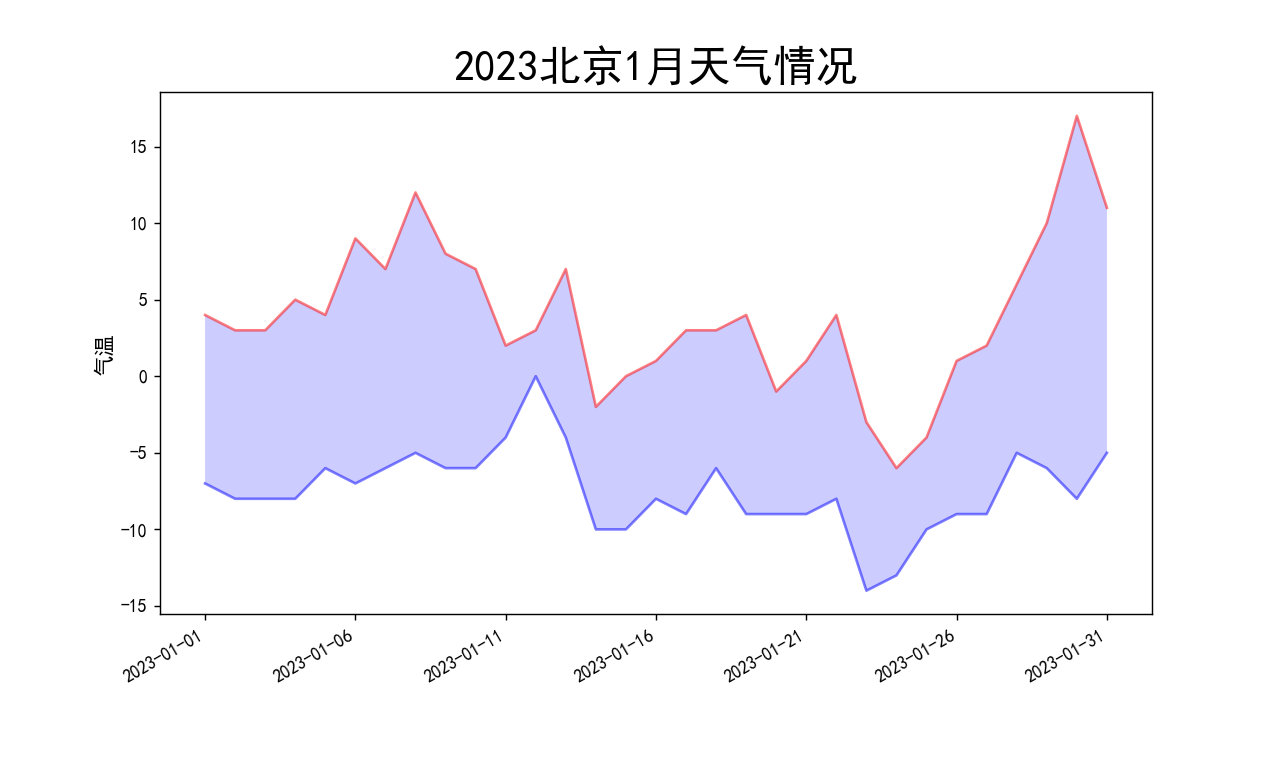
2.北京23年1月天气候分布饼图
2023年一月份有31天,循环遍历时注意循环次数。
python
# 天气可视化饼图
weather = list(weather['天气'])
dic_wea = {}
for i in range(0, 31):
    if weather[i] in dic_wea.keys():
        dic_wea[weather[i]] += 1
    else:
        dic_wea[weather[i]] = 1
print(dic_wea)
explode = [0.01] * len(dic_wea.keys())
color = ['lightskyblue', 'silver', 'yellow', 'salmon', 'grey', 'lime', 'gold', 'red', 'green', 'pink']
plt.pie(dic_wea.values(), explode=explode, labels=dic_wea.keys(), autopct='%1.1f%%', colors=color)
plt.title('北京23年1月天气候分布饼图')
plt.show()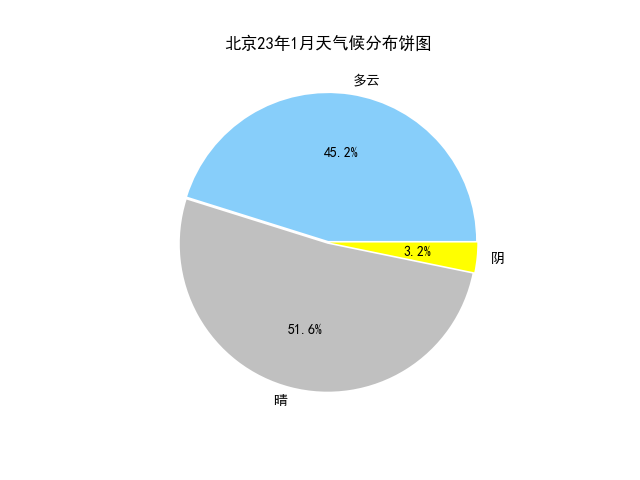
3.风级图
自定义change_wind函数,将风向信息转换为数值,并计算出各风向的风速平均值。
python
def change_wind(wind):
    """改变风向"""
    for i in range(0, 31):
        if wind[i] == "北风":
            wind[i] = 90
        elif wind[i] == "南风":
            wind[i] = 270
        elif wind[i] == "西风":
            wind[i] = 180
        elif wind[i] == "东风":
            wind[i] = 360
        elif wind[i] == "东北风":
            wind[i] = 45
        elif wind[i] == "西北风":
            wind[i] = 135
        elif wind[i] == "西南风":
            wind[i] = 225
        elif wind[i] == "东南风":
            wind[i] = 315
    return wind


# 风向雷达图
wind = list(weather['风向'])
weather['级数'] = weather['级数'].map(lambda x: int(x.replace('级', '')))
# weather['级数']=pd.to_numeric(weather['级数'])
wind_speed = list(weather['级数'])
wind = change_wind(wind)


degs = np.arange(45, 361, 45)
temp = []
for deg in degs:
    speed = []
    # 获取 wind_deg 在指定范围的风速平均值数据
    for i in range(0, 31):
        if wind[i] == deg:
            speed.append(wind_speed[i])
    if len(speed) == 0:
        temp.append(0)
    else:
        temp.append(sum(speed) / len(speed))
print(temp)
N = 8
theta = np.arange(0. + np.pi / 8, 2 * np.pi + np.pi / 8, 2 * np.pi / 8)
# 数据极径
radii = np.array(temp)
# 绘制极区图坐标系
plt.axes(polar=True)
# 定义每个扇区的RGB值(R,G,B),x越大,对应的颜色越接近蓝色
colors = [(1 - x / max(temp), 1 - x / max(temp), 0.6) for x in radii]
plt.bar(theta, radii, width=(2 * np.pi / N), bottom=0.0, color=colors)
plt.title('风级图', x=0.2, fontsize=20)
plt.show()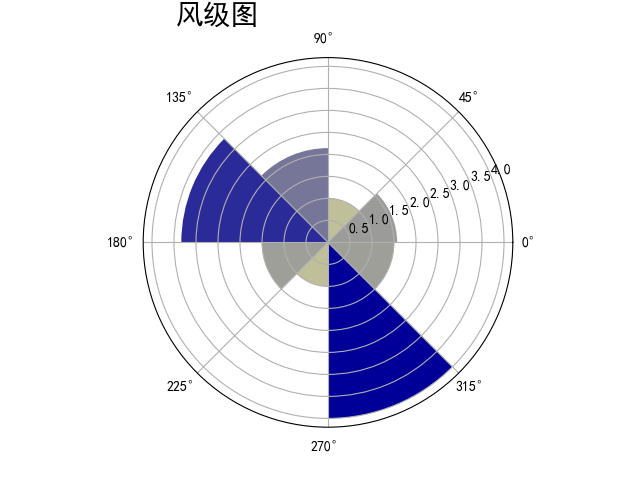
最后小编也给大家分享一份Python学习压缩包,里面的内容都是适合零基础小白的笔记,不懂编程也能听懂、看懂。【如果需要的话戳这里】
全套Python学习资料分享:
一、Python所有方向的学习路线
Python所有方向路线就是把Python常用的技术点做整理,形成各个领域的知识点汇总,它的用处就在于,你可以按照上面的知识点去找对应的学习资源,保证自己学得较为全面。


二、学习软件
工欲善其事必先利其器。学习Python常用的开发软件都在这里了,还有环境配置的教程,给大家节省了很多时间。

三、全套PDF电子书
书籍的好处就在于权威和体系健全,刚开始学习的时候你可以只看视频或者听某个人讲课,但等你学完之后,你觉得你掌握了,这时候建议还是得去看一下书籍,看权威技术书籍也是每个程序员必经之路。

四、入门学习视频全套
我们在看视频学习的时候,不能光动眼动脑不动手,比较科学的学习方法是在理解之后运用它们,这时候练手项目就很适合了。


五、实战案例
光学理论是没用的,要学会跟着一起敲,要动手实操,才能将自己的所学运用到实际当中去,这时候可以搞点实战案例来学习。

