文章目录
- 诊断
-
- 内存快照
- 案例实战
- 在线定位问题
-
- 诊断问题有两种方法
- 安装Jmeter插件查看接口响应信息
- 定位内存大的对象创建位置
-
- [Arthas stack命令](#Arthas stack命令)
- btrace在线定位
- 文章说明
诊断
通过分析工具,诊断问题的产生原因,定位到出现问题的源代码
内存快照
- 当堆内存溢出时,需要在堆内存溢出时将整个堆内存保存下来,生成内存快照(Heap Profile )文件。
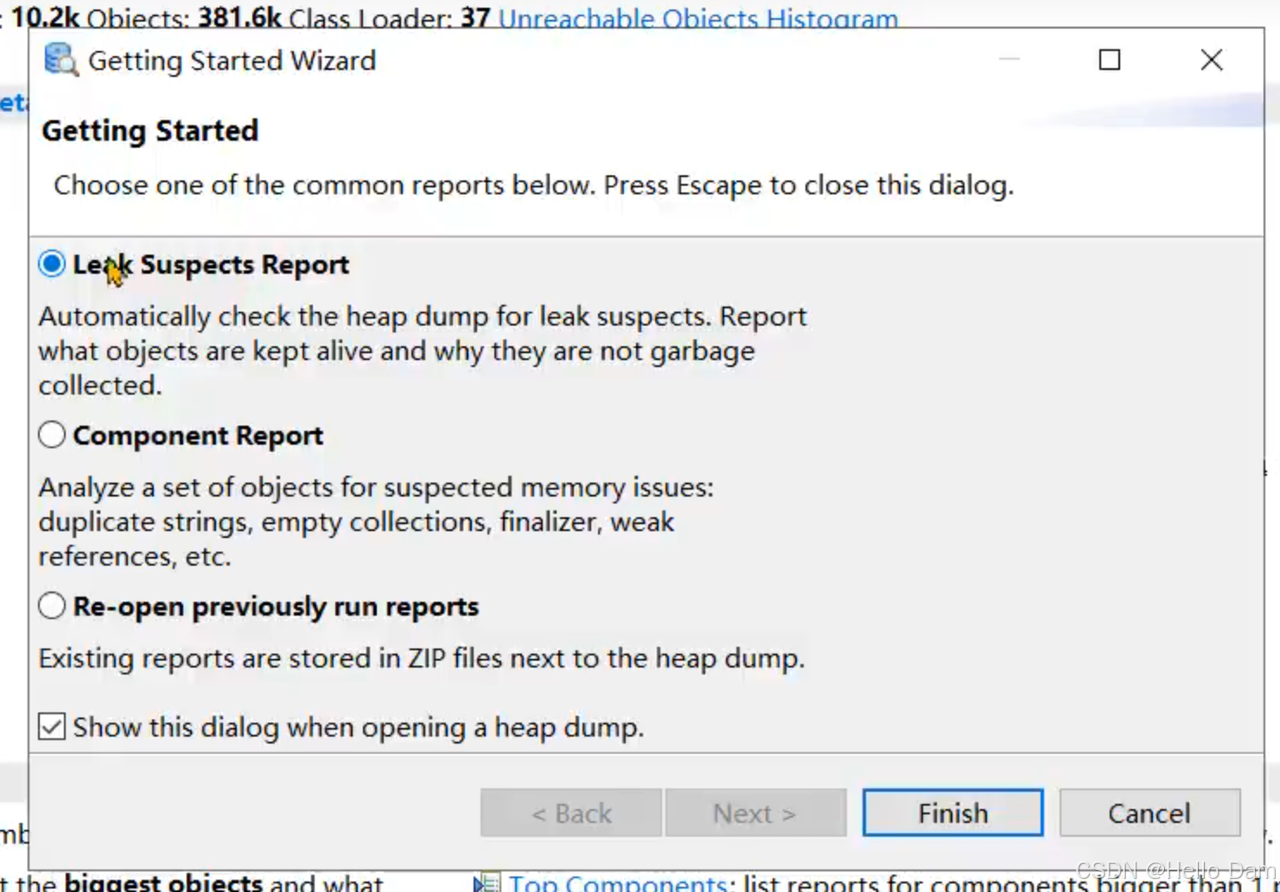
- 使用MAT打开hprof文件,并选择内存泄漏检测功能,MAT会自行根据内存快照中保存的数据分析内存泄漏的根源,最后推测出几个嫌疑对象。
在内存溢出时生成内存快照
如何生成内存快照,很简单,启动程序的时候添加Java虚拟机参数:
-XX:+HeapDumpOnOutOfMemoryError:发生OutOfMemoryError错误时,自动生成hprof内存快照文件。-XX:HeapDumpPath=<path>:指定hprof文件的输出路径。
使用MAT打开hprof文件,并选择内存泄漏检测功能,MAT会自行根据内存快照中保存的数据分析内存泄漏的根源。
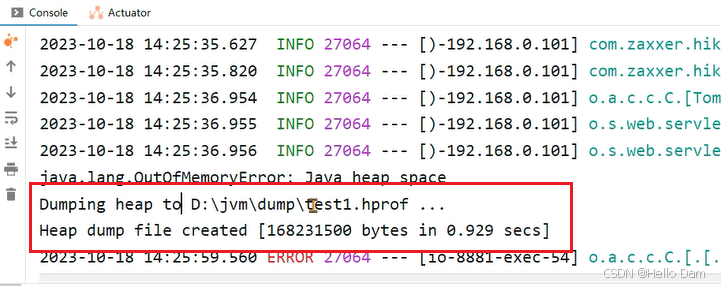
在程序中添加jvm参数(最大内存可以设置小一点,更快排查出问题):
java
-Xmx256m -Xms256m -XX:+HeapDumpOnOutOfMemoryError -XX:HeapDumpPath=D:\jvm\dump\test1.hprof运行程序之后,使用JMeter来进行压力测试:
MAT分析内存快照
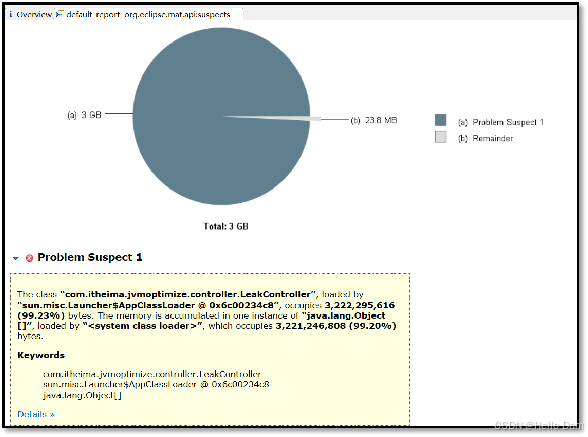
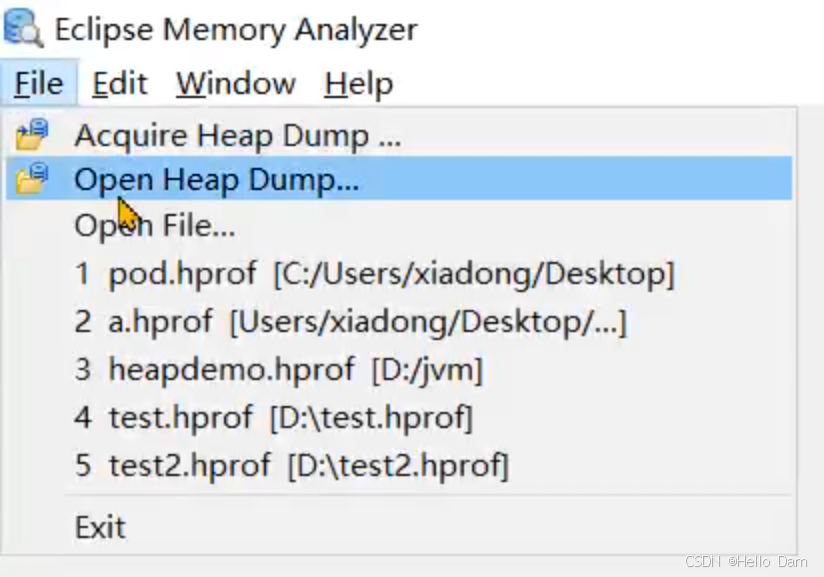
使用MAT打开hprof文件(操作步骤见前文GC Root小节),首页就展示了MAT检测出来的内存泄漏问题原因。
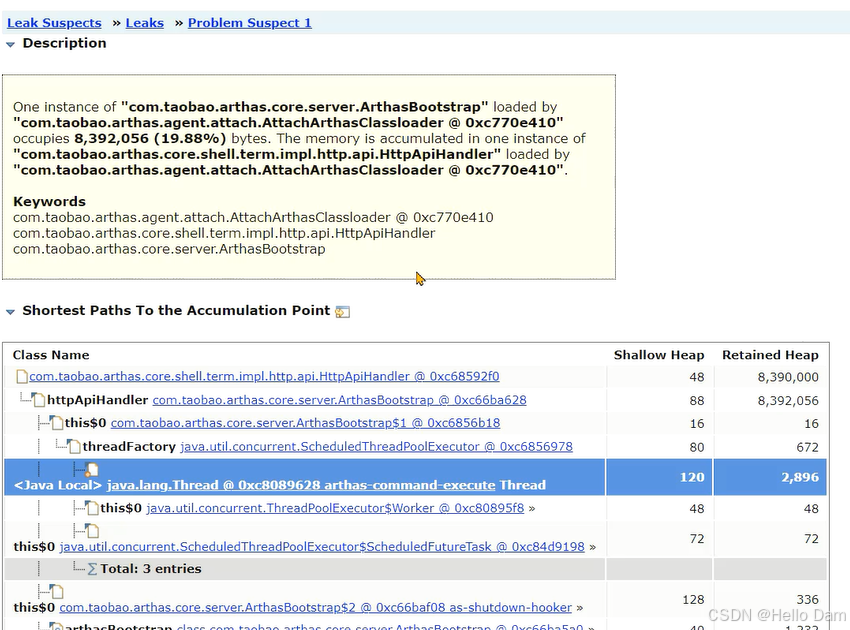
生成的内存泄漏检测报告如下
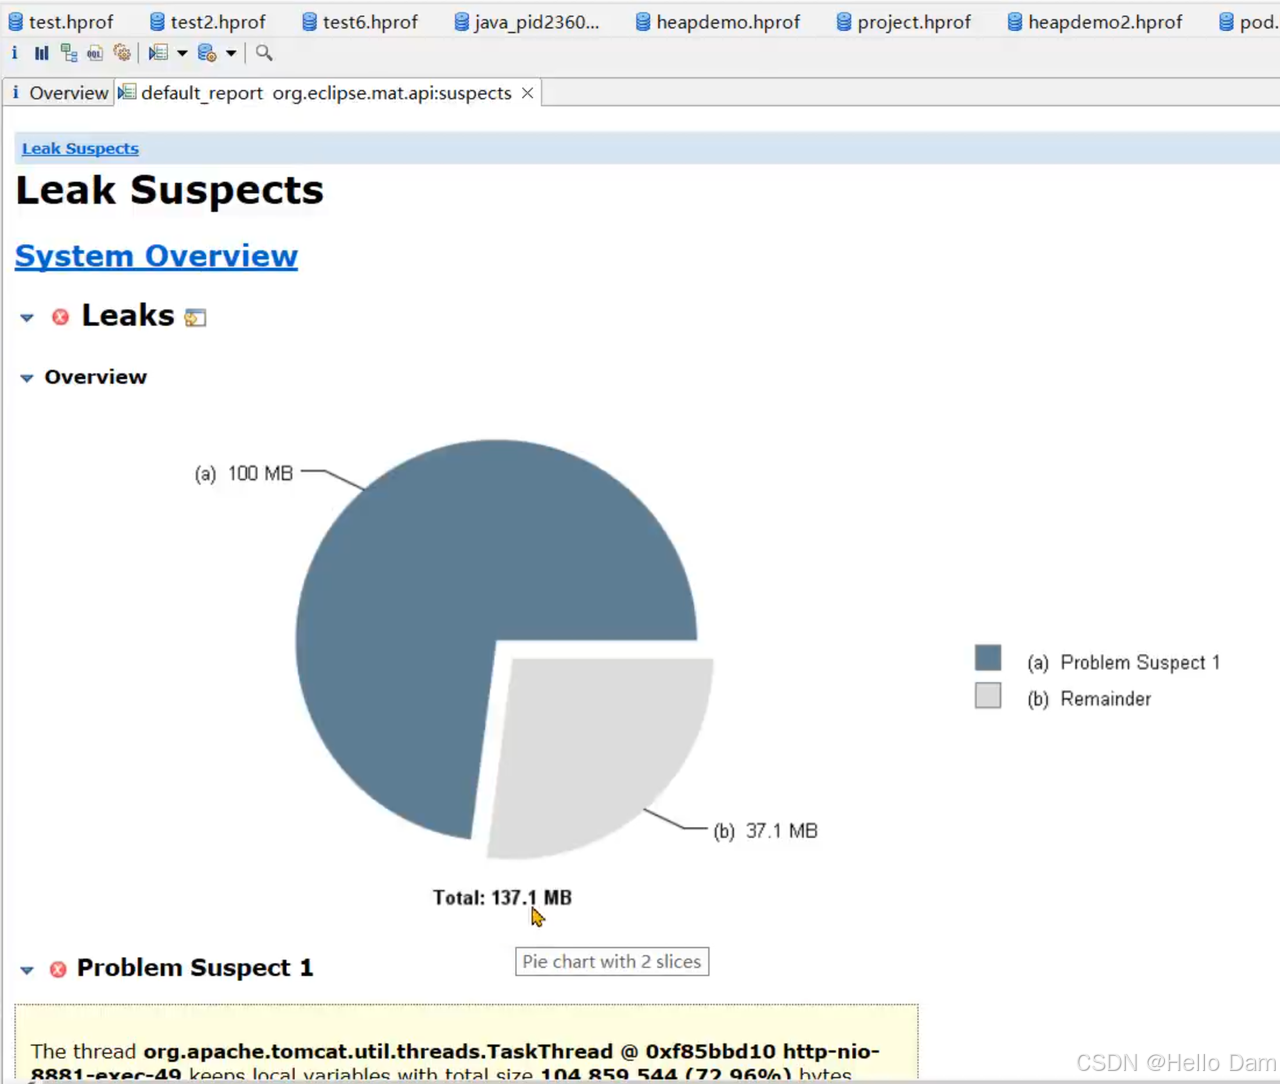
- a代表怀疑对象
- b表示其他对象
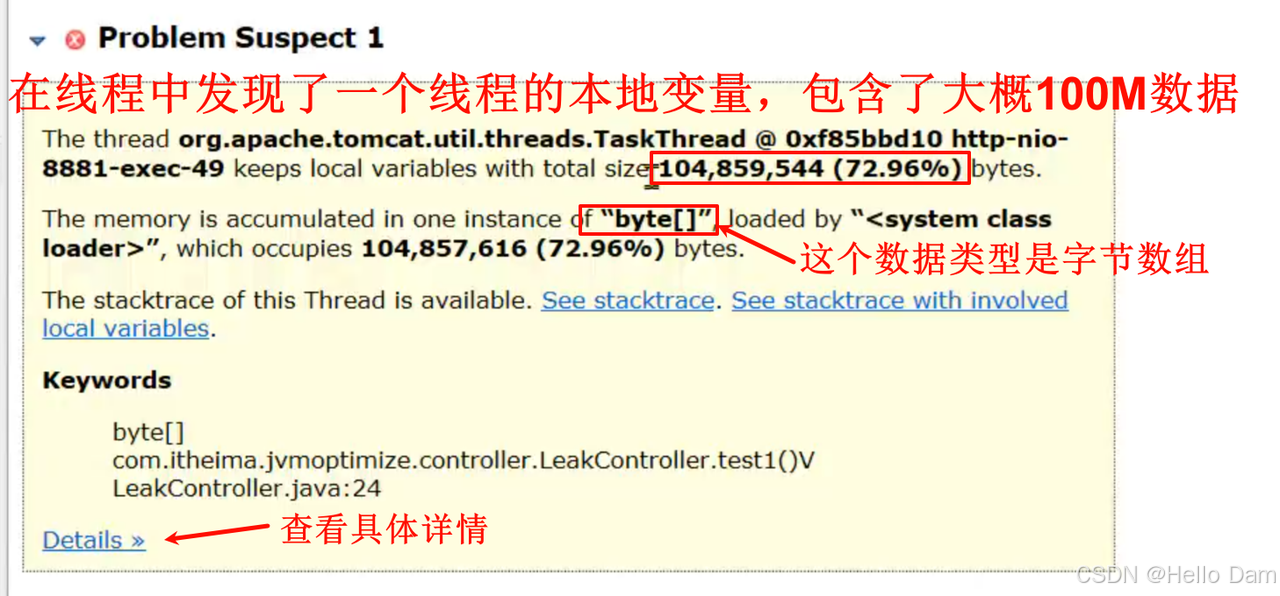
Keywords中也可以查看一些关键信息来判断内存溢出的原因
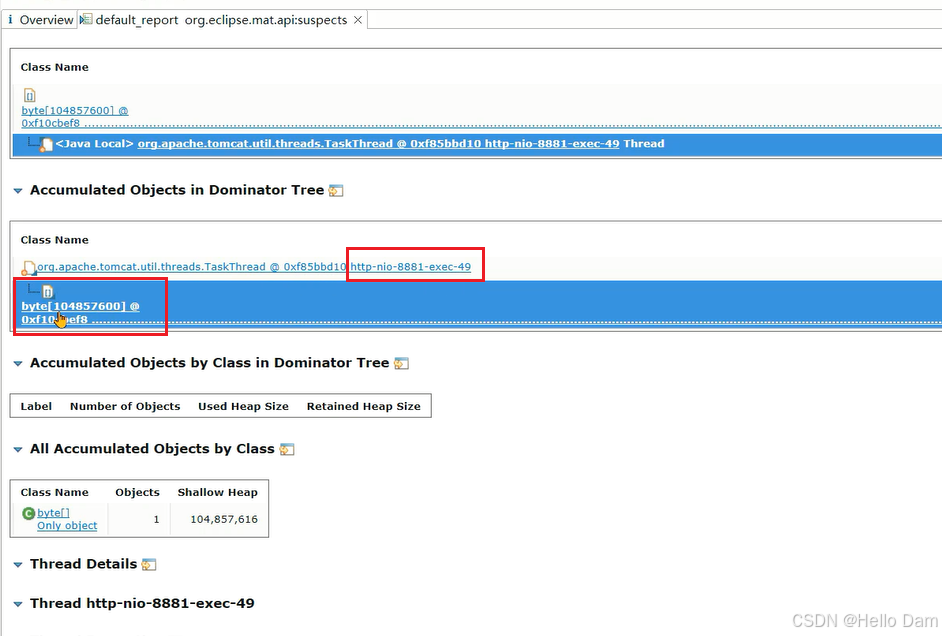
点击Details查看详情,这个线程持有了大量的字节数组:
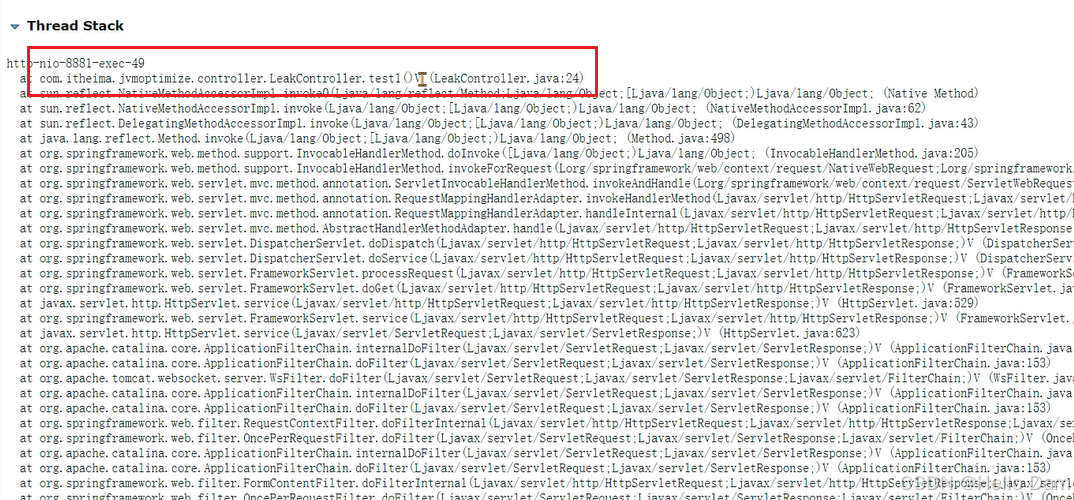
继续往下来,还可以看到溢出时线程栈,通过栈信息也可以怀疑下是否是因为这句代码创建了大量的对象:
MAT内存泄漏检测的原理
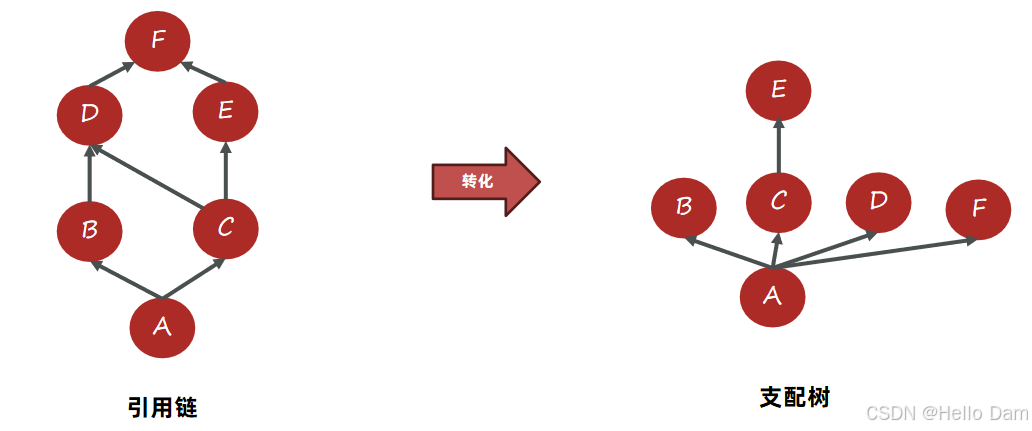
直接通过GC Root检测内存是否泄漏比较复杂,MAT将引用链转化为支配树结构之后,再进行分析。
支配树介绍
支配树定义:支配树展示的是对象实例间的支配关系。
如下图,A引用B、C;B、C引用D;C引用E;D、E引用F。
- 通往对象B的路径都经过对象A,都要经过A才能到B,则认为对象A支配对象B。C也同理;
- 由于E只有C引用,所以C支配E;
- B和C都引用D,即B和C都无法支配D,只能继续往上层找,最终找到A,因为所有路径都由A出发。F也同理;
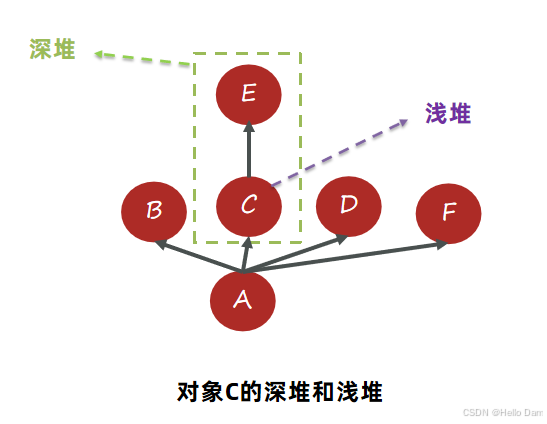
支配树中堆的划分
- 支配树中对象本身占用的空间称之为浅堆(Shallow Heap)
- 支配树中对象的子树就是所有被该对象支配的内容,这些内容(当前对象以及子树)组成了对象的深堆(Retained Heap) ,也称之为保留集(Retained Set)。A的深堆即整棵树。深堆的大小表示该对象如果可以被回收,能释放多大的内存空间
- 如下图:C自身包含一个浅堆,而C底下挂了E,所以C+E占用的空间大小代表C的深堆
- MAT根据支配树和深堆的大小,快速发现是哪些对象造成了内存泄漏(优先检查深堆内存比较大的)
如何在不内存溢出情况下生成堆内存快照?
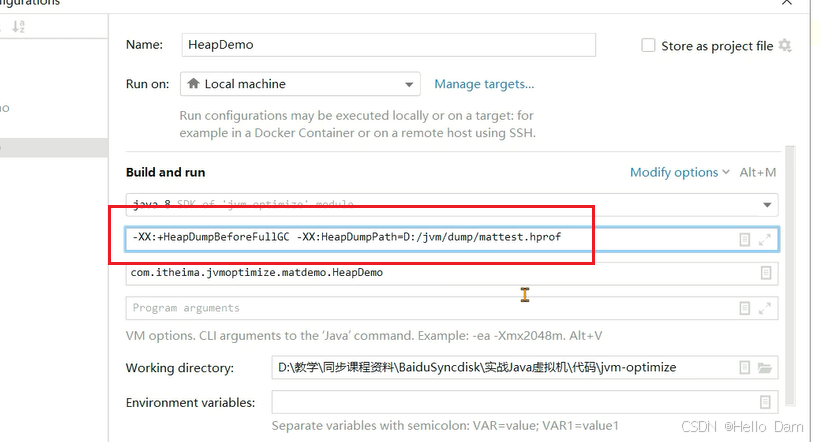
-XX:+HeapDumpBeforeFullGC可以在FullGC之前就生成内存快照
MAT查看支配树
**需求:**使用如下代码生成内存快照,并分析TestClass对象的深堆和浅堆
java
package com.itheima.jvmoptimize.matdemo;

import org.openjdk.jol.info.ClassLayout;

import java.util.ArrayList;
import java.util.List;

//-XX:+HeapDumpBeforeFullGC -XX:HeapDumpPath=D:/jvm/dump/mattest.hprof
public class HeapDemo {
    public static void main(String[] args) {
        TestClass a1 = new TestClass();
        TestClass a2 = new TestClass();
        TestClass a3 = new TestClass();
        String s1 = "itheima1";
        String s2 = "itheima2";
        String s3 = "itheima3";

        a1.list.add(s1);

        a2.list.add(s1);
        a2.list.add(s2);

        a3.list.add(s3);

        //System.out.print(ClassLayout.parseClass(TestClass.class).toPrintable());
        s1 = null;
        s2 = null;
        s3 = null;
        System.gc();
    }
}

class TestClass {
    public List<String> list = new ArrayList<>(10);
}
上面代码的引用链如下:
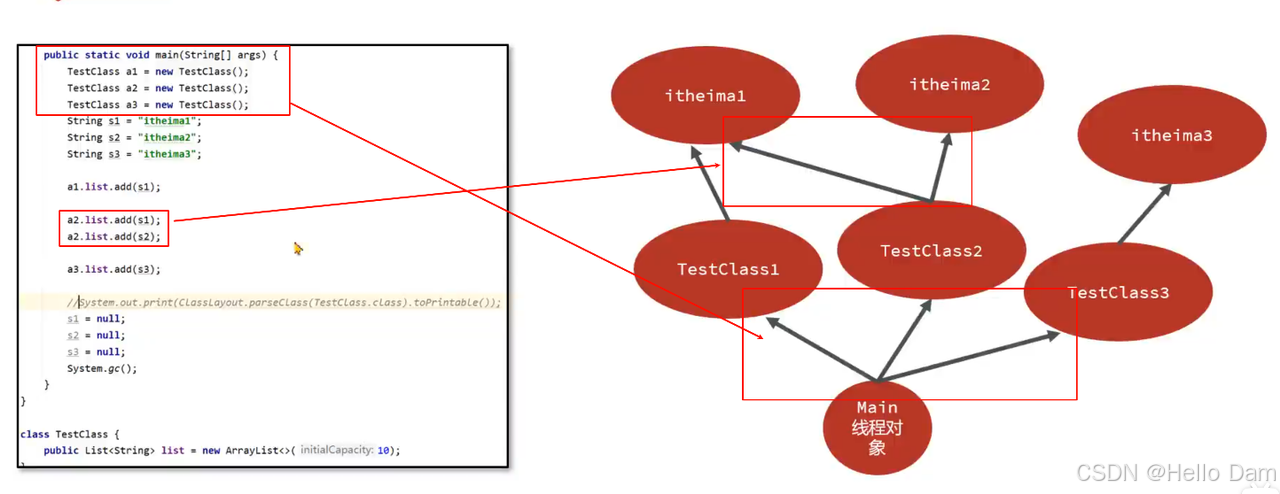
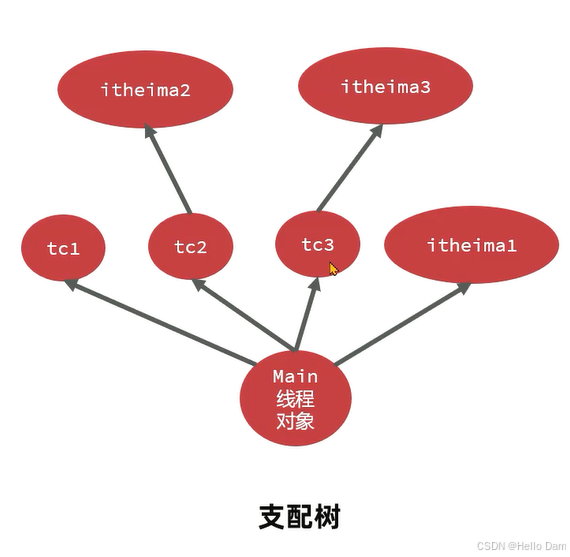
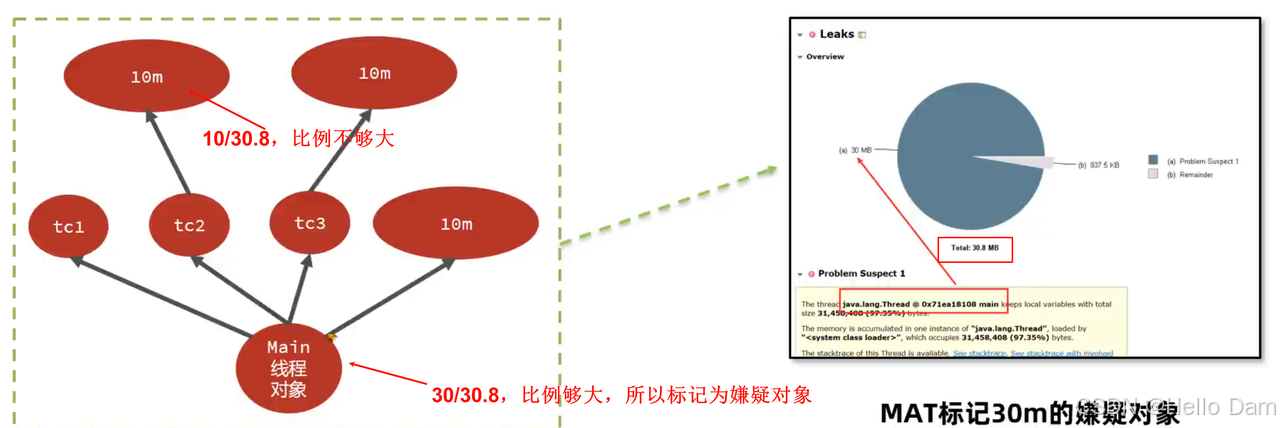
转换成支配树,TestClass简称为tc。
- tc1 tc2 tc3都是直接挂在main线程对象上;
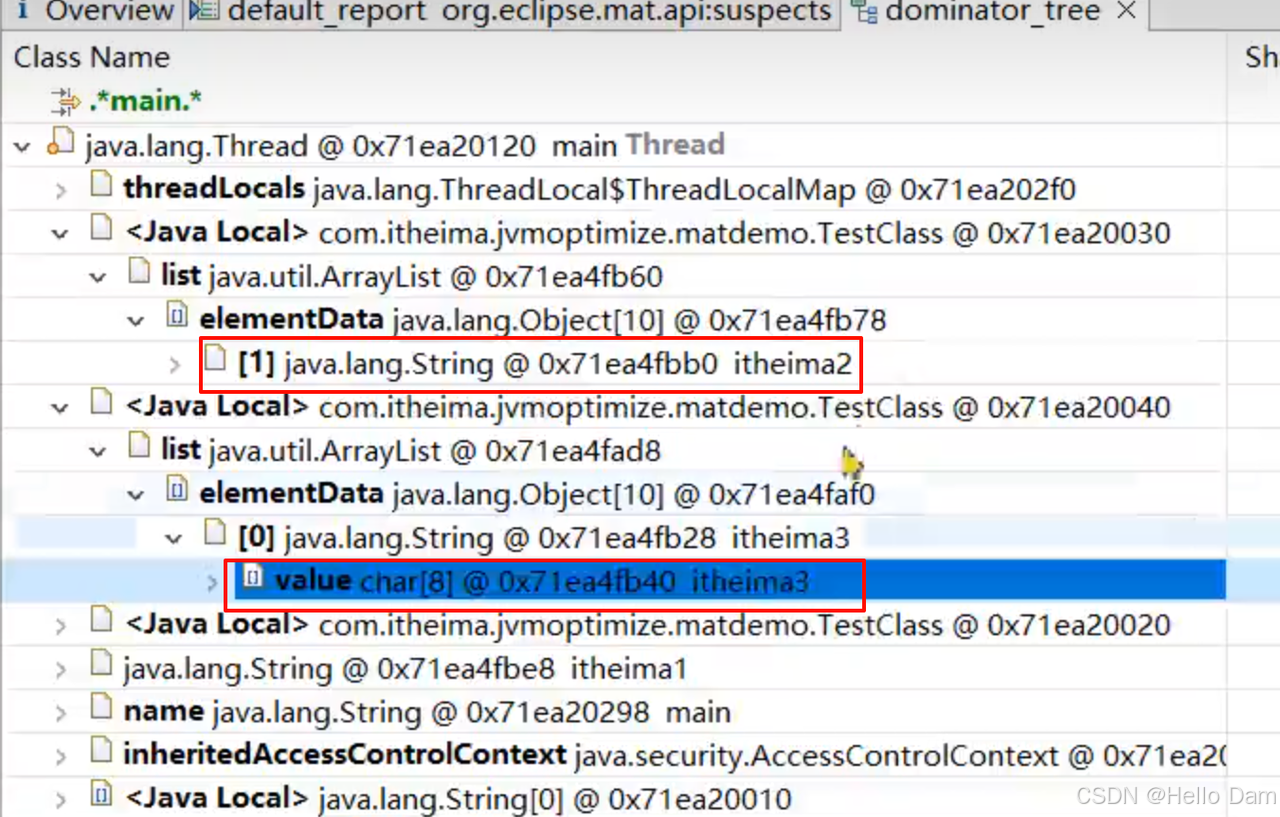
- itheima2 itheima3都只能通过tc2和tc3访问,所以直接挂上;
- itheima1不同,他可以由tc1 tc2访问,所以他要挂载tc1 tc2的上级也就是main线程对象上:
使用mat来分析,添加虚拟机参数:
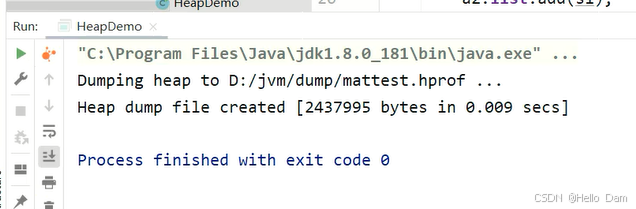
在FullGC之后产生了内存快照文件:
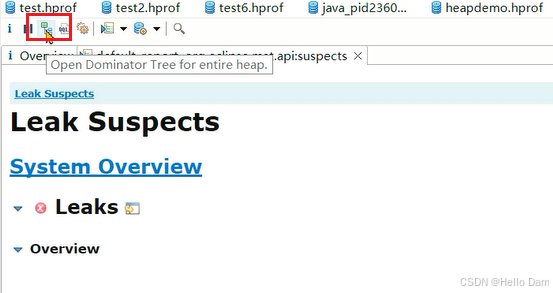
直接查看MAT的支配树功能:
输入main进行搜索:
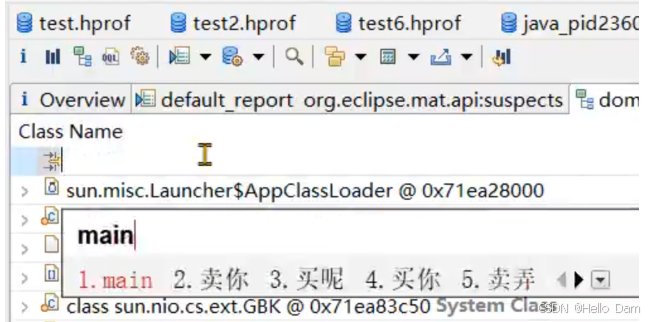
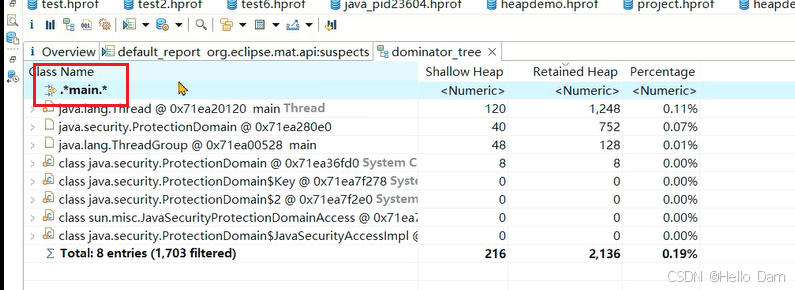
可以看到结构与之前分析的是一致的:
- 第一层
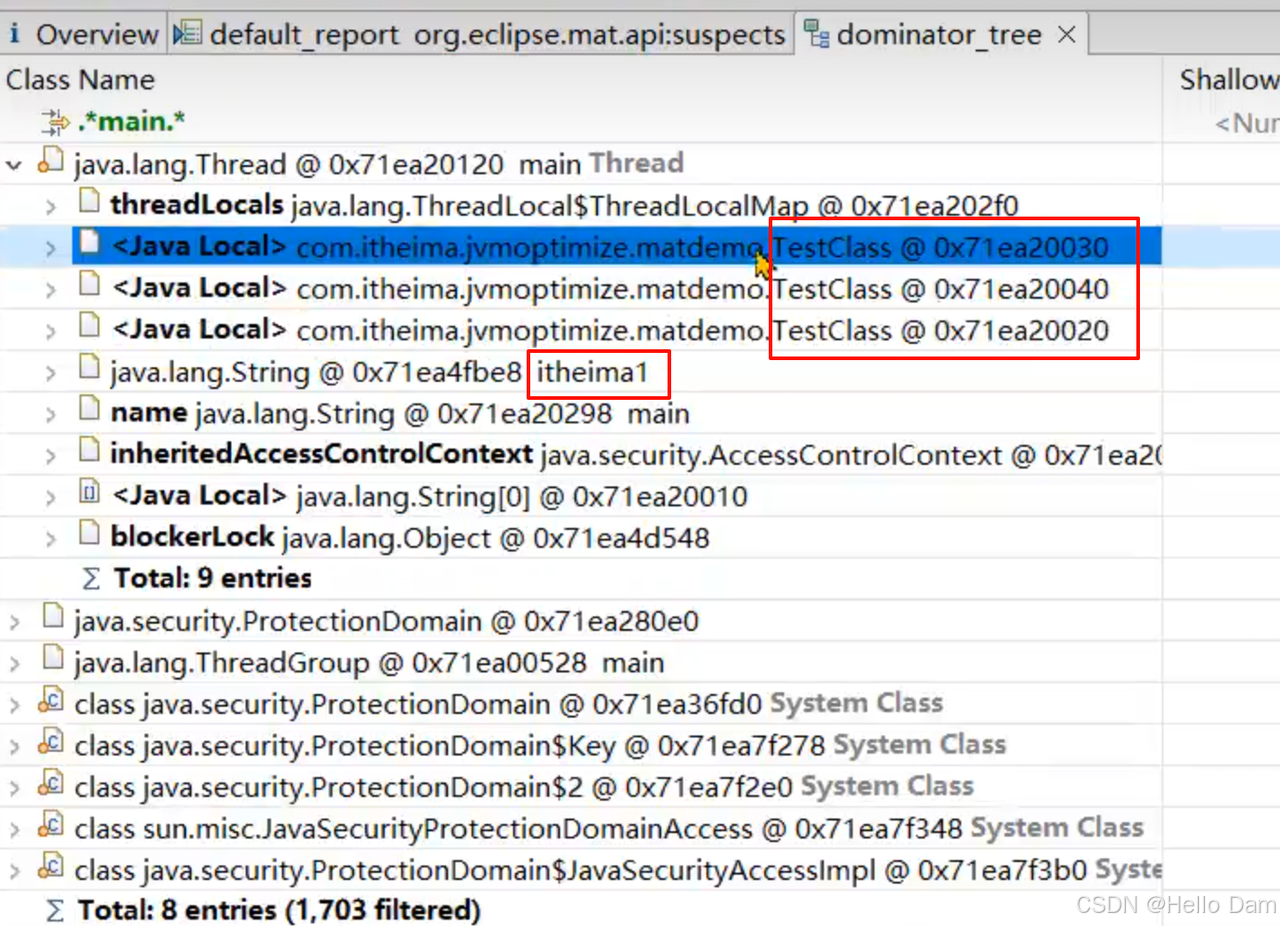
- 第二层
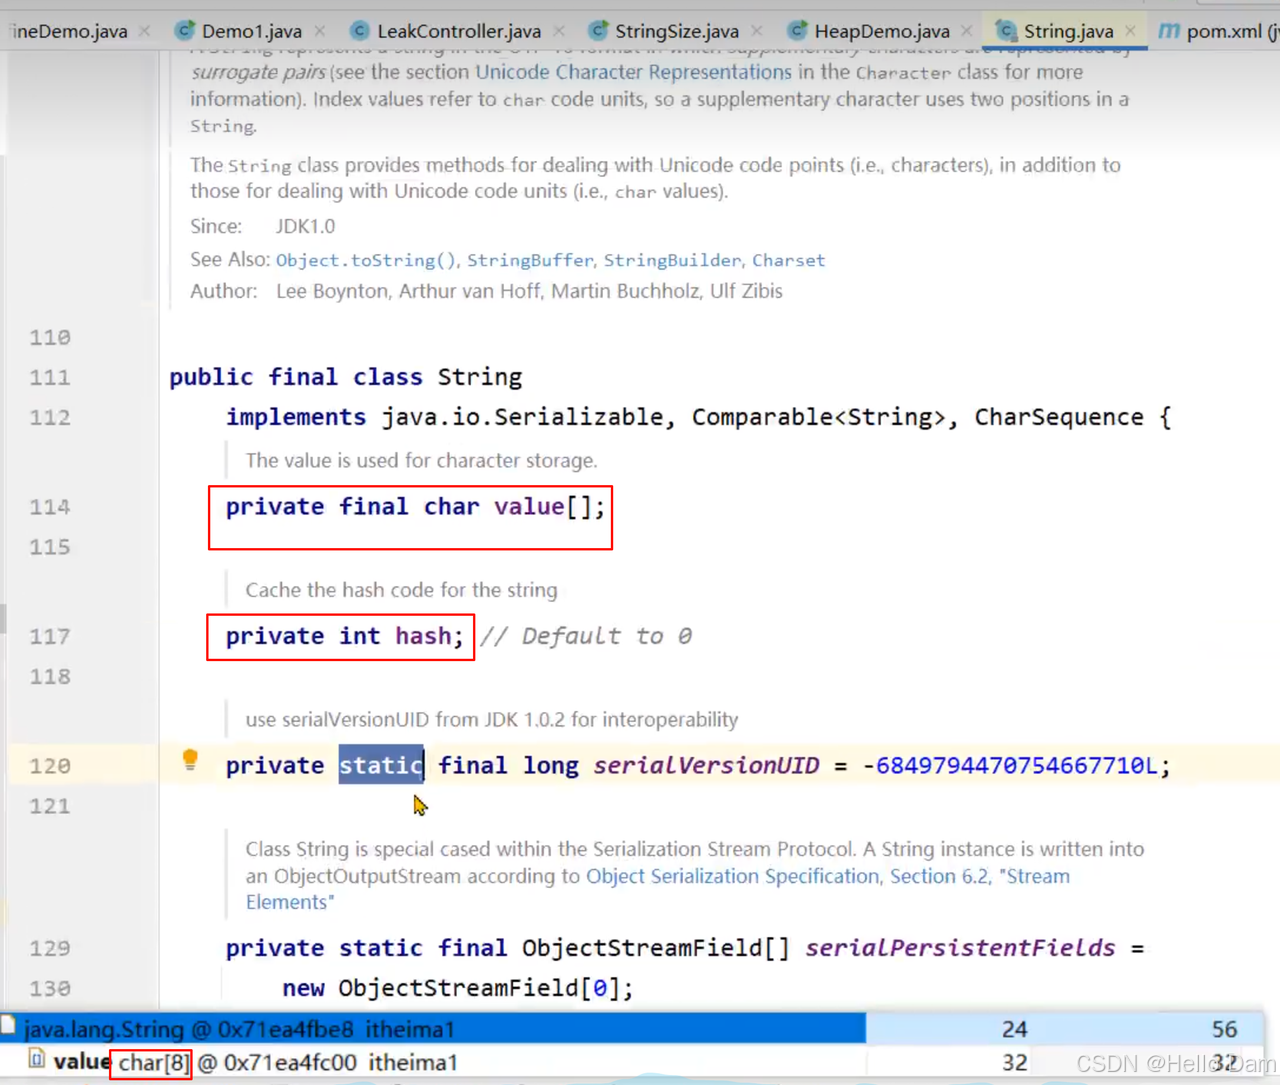
同时可以看到字符串的浅堆大小和深堆大小,单位是字节 :
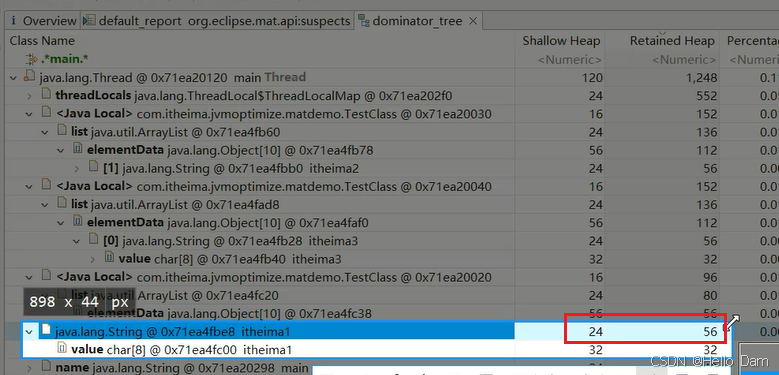
为什么字符串对象的浅堆大小是24字节,深堆大小是56字节呢?首先字符串对象引用了字符数组,字符数组的字节大小底下有展示是32字节,那我们只需要搞清楚浅堆大小也就是他自身为什么是24字节就可以了。使用jol框架打印下对象大小(原理篇会详细展开讲解,这里先有个基本的认知)。
添加依赖:
xml
<dependency>
    <groupId>org.openjdk.jol</groupId>
    <artifactId>jol-core</artifactId>
    <version>0.9</version>
</dependency>
使用代码打印:
java
public class StringSize {
public static void main(String[] args) {
//使用JOL打印String对象
System.out.print(ClassLayout.parseClass(String.class).toPrintable());
}
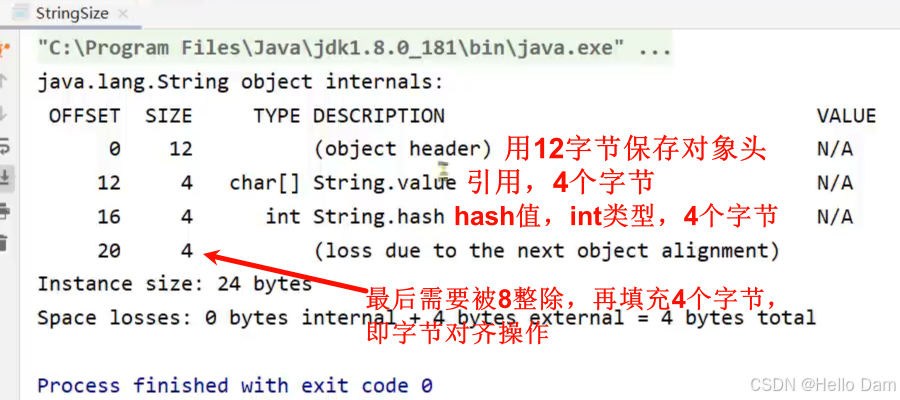
}**结果如下:**对象头占用了12字节,value字符数组的引用占用了4字节,int类型的hash字段占用4字节,还有4字节是对象填充,所以加起来是24字节。至于对象填充、对象头是做什么用的,在《原理篇》中会详细讲解。

如果可以将这个String对象回收,可以释放56个字节的内存
MAT如何根据支配树发现内存泄漏
MAT根据支配树,从叶子节点向根节点遍历,如果发现深堆的大小超过整个堆内存的一定比例阈值,就会将其标记成内存泄漏的"嫌疑对象"。
运行程序的内存快照导出和分析
刚才我们都是在本地导出内存快照的,并且是程序已经出现了内存溢出,接下来我们要做到防范于未然,一旦看到内存大量增长就去分析内存快照,那此时内存还没溢出,怎么样去获得内存快照文件呢?
背景:
小李的团队通过监控系统发现有一个服务内存在持续增长,希望尽快通过内存快照分析增长的原因,由于并未产生内存溢出所以不能通过HeapDumpOnOutOfMemoryError参数生成内存快照。
思路:
导出运行中系统的内存快照,比较简单的方式有两种,注意只需要导出标记为存活的对象:
- 通过JDK自带的jmap命令导出,格式为:
jmap -dump:live,format=b,file=文件路径和文件名 进程ID-dump:live:表示只保留存活对象
- 通过arthas的heapdump命令导出,格式为:
heapdump --live 文件路径和文件名
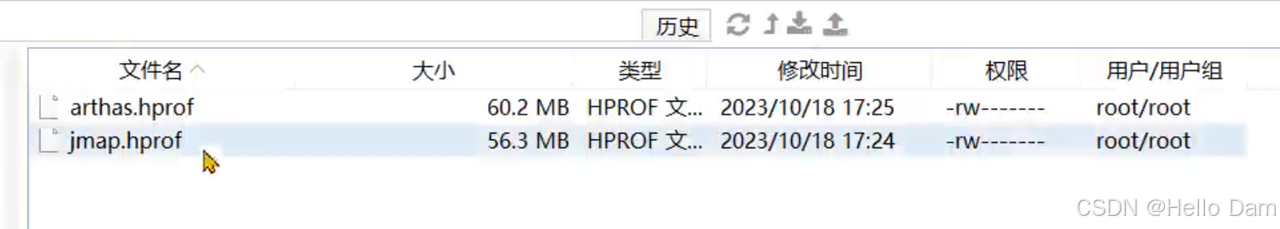
先使用jps或者ps -ef查看进程ID:
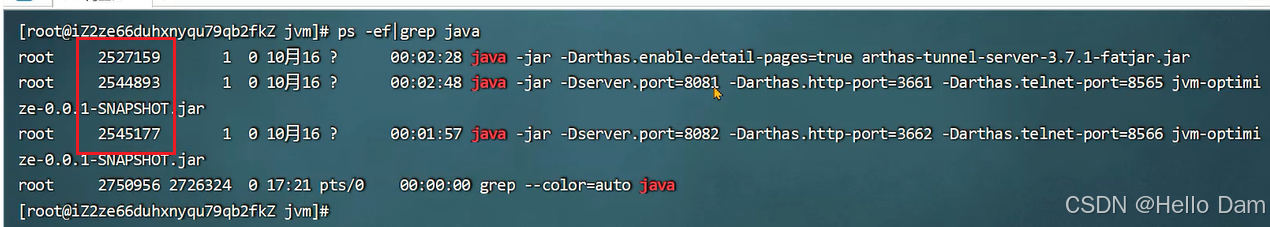
通过jmap命令导出内存快照文件,live代表只保存存活对象,format=b用二进制方式保存:

也可以在arthas中输出heapdump命令:
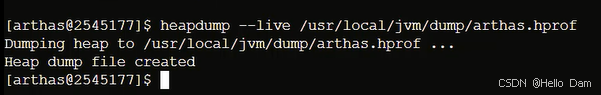
最终生成的文件如下:
快照大文件的处理
在程序员开发用的机器内存范围之内的快照文件,直接使用MAT打开分析即可。但是存在两个问题
- 服务器上的程序占用的内存达到10G以上,开发机无法正常打开此类内存快照(因为开发机内存要大于服务器程序的内存,MAT才可以打开内存快照文件)
- 而且将服务器的内存快照文件下载到开发机,受限于服务器宽带,下载速度会非常慢,耗时长
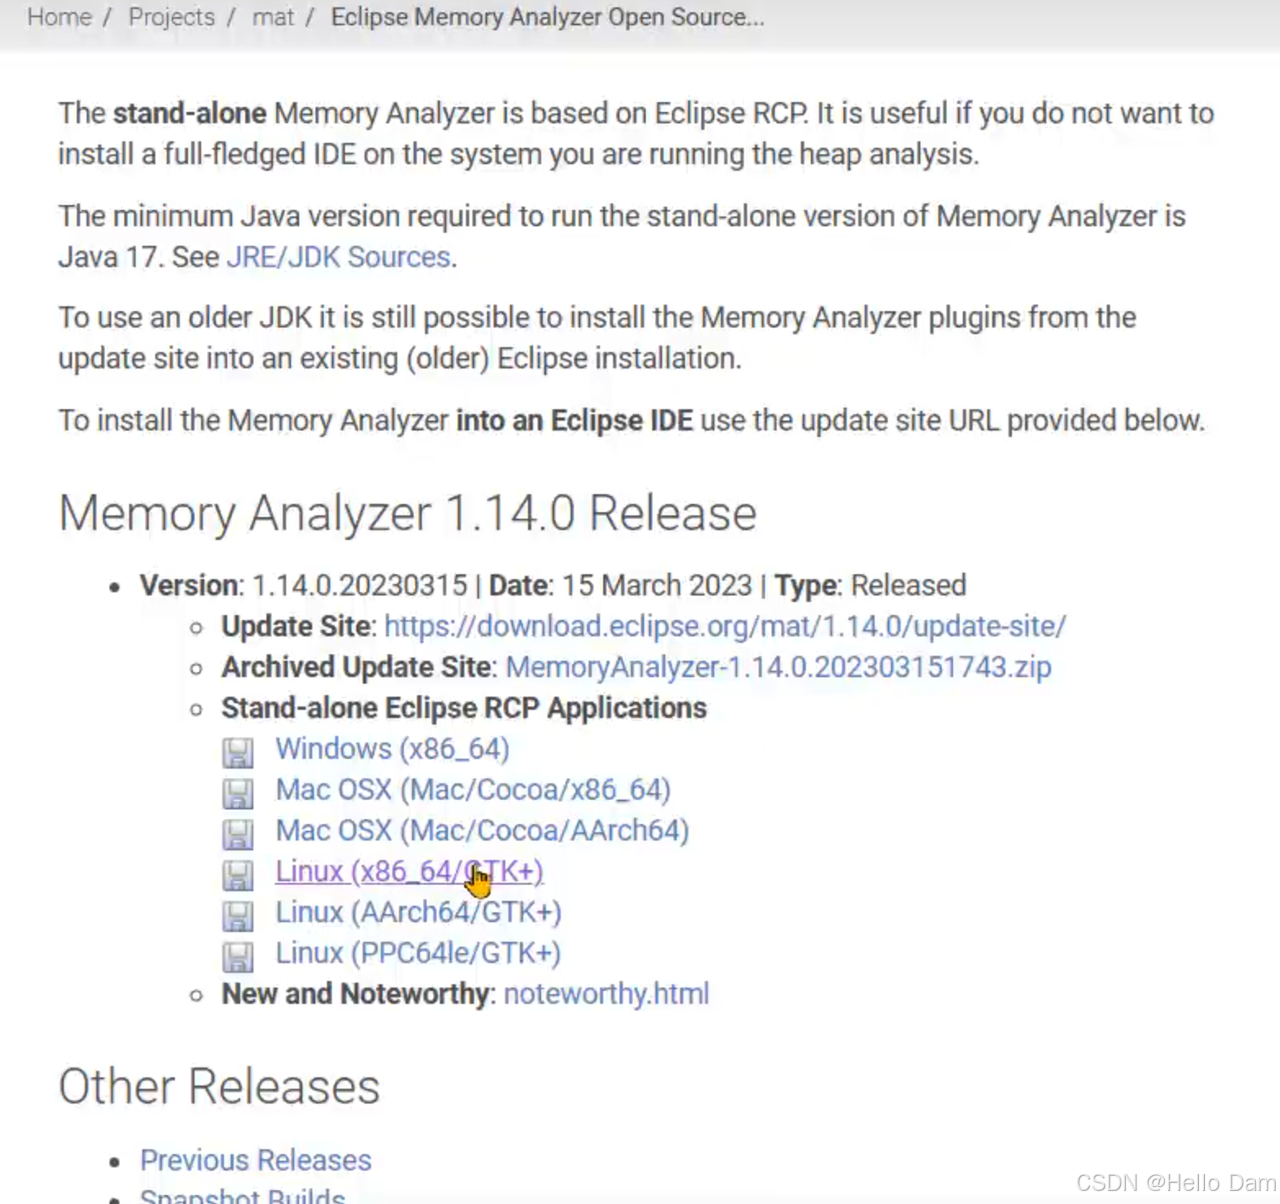
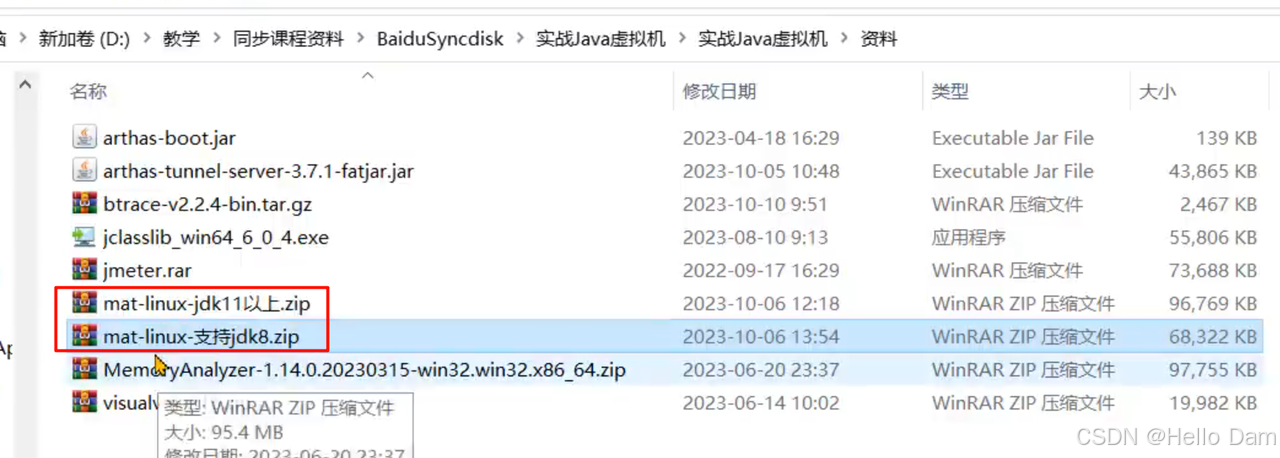
解决方案:下载服务器操作系统对应的MAT,直接在服务器上面进行分析。下载地址:https://eclipse.dev/mat/downloads.php
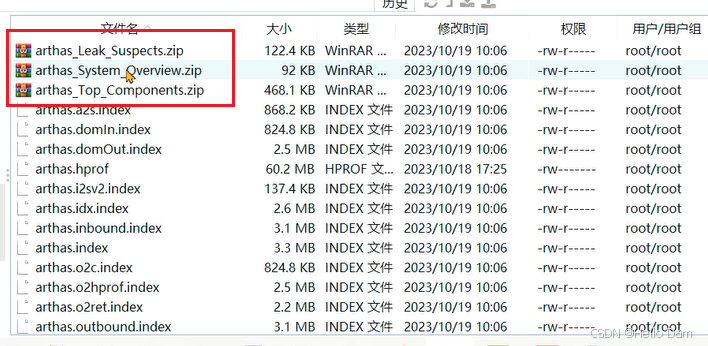
在服务器的MAT中运行如下脚本自动根据内存快照生成内存泄漏检测报告:
./ParseHeapDump.sh 快照文件路径 org.eclipse.mat.api:suspects org.eclipse.mat.api:overview org.eclipse.mat.api:top_components
org.eclipse.mat.api:suspects表示生成内存泄漏检测报告org.eclipse.mat.api:overview生成总览图org.eclipse.mat.api:top_components生成组件图

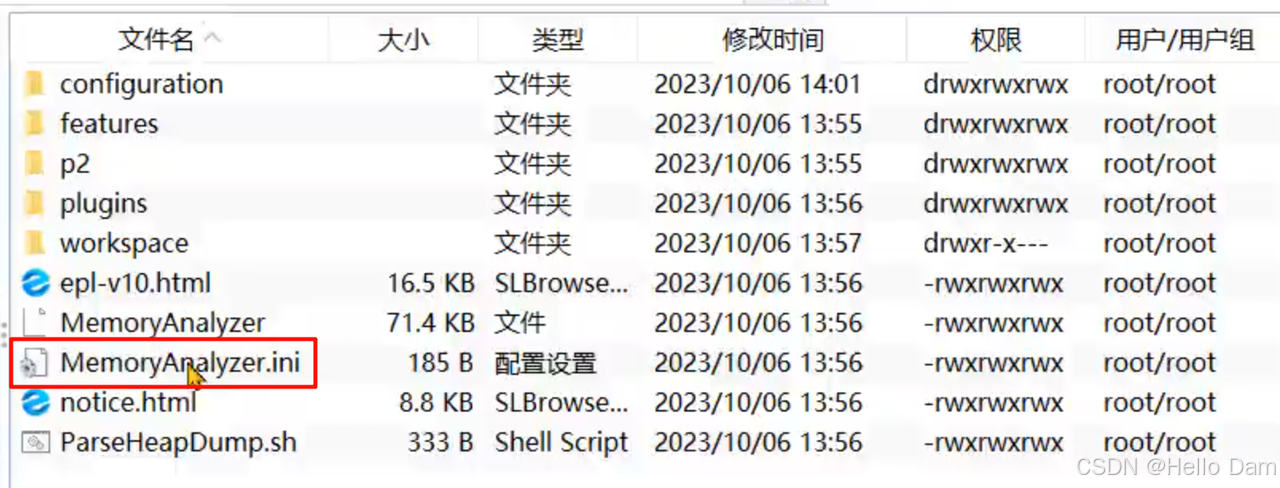
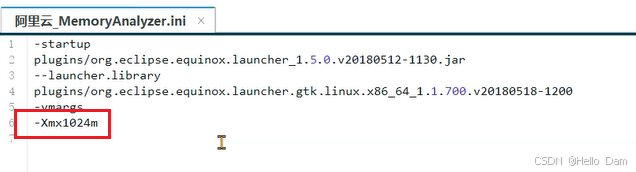
注意:默认MAT分析时只使用了1G的堆内存,如果快照文件超过1G,需要修改MAT目录下的MemoryAnalyzer.ini配置文件调整最大堆内存。(建议将最大内存改成快照文件内存的1.5倍左右)
最终会生成报告文件:
将这些文件下载到本地,解压之后打开index.html文件:
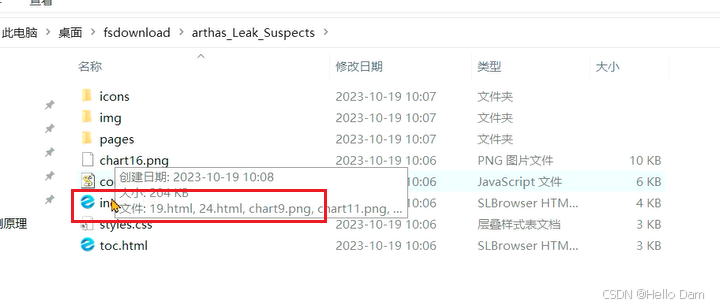
同样可以看到类似的报告:
案例实战
修复内存溢出问题的具体问题具体分析,问题总共可以分成三类:
- 代码中的内存泄漏:在前面的篇章中已经介绍并提供解决方案
- 并发引起内存溢出 - 设计不当
- 从数据库获取超大数据量的数据
- 线程池设计不当
- 生产者-消费者模型,消费者消费性能问题
- 解决方案:优化设计方案
- 并发引起内存溢出 - 参数不当
- 由于参数设置不当,比如堆内存设置过小,导致并发量增加之后超过堆内存的上限。
- 解决方案:调整参数
案例1:分页查询文章接口的内存溢出
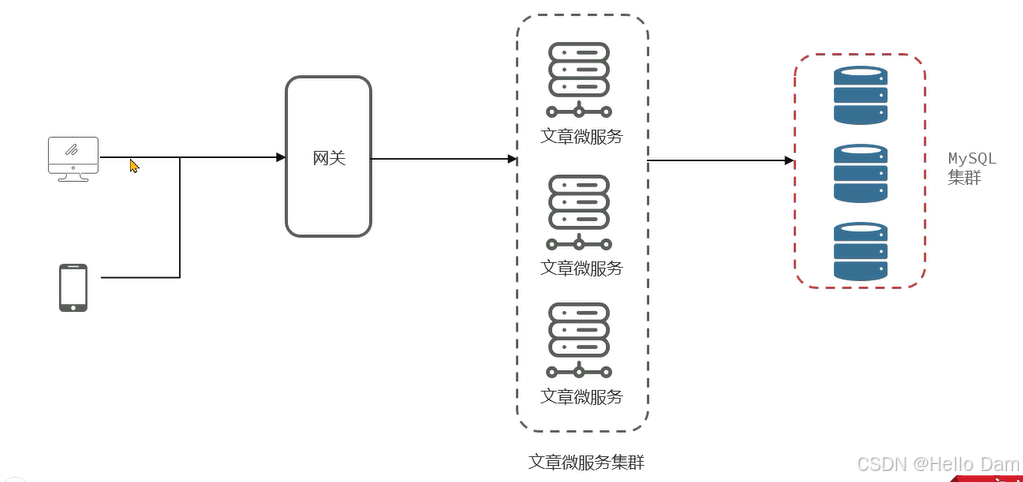
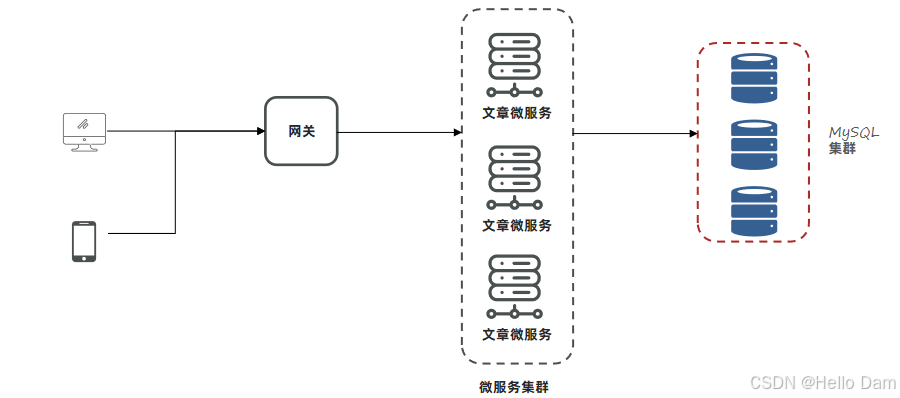
背景:小李负责的新闻资讯类项目采用了微服务架构,其中有一个文章微服务,这个微服务在业务高峰期出现了内存溢出的现象。

解决思路:
1、服务出现OOM内存溢出时,生成内存快照。
2、使用MAT分析内存快照,找到内存溢出的对象。
3、尝试在开发环境中重现问题,分析代码中问题产生的原因。
4、修改代码。
5、测试并验证结果。
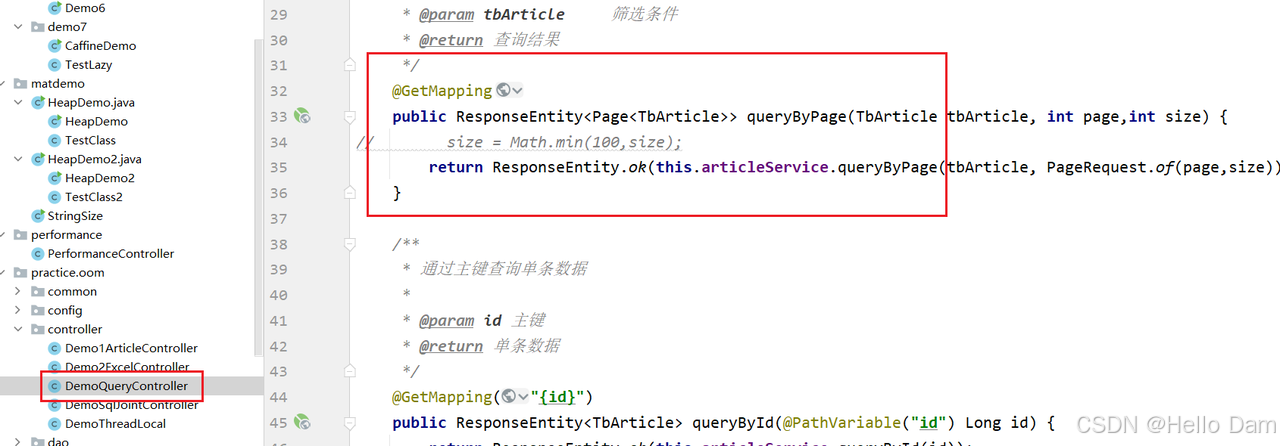
代码使用的是com.itheima.jvmoptimize.practice.oom.controller.DemoQueryController:
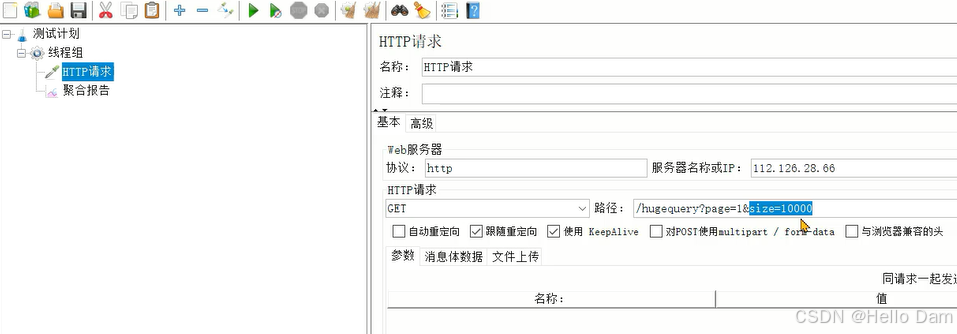
首先将项目打包,放到服务器上,同时使用如下启动命令启动。设置了最大堆内存为512m,同时堆内存溢出时会生成hprof文件:

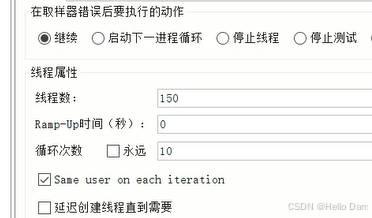
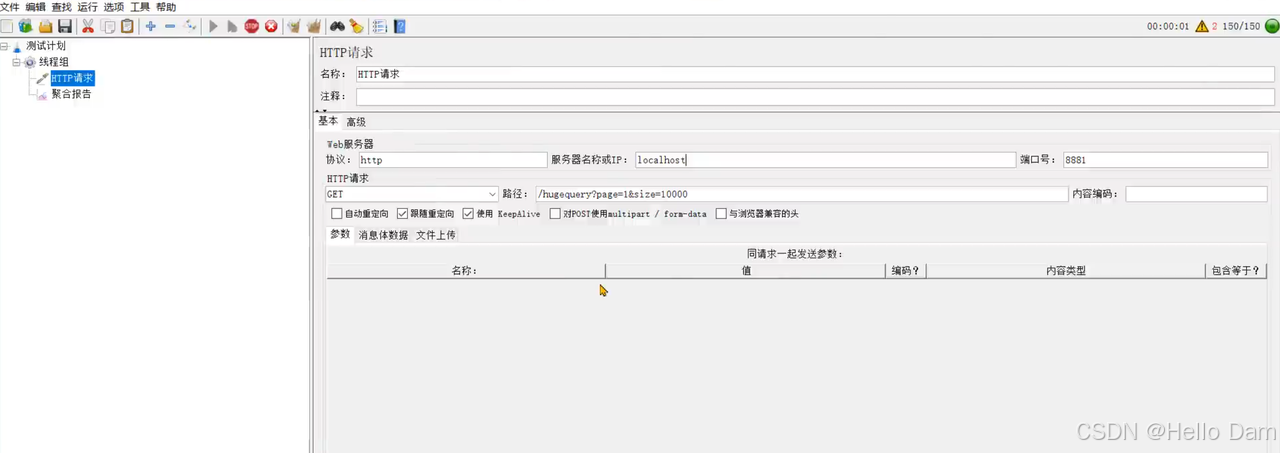
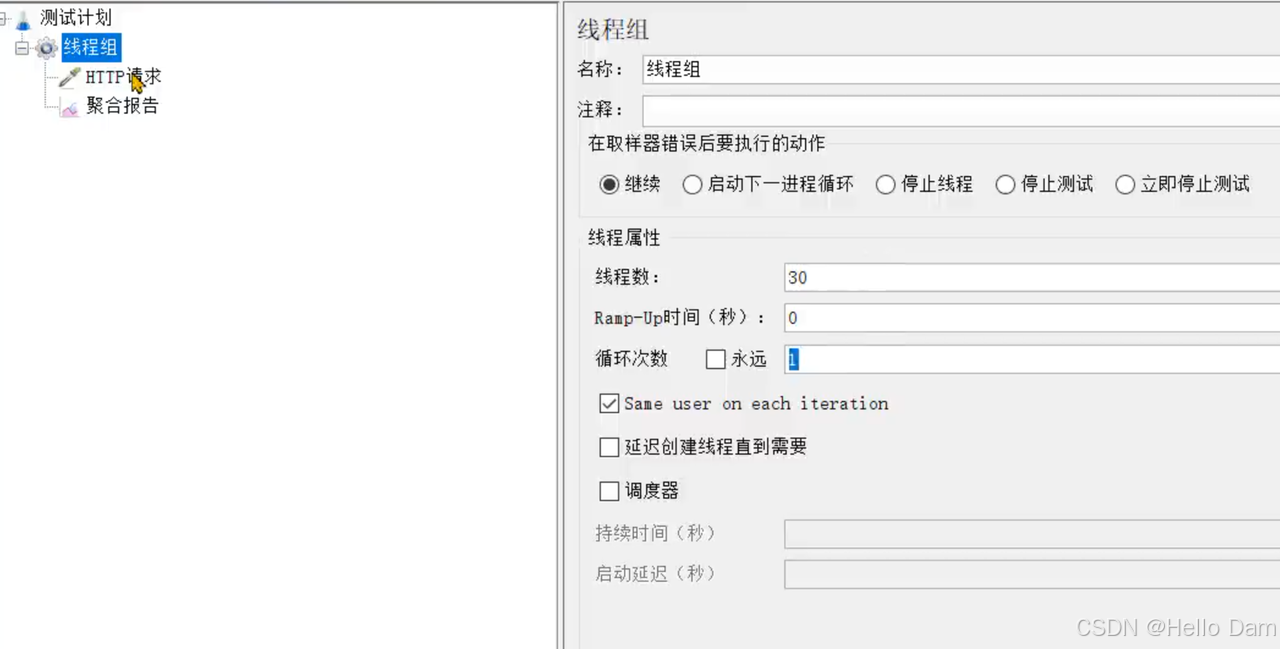
编写JMeter脚本进行压测,size数据量一次性获取10000条,线程150,每个线程执行10次方法调用:
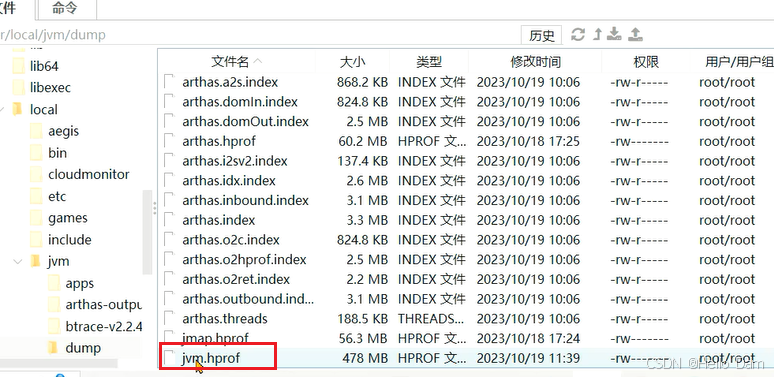
执行之后可以发现服务器上已经生成了hprof文件:
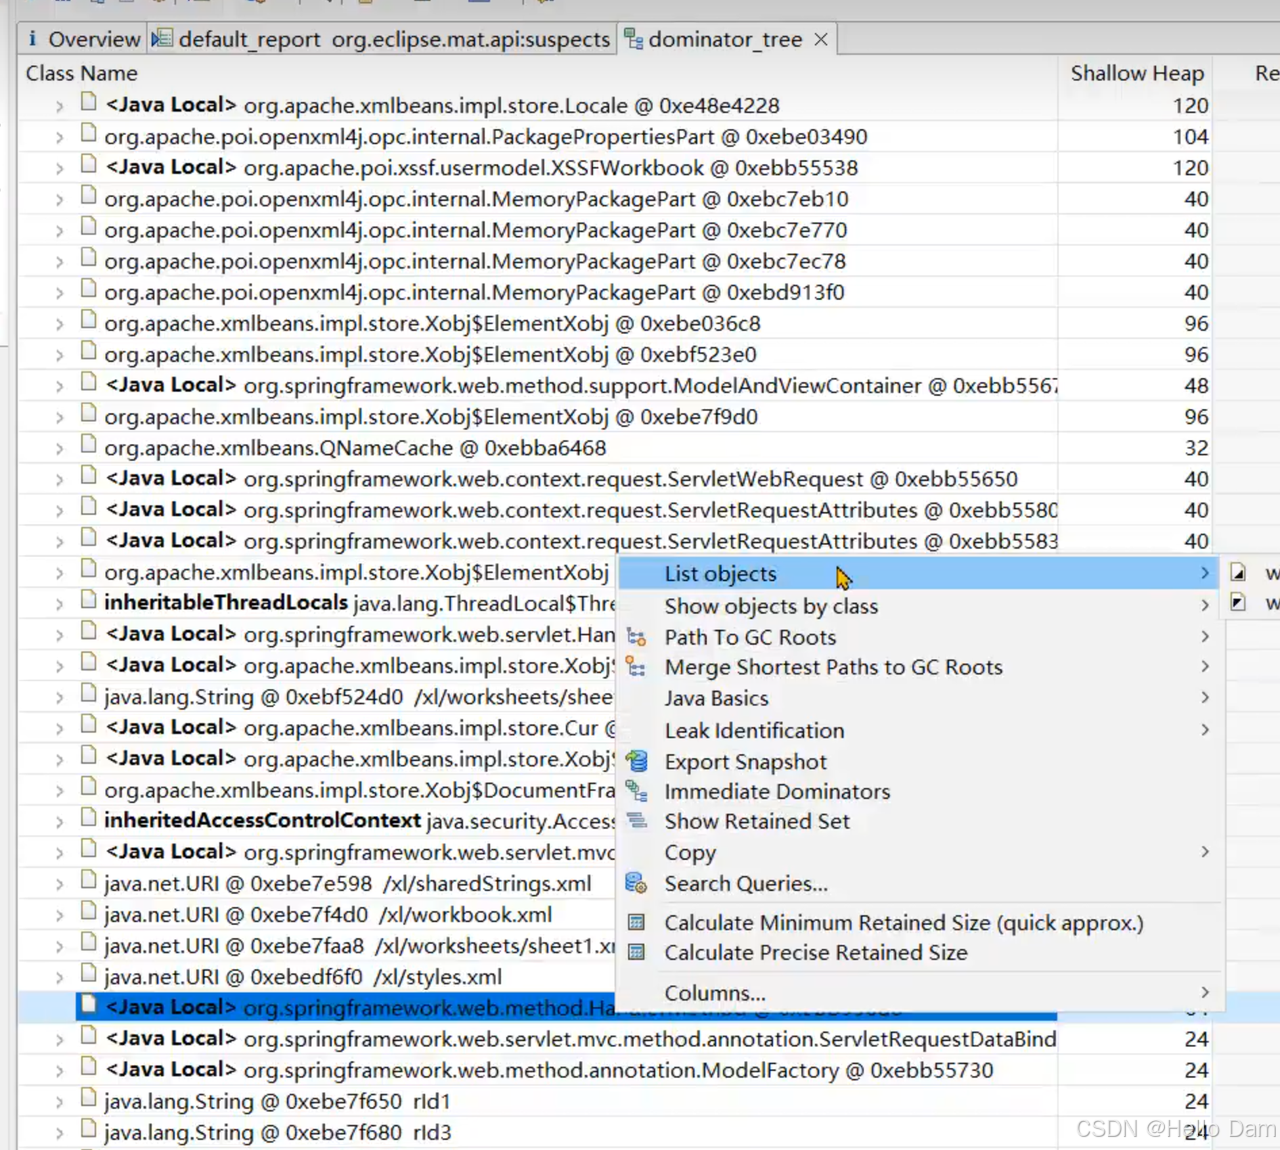
将其下载到本地,通过MAT分析发现是Mysql返回的ResultSet存在大量的数据:
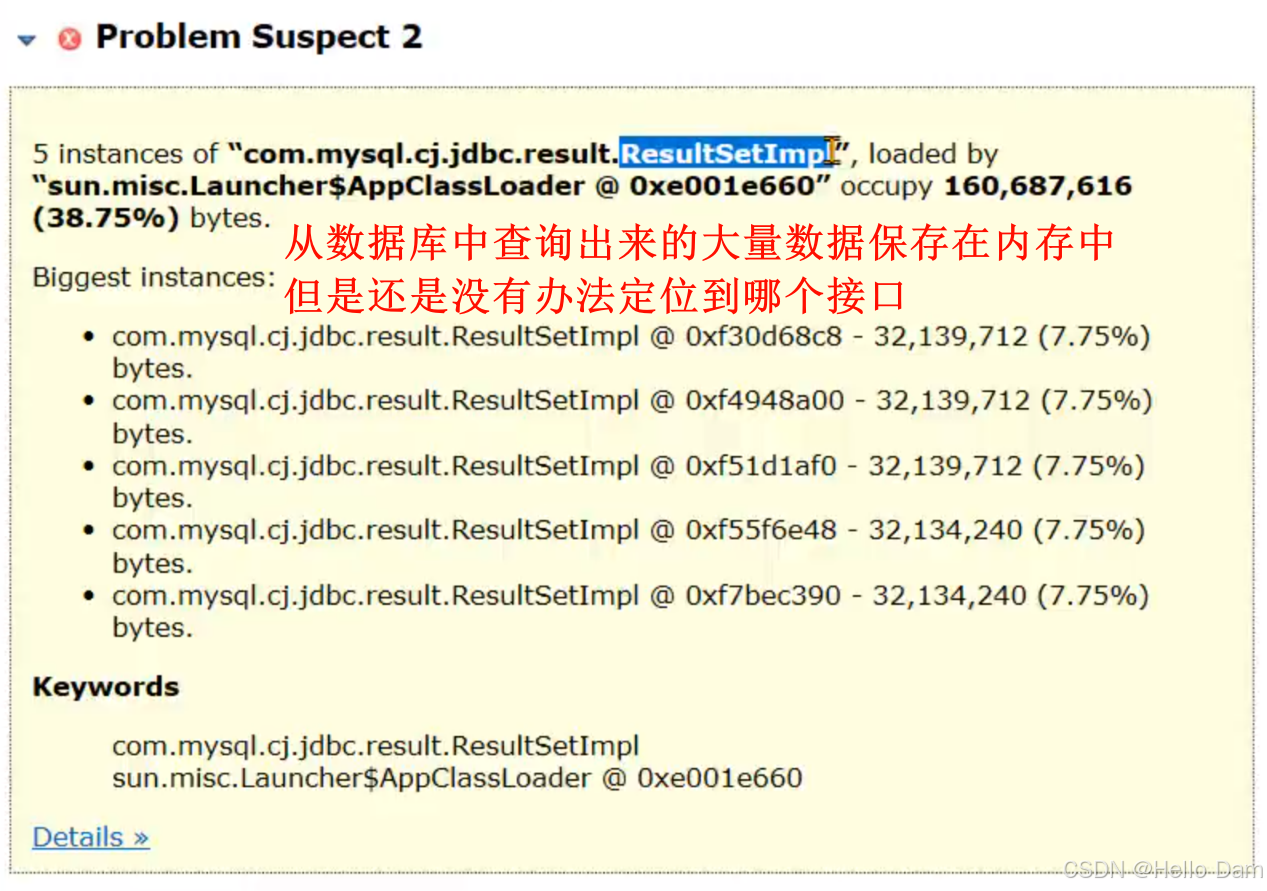
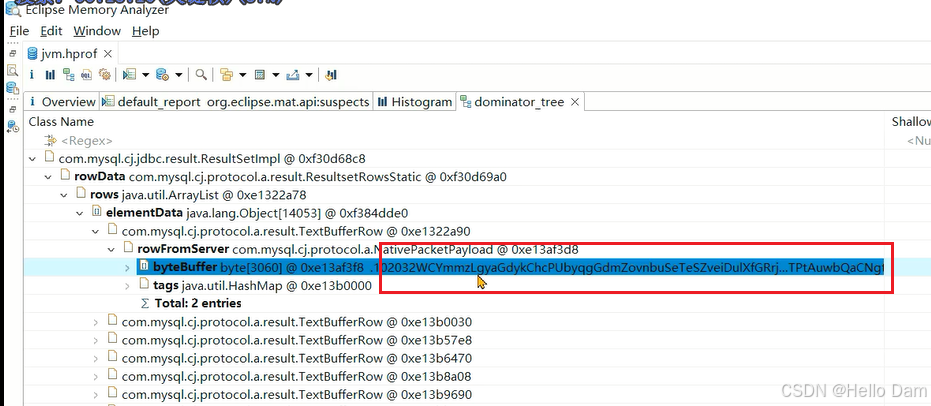
通过支配树,可以发现里边包含的数据,如果数据有一些特殊的标识,其实就可以判断出来是哪个接口产生的数据:
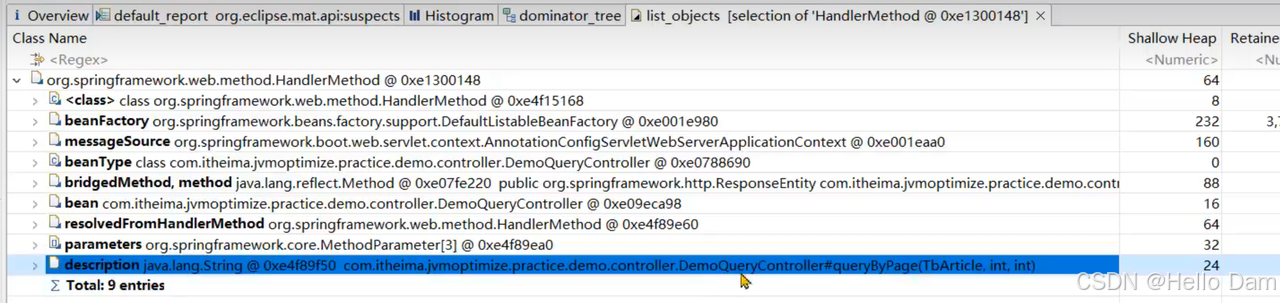
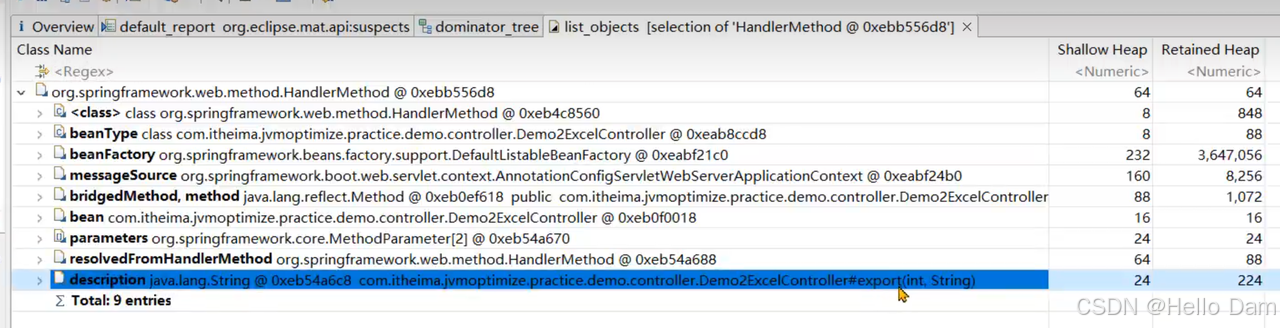
如果想知道每个线程在执行哪个方法,先找到spring的HandlerMethod对象:
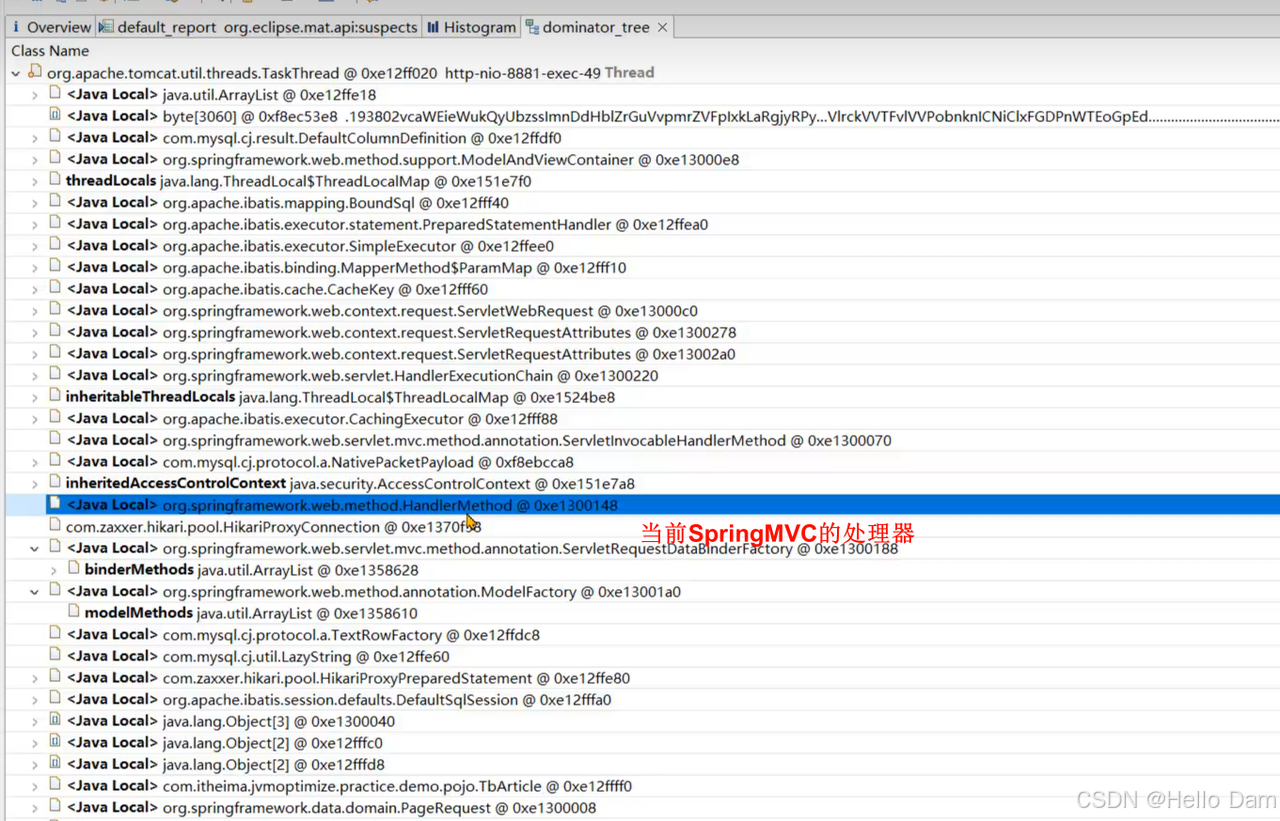
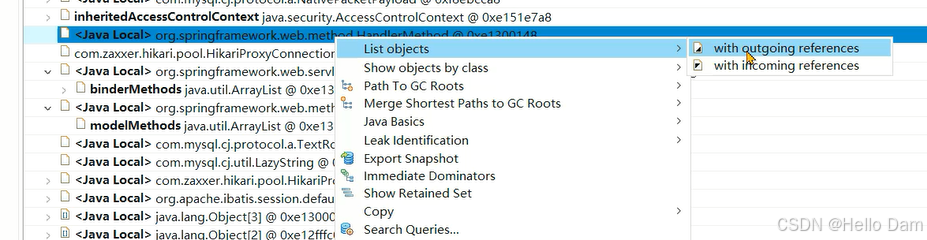
接着去找引用关系:
- outgoing:当前对象引用的对象
- incoming:当前对象被哪些对象引用
通过描述信息就可以看到接口:
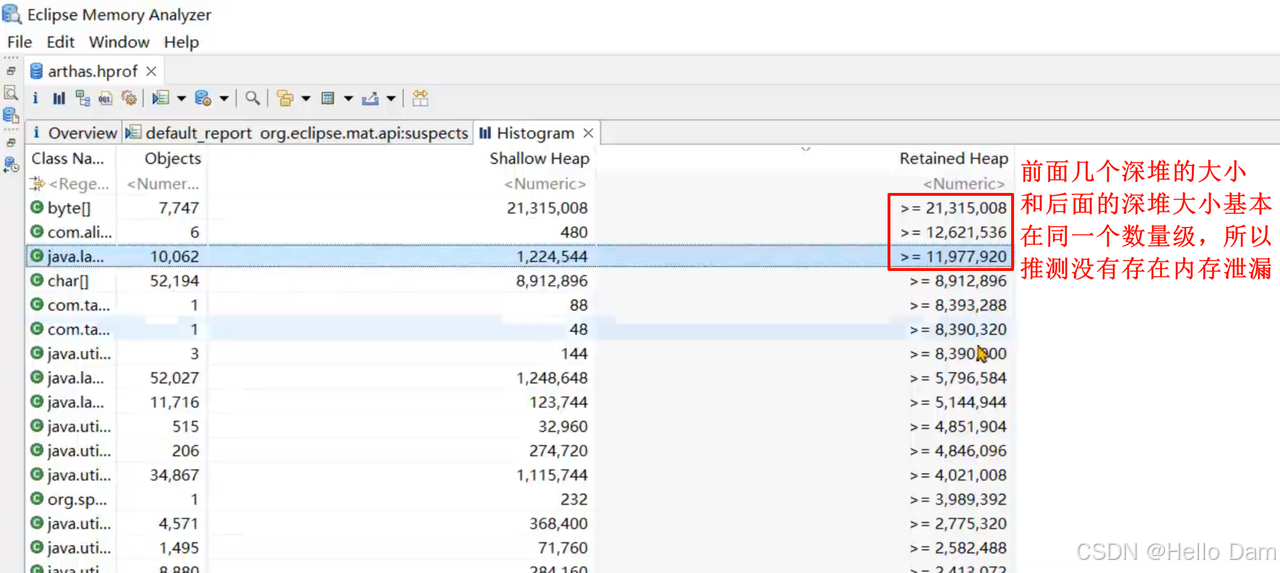
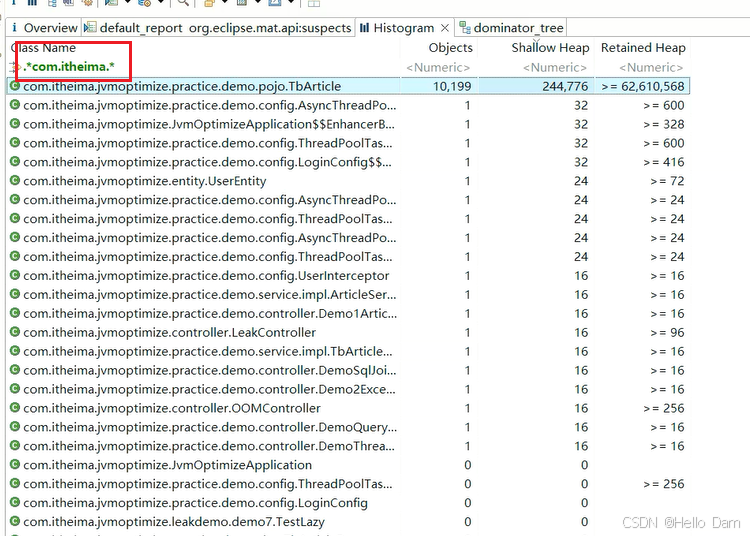
通过直方图的查找功能,也可以找到项目里哪些对象比较多:
到这里有理由怀疑是TbArticle对象导致的内存溢出
问题还原:
使用JMeter进行压力测试
问题推测:
文章微服务中的分页接口没有限制最大单次访问条数,并且单个文章对象占用的内存量较大,在业务高峰期并发量较大时这部分从数据库获取到内存之后会占用大量的内存空间。
解决思路:
1、与产品设计人员沟通,限制最大的单次访问条数。(一次性获取那么多数据,用户不一定看得过来)
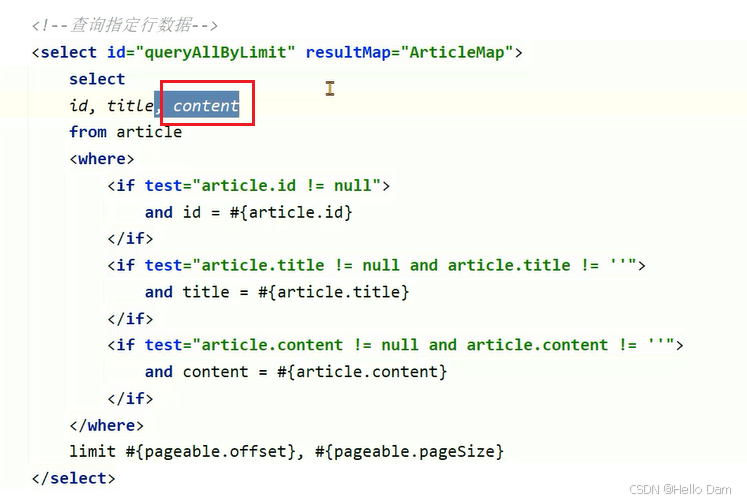
以下代码,限制了每次访问的最大条数为100条
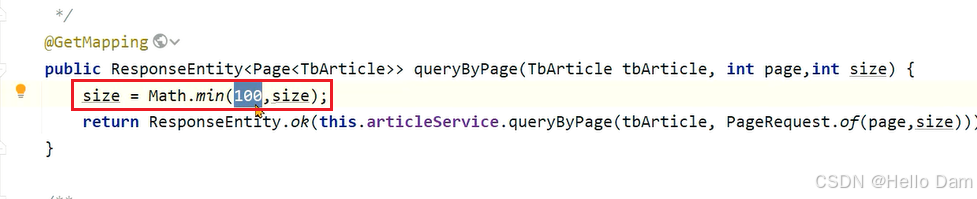
2、分页接口如果只是为了展示文章列表,不需要获取文章内容,可以大大减少对象的大小。
把文章内容去掉,减少对象大小:
3、在高峰期对微服务进行限流保护。(需要考虑可行性,限流会影响一部分用户体验)
案例2:Mybatis导致的内存溢出
背景:小李负责的文章微服务进行了升级,新增加了一个判断id是否存在的接口,第二天业务高峰期出现了内存溢出,小李觉得应该和新增加的接口有关系。
解决思路:
1、服务出现OOM内存溢出时,生成内存快照。
2、使用MAT分析内存快照,找到内存溢出的对象。
3、尝试在开发环境中重现问题,分析代码中问题产生的原因。
4、修改代码。
5、测试并验证结果。
通过分析hprof发现调用的方法,但是这个仅供参考。这个方法用来判断当前id是否在数据库中存在
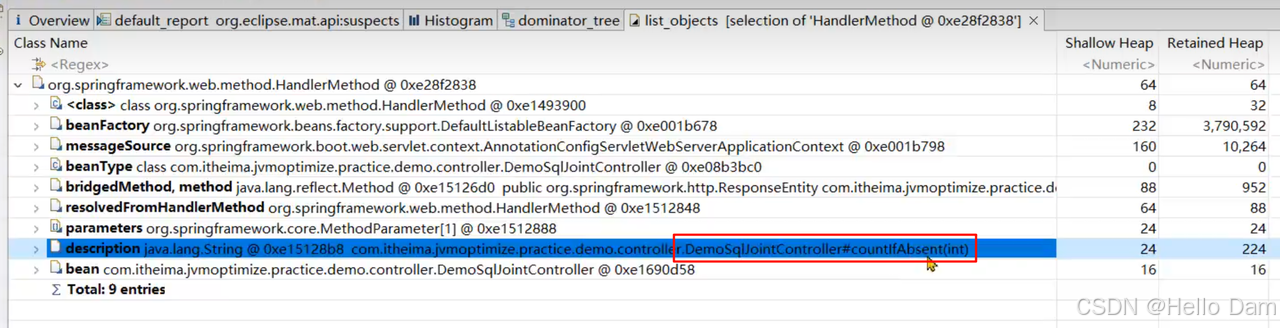
分析支配树,挖掘其他信息,找到大对象来源,是一些字符串,里边还包含SQL
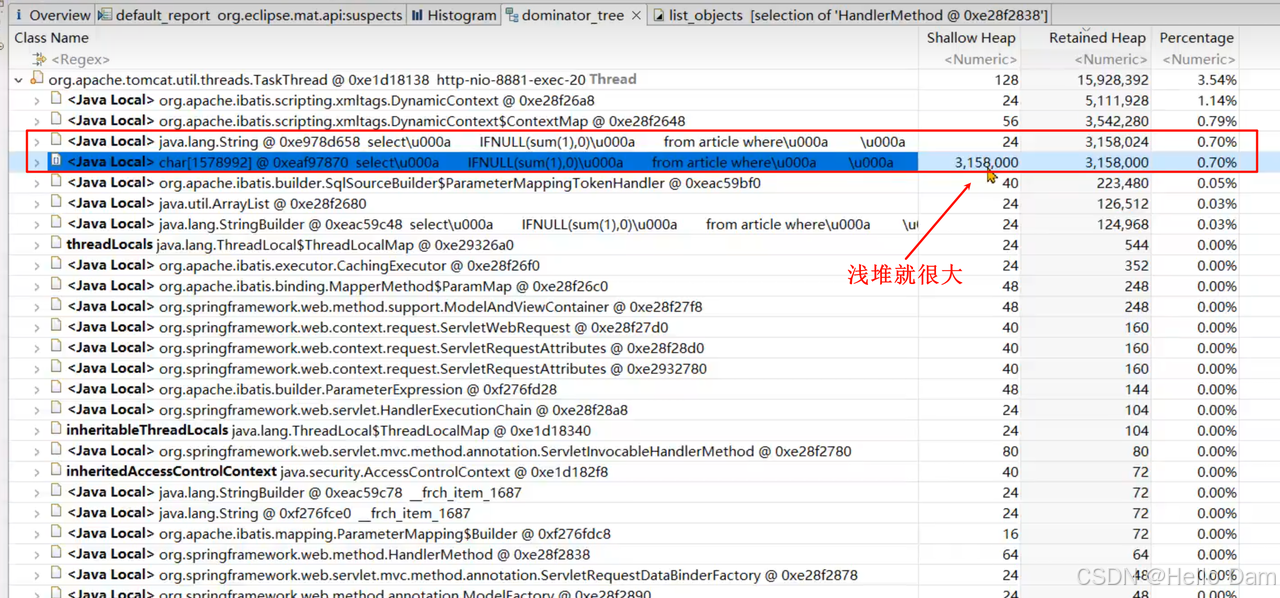
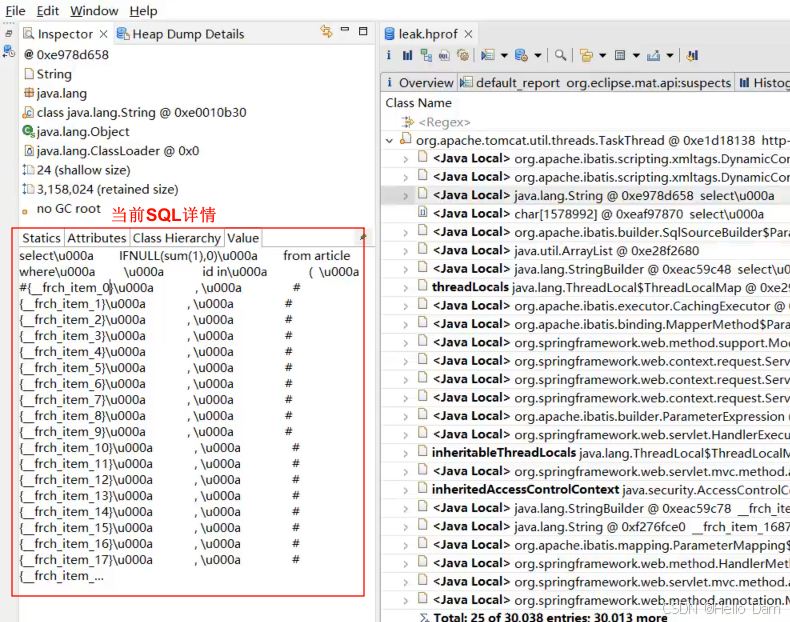
通过SQL内容搜索下可以找到对应的方法:
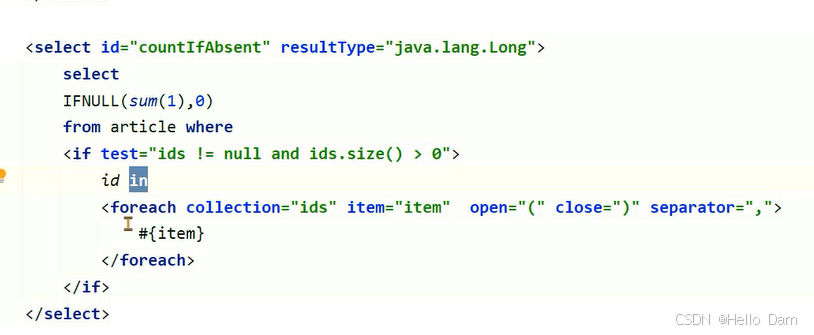
发现里边用了foreach,如果循环内容很大,会产生特别大的一个SQL语句。
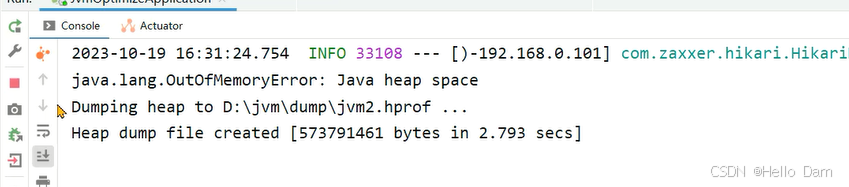
直接打开jmeter,打开测试脚本进行测试:
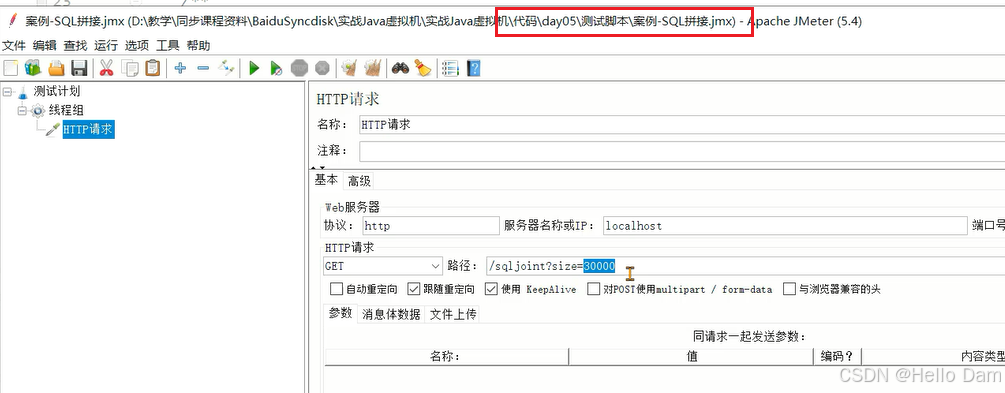
本地测试之后,出现了内存溢出:
问题根源:
Mybatis在使用foreach进行sql拼接时,会在内存中创建对象,如果foreach处理的数组或者集合元素个数过多,会占用大量的内存空间。
解决思路:
1、限制参数中最大的id个数。
2、将id缓存到redis或者内存缓存中,通过缓存进行校验。
案例3:导出大文件内存溢出(云原生环境解决内存溢出问题)
- 小李负责了一个管理系统,这个管理系统支持几十万条数据的excel文件导出。他发现系统在运行时如果有几十个人同时进行大数据量的导出时,会出现内存谥出。
- 小李团队使用的是k8s将管理系统部署到了容器中,所以这一次我们使用阿里云的k8s环境还原场景,并解决问题。阿里云的k8s整体规划如下:
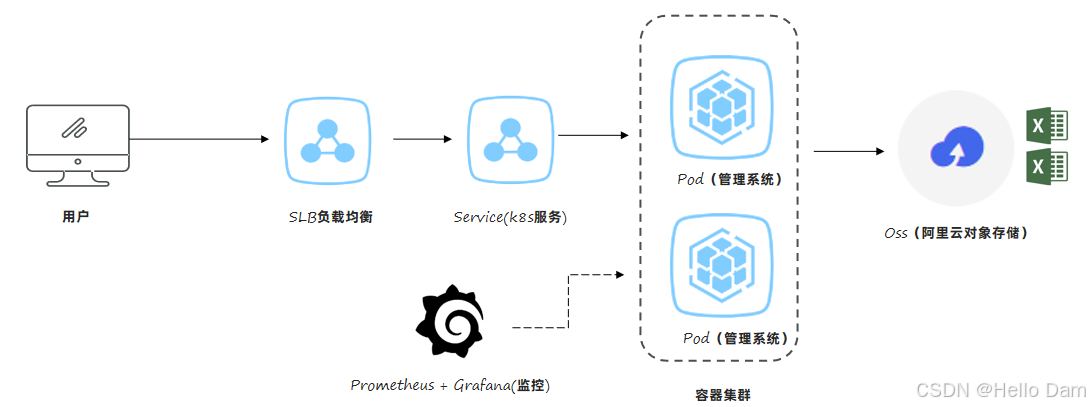
excel文件和内存溢出的内存快照文件都存储到阿里云OSS中
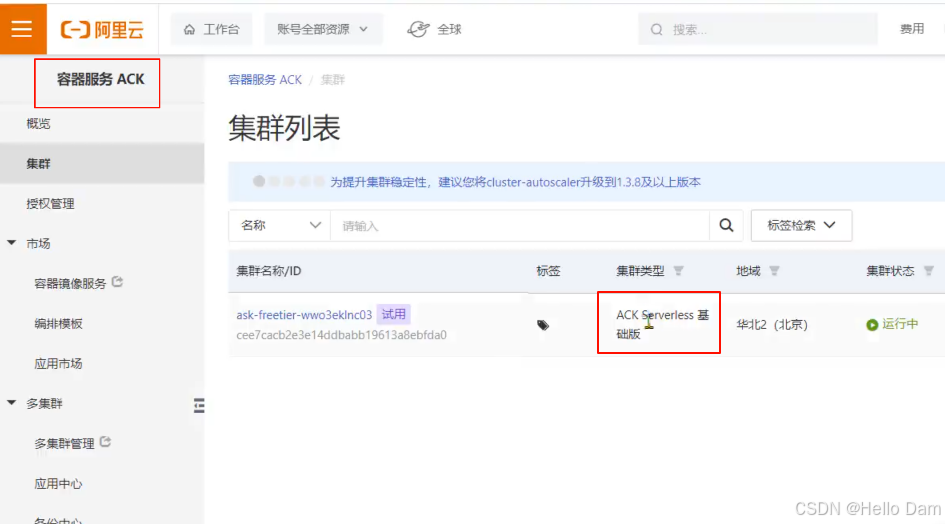
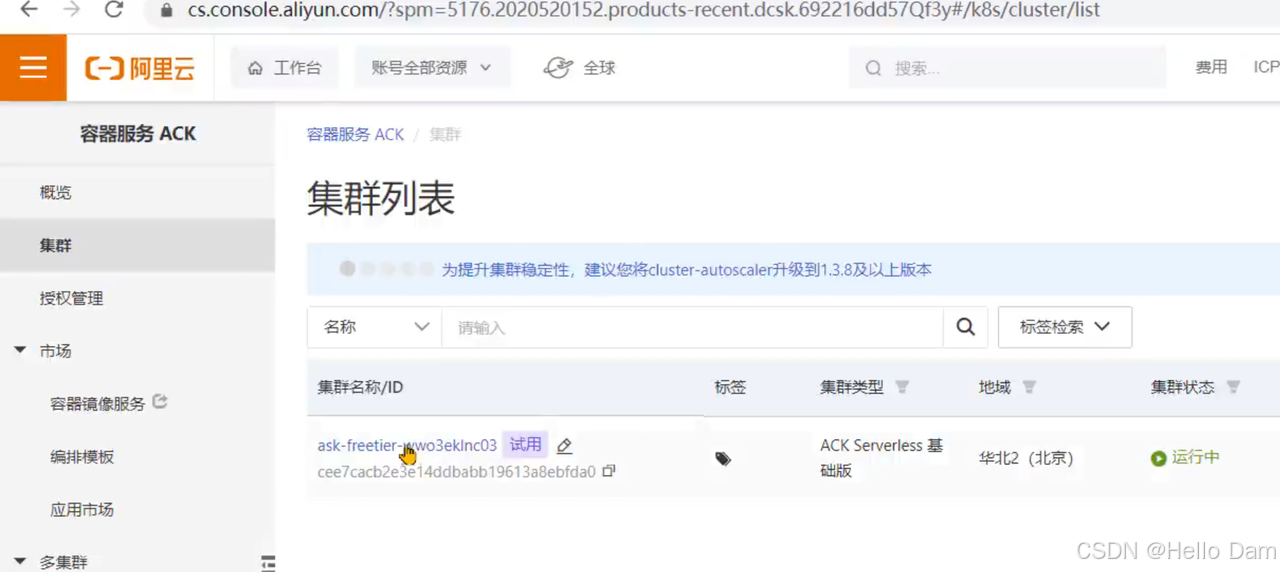
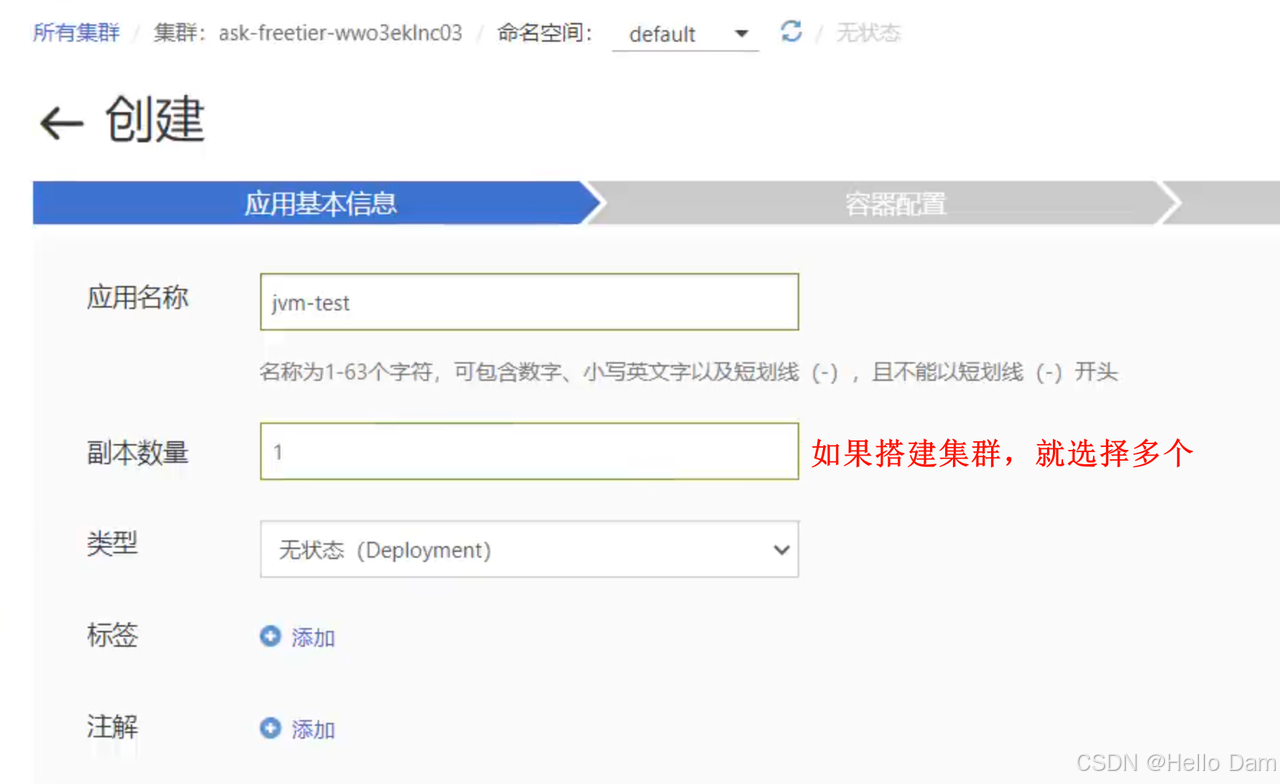
K8S环境搭建(了解即可)
先开通ACK,并创建集群服务
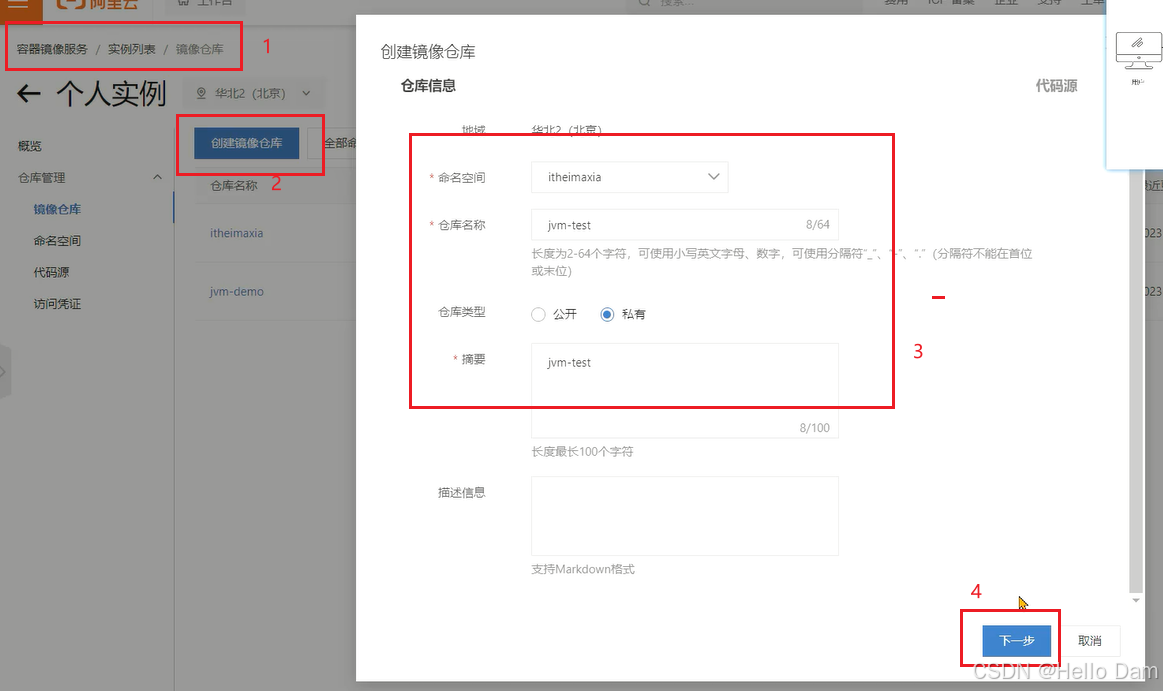
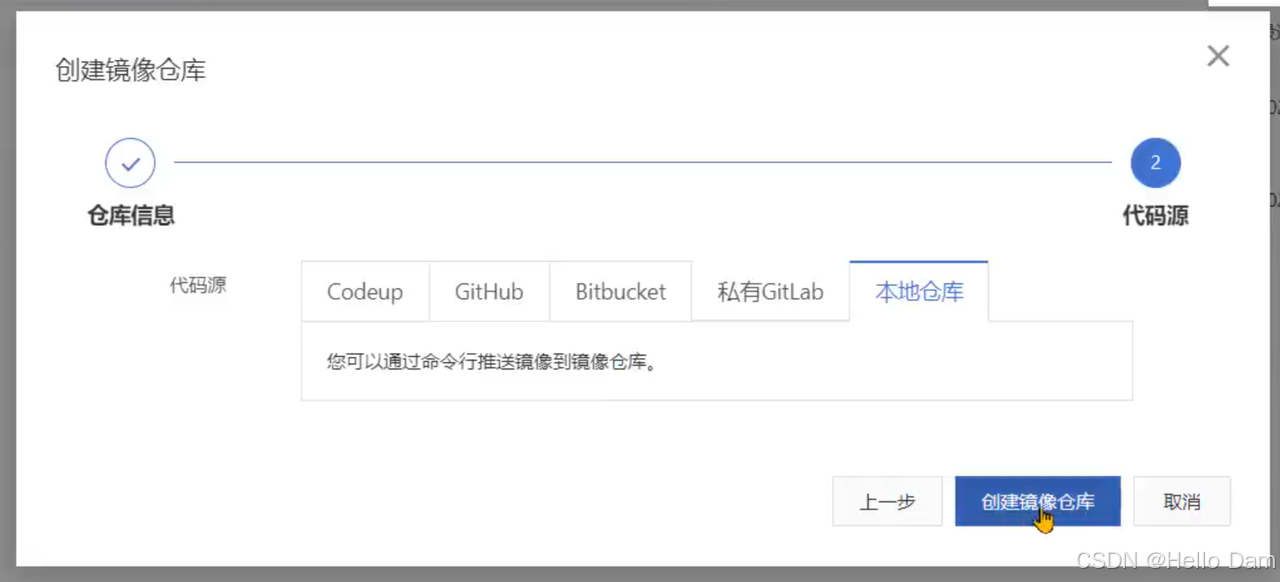
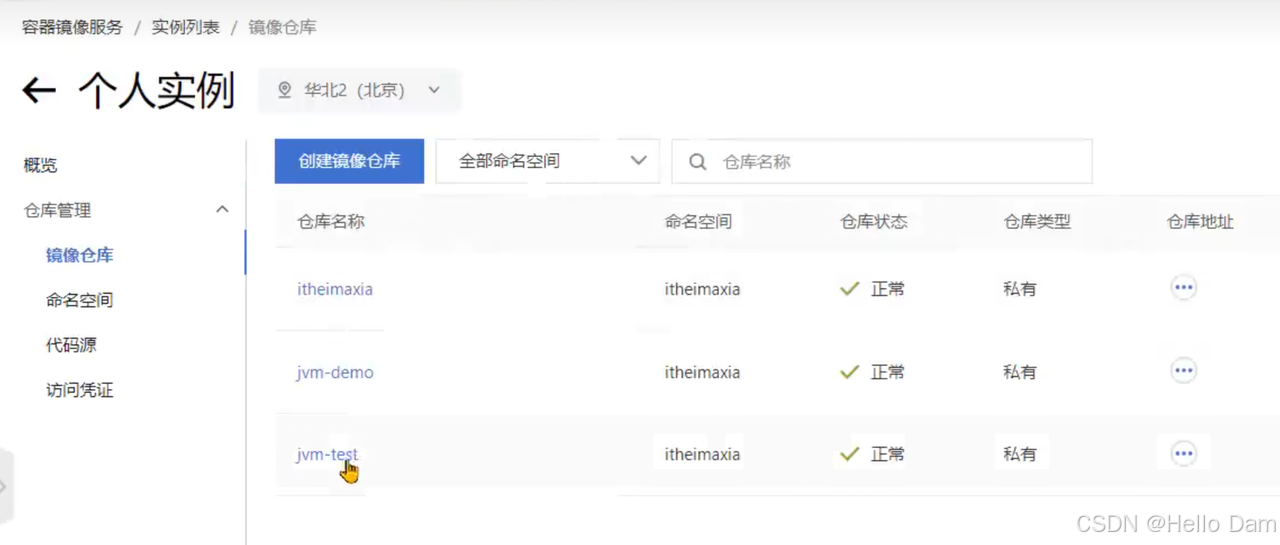
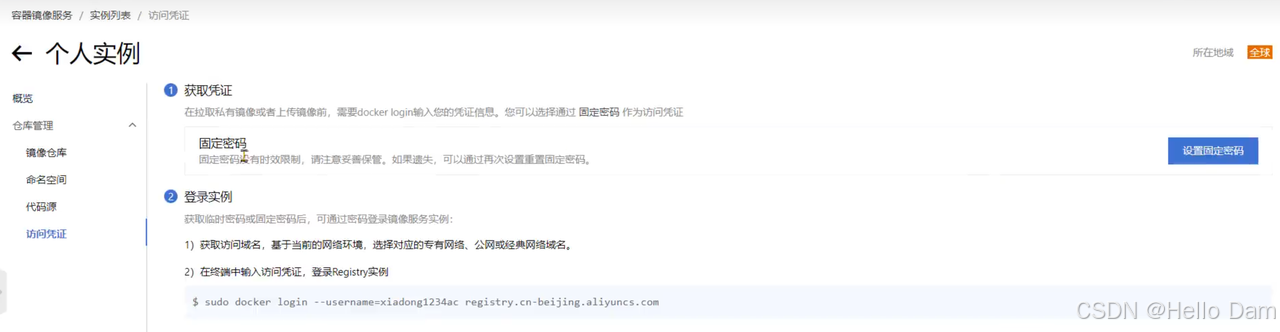
1、在容器镜像服务中创建镜像仓库
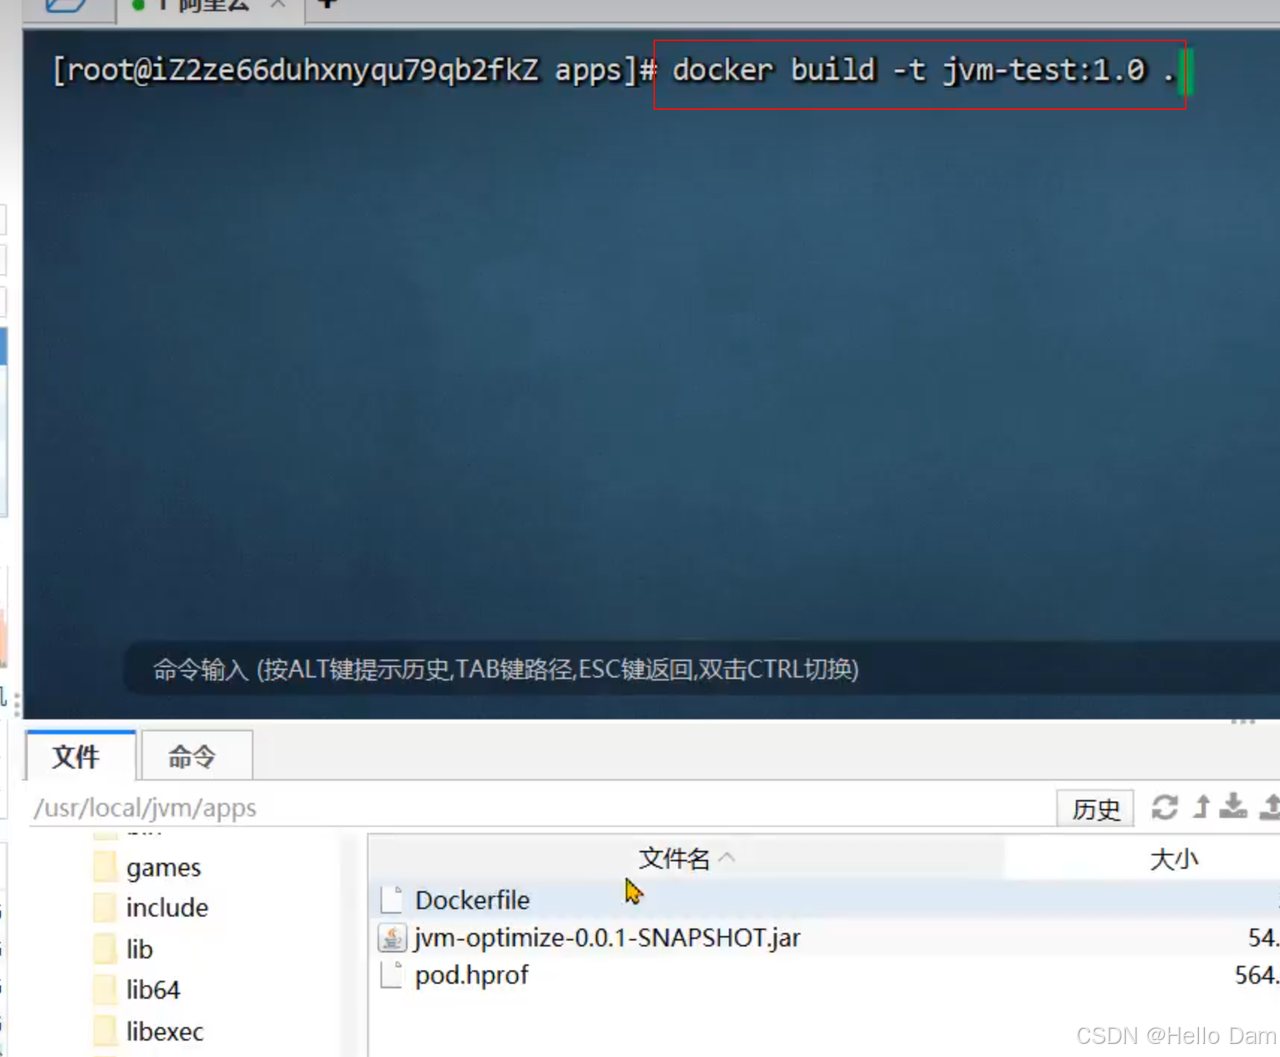
2、项目中添加Dockerfile文件,告诉Docker怎么生成镜像
shell
FROM openjdk:8-jre
MAINTAINER xiadong(作者) <xiadong@itcast.cn(作者邮箱)>
RUN ln -sf /usr/share/zoneinfo/Asia/Shanghai /etc/localtime (设置时区)
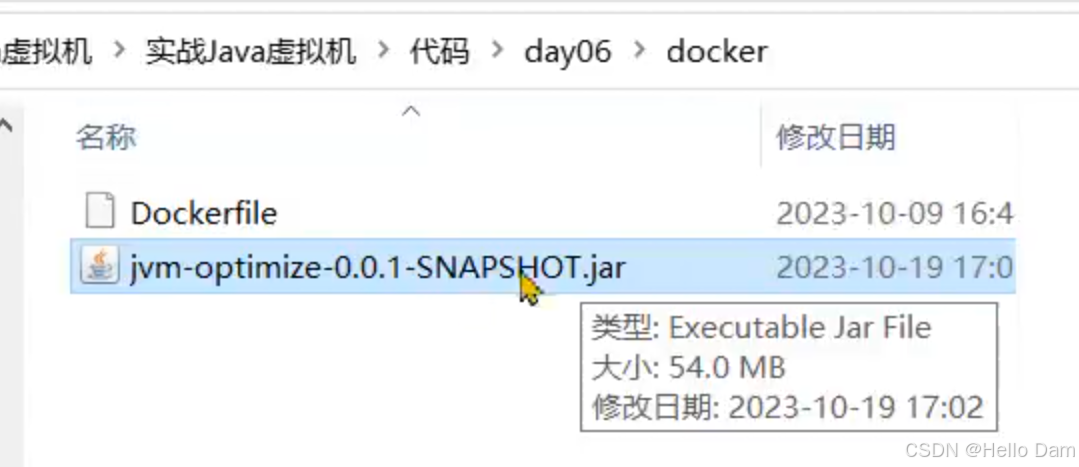
ADD jvm-optimize-0.0.1-SNAPSHOT.jar /app/ (将jar包放到容器的app目录下)
(设置虚拟机运行参数)
CMD ["java", "-Xmx512m", "-Xms512m", "-Dfile.encoding=UTF-8", "-XX:+HeapDumpOnOutOfMemoryError","-XX:HeapDumpPath=/opt/dump/heapdump.hprof","-jar", "/app/jvm-optimize-0.0.1-SNAPSHOT.jar"]
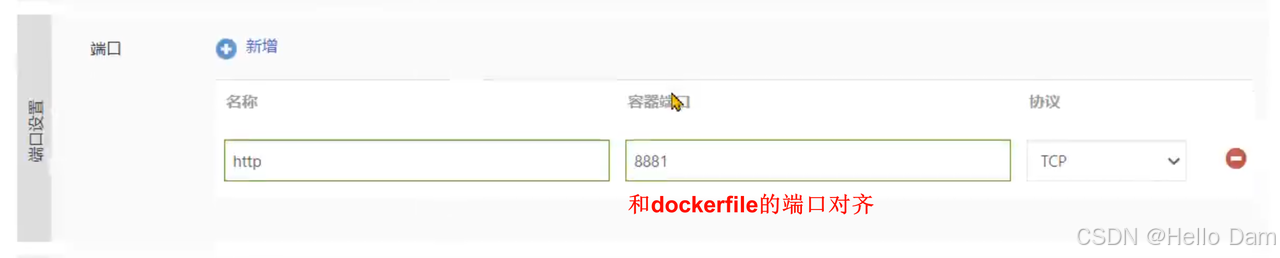
(暴露SpringBoot启动的端口)
EXPOSE 8881生成完成之后,需要将jar和dockerfile上传到服务器上面
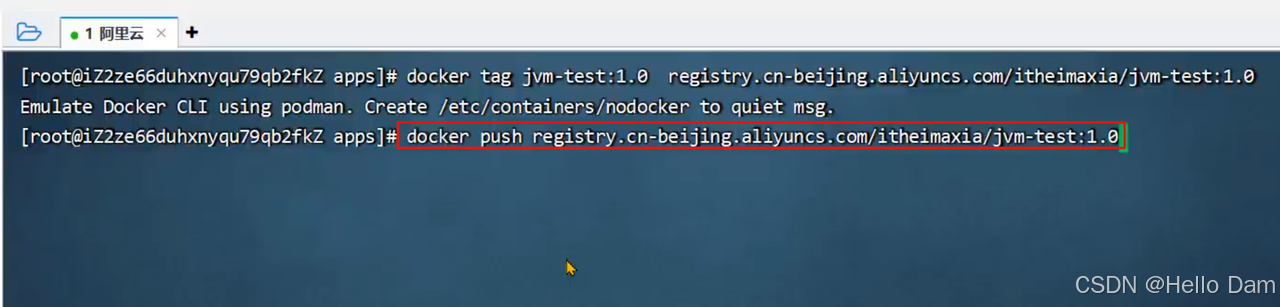
3、按照阿里云的教程执行命令:
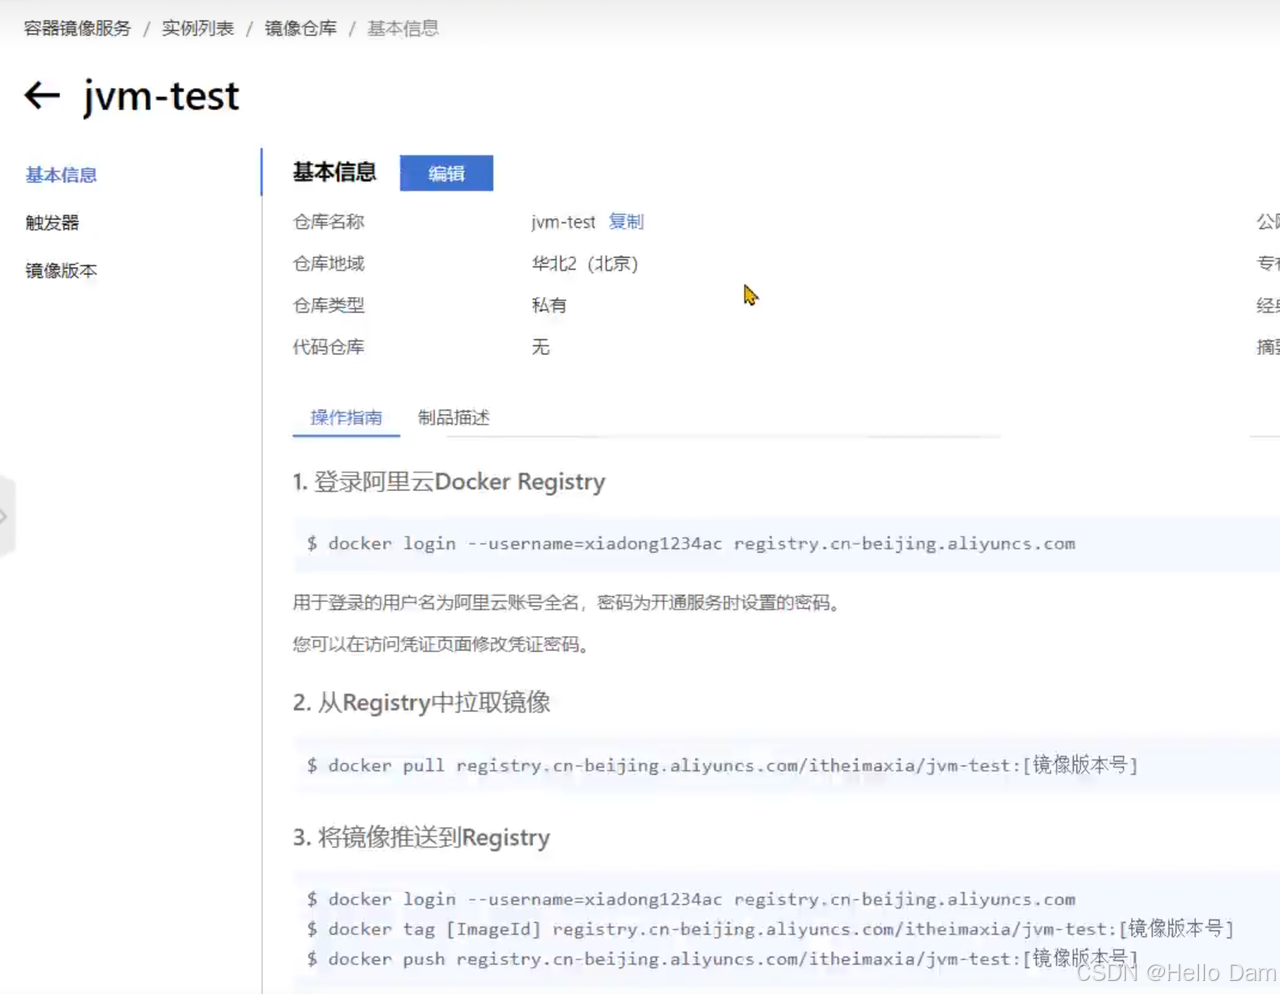
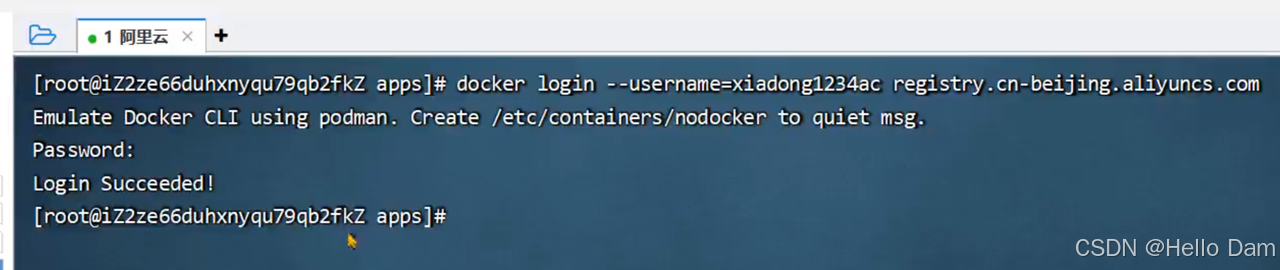
设置密码
制作镜像
使用docker images查看镜像,
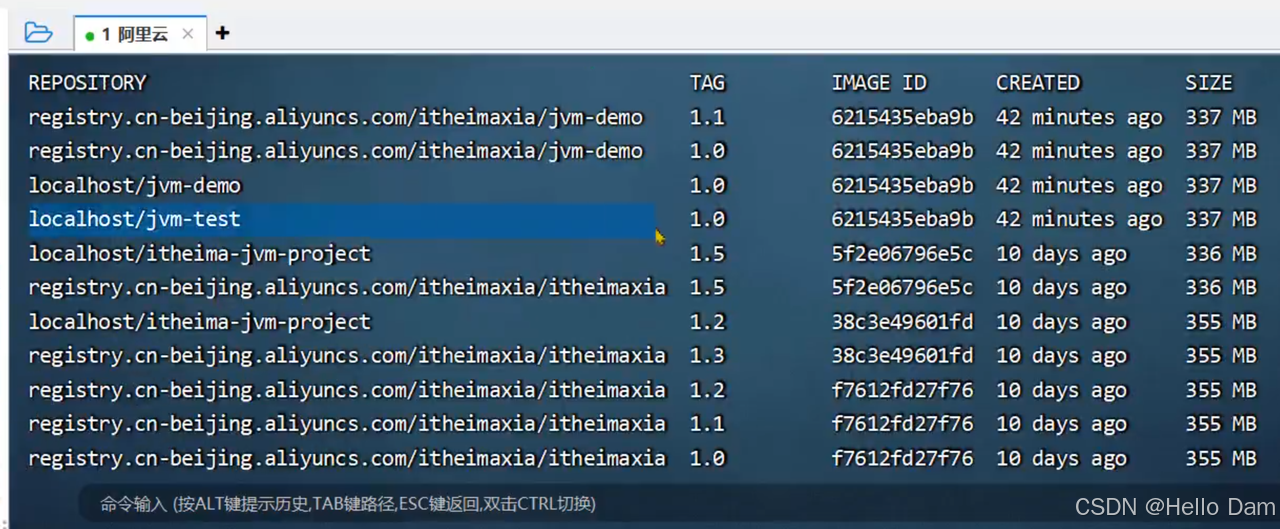
给这个镜像打一个标签
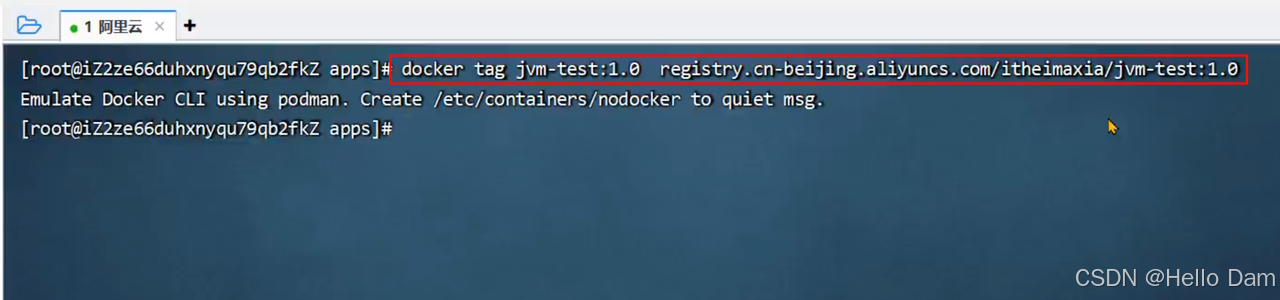
推送镜像
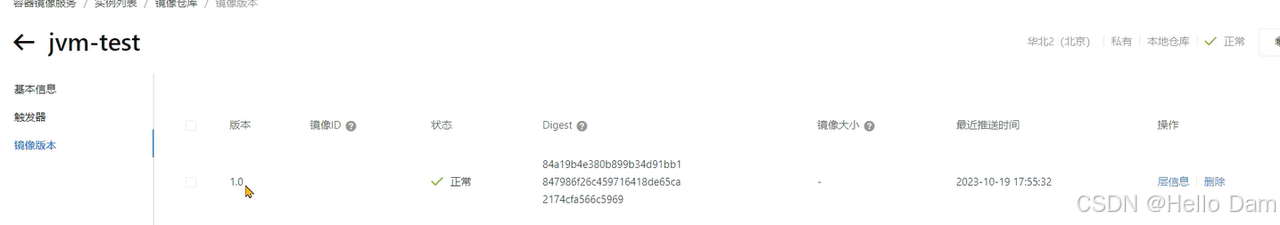
4、推送成功之后,镜像仓库中已经出现了镜像:
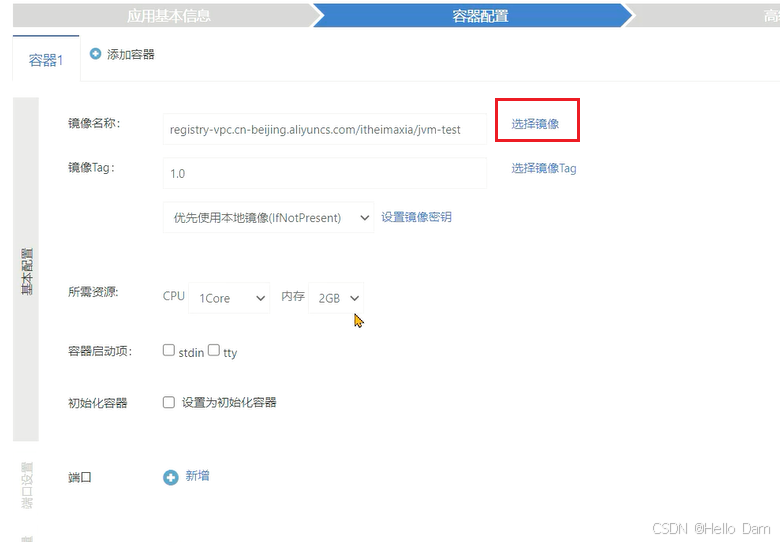
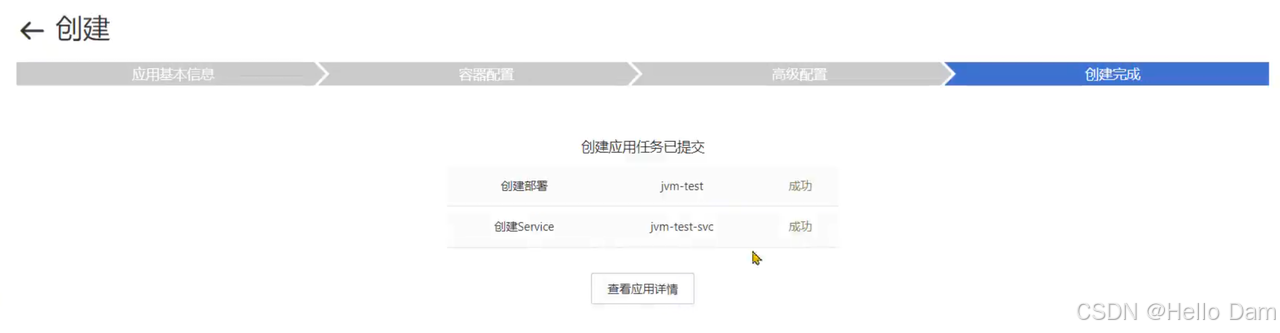
5、通过镜像构建k8s中的pod:
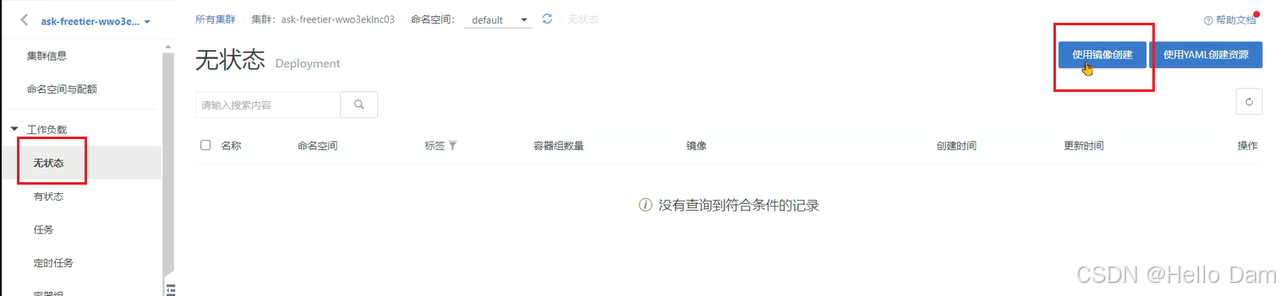
6、选择刚才的镜像:
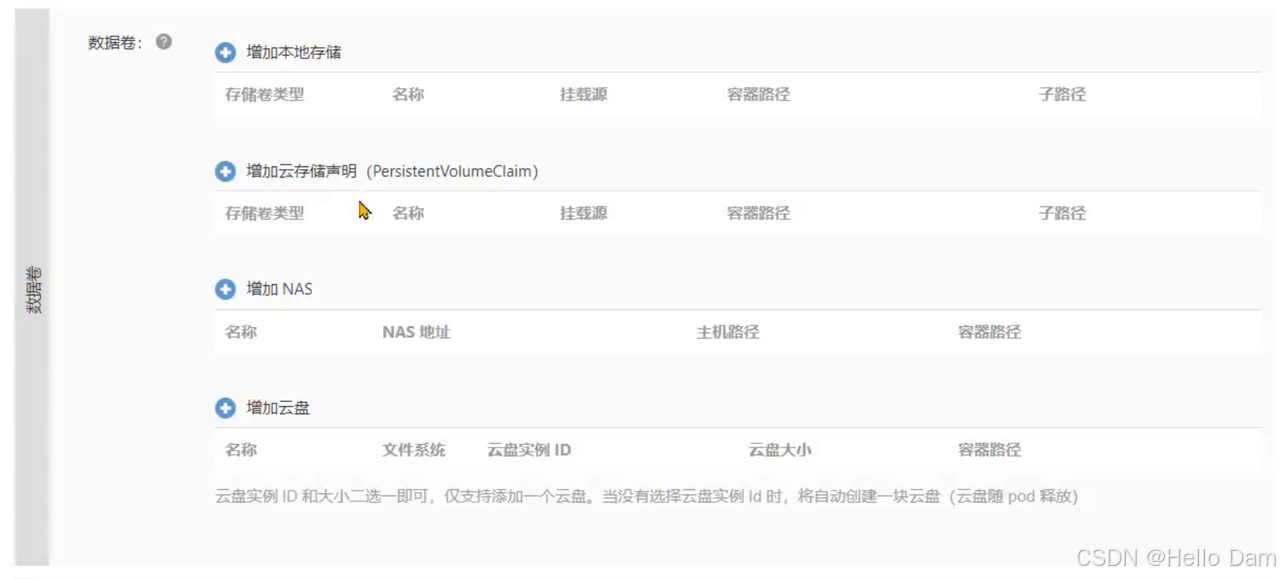
还需要添加和阿里云OSS关联的数据卷
7、在OSS中创建一个Bucket:
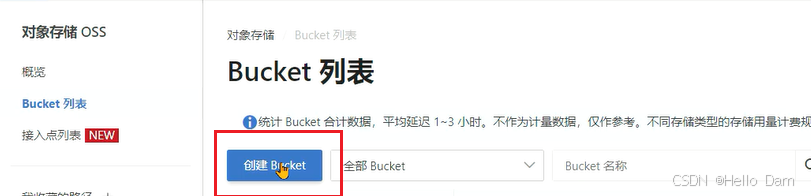
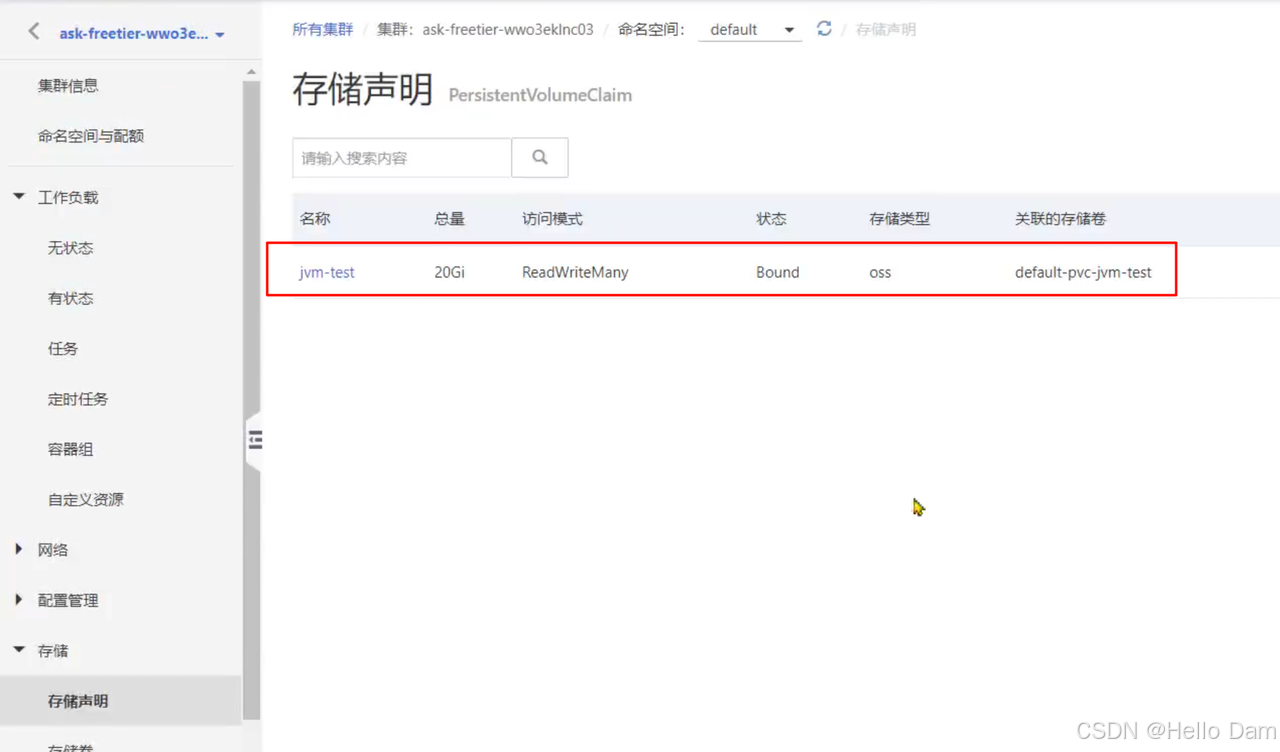
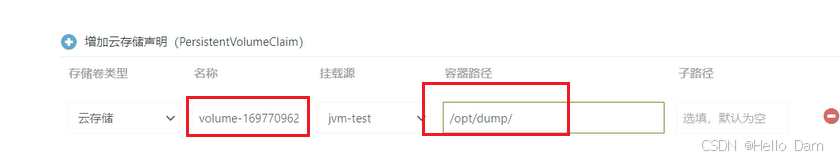
8、创建存储声明,选择刚才的Bucket:
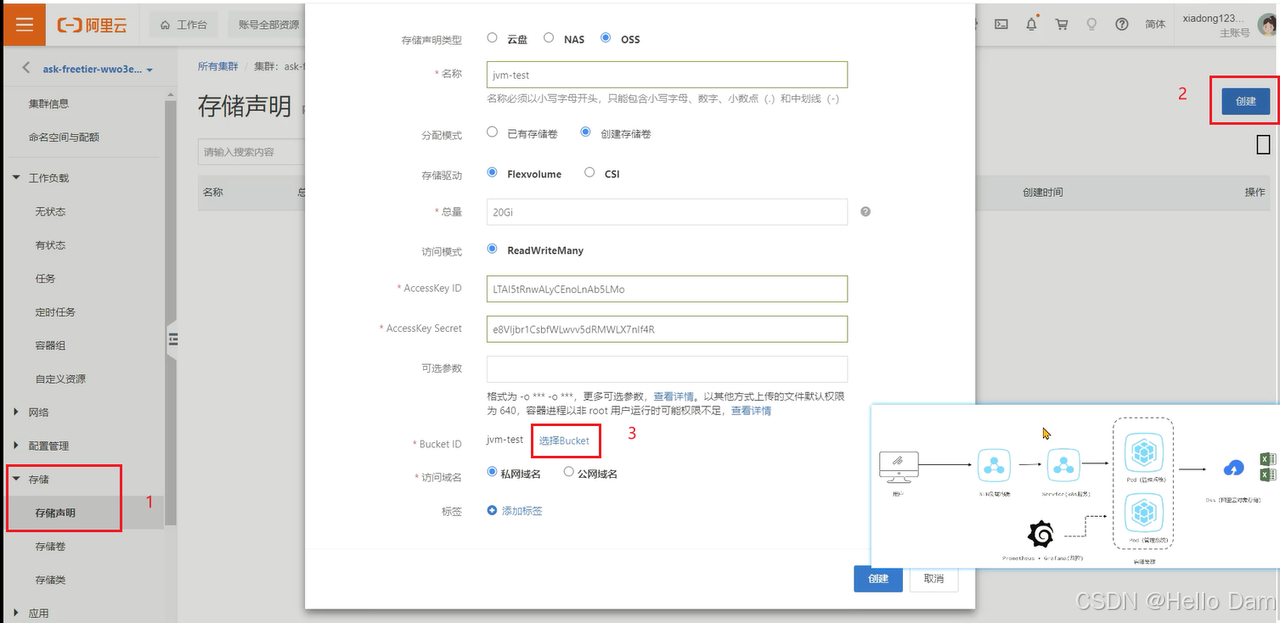
到这里,OSS和容器的关联就建立完成了
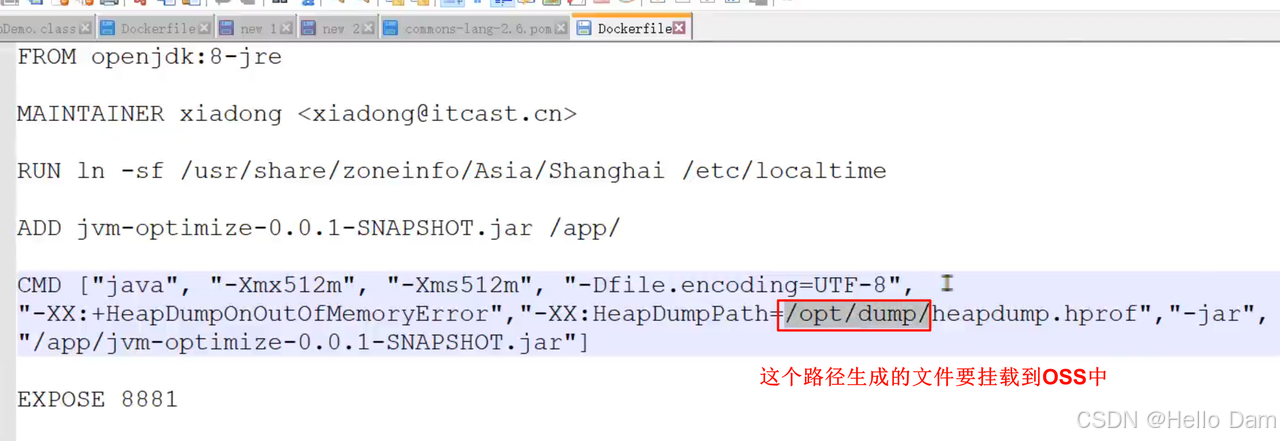
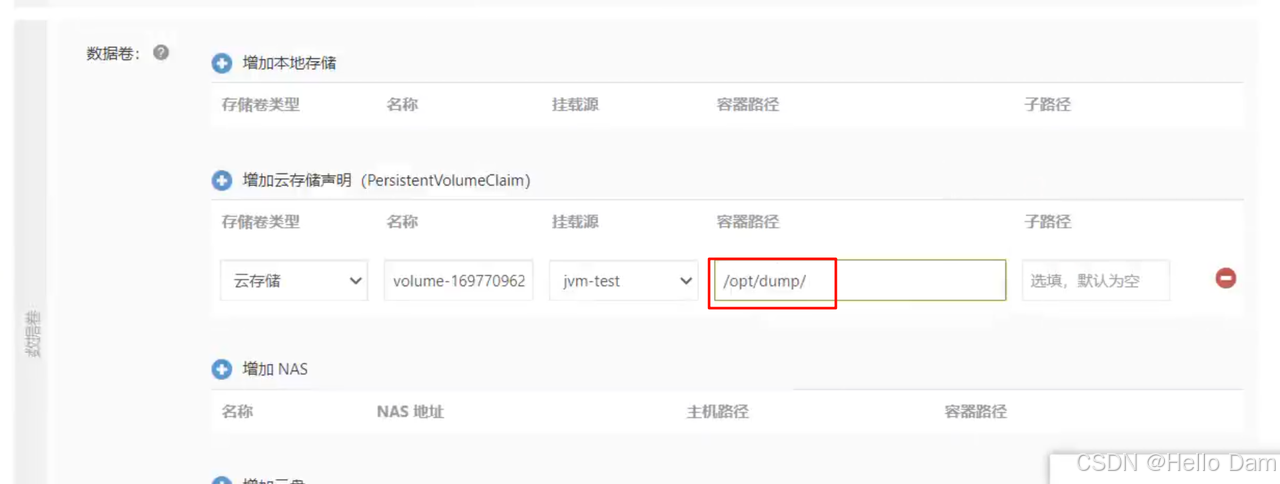
9、选择这个存储声明,并添加hprof文件生成的路径映射,要和Dockerfile中虚拟机参数里的路径相同:
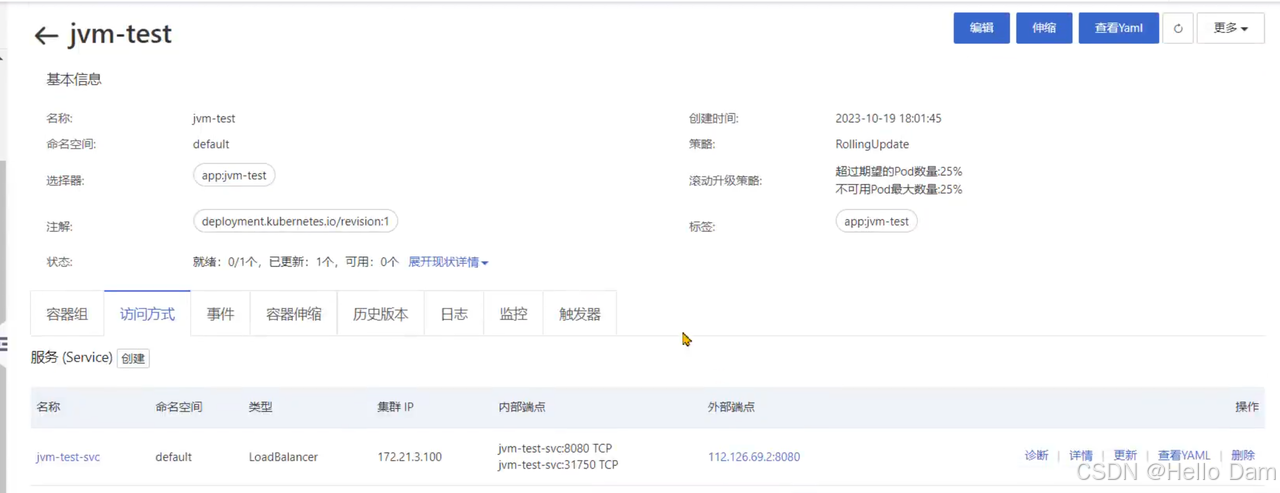
10、创建一个service,填写配置,方便外网进行访问。
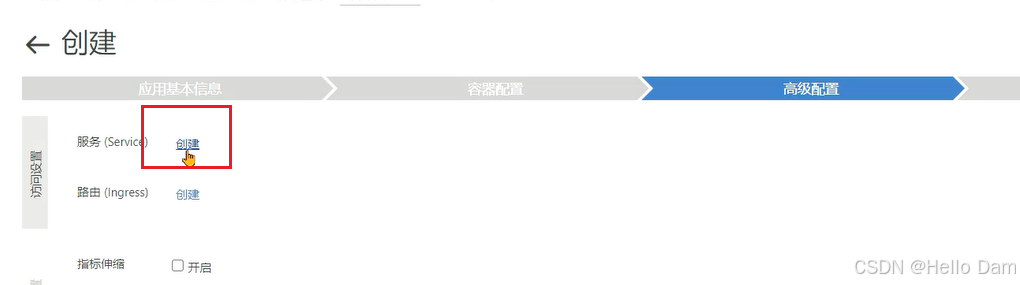
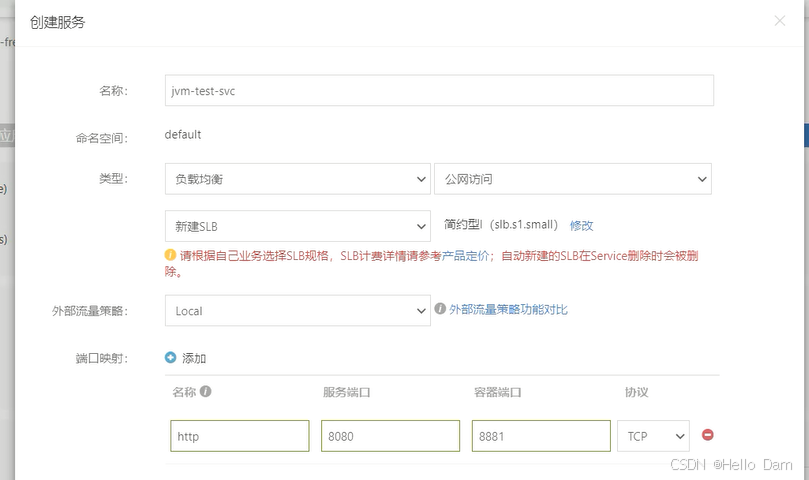
服务端口是对外网暴露的端口
服务的相关信息
内存溢出测试
打开jmeter文件并测试:
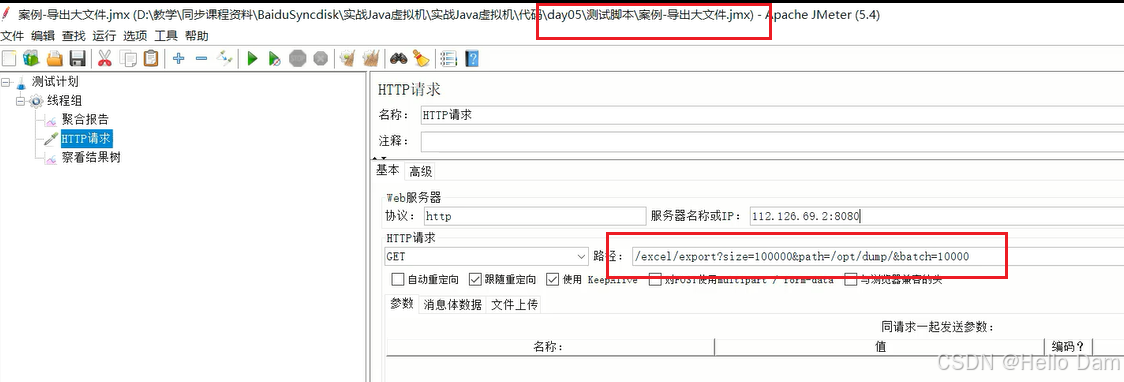
接口代码如下:
java
@GetMapping("/export")
public void export(int size, String path) throws IOException {
    // 1 、创建工作薄
    Workbook workbook = new XSSFWorkbook();
    // 2、在工作薄中创建sheet
    Sheet sheet = workbook.createSheet("测试");

    for (int i = 0; i < size; i++) {
        // 3、在sheet中创建行
        Row row0 = sheet.createRow(i);
        // 4、创建单元格并存入数据
        row0.createCell(0).setCellValue(RandomStringUtils.randomAlphabetic(1000));
    }

    // 将文件输出到指定文件
    FileOutputStream fileOutputStream = null;
    try {
        fileOutputStream = new FileOutputStream(path + RandomStringUtils.randomAlphabetic(10) + ".xlsx");
        workbook.write(fileOutputStream);
    } catch (Exception e) {
        e.printStackTrace();
    } finally {
        if (fileOutputStream != null) {
            fileOutputStream.close();
        }
        if (workbook != null) {
            workbook.close();
        }
    }

}
测试,将文件生成到OSS中
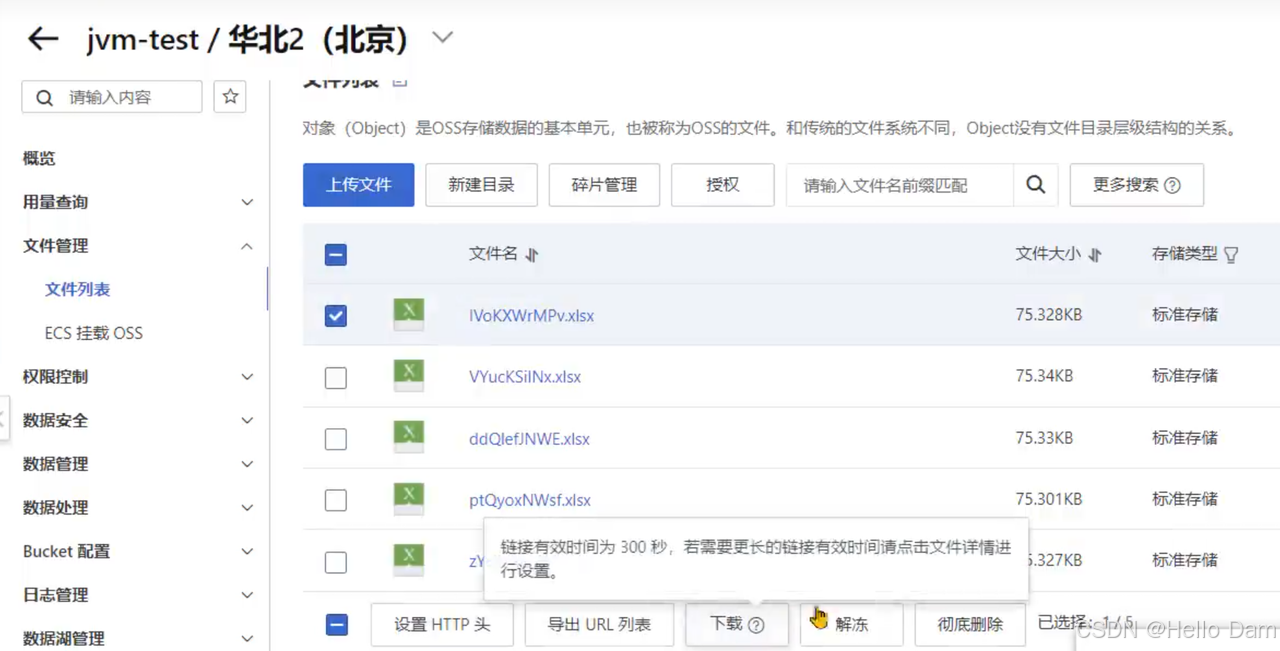
12、OSS中出现了这个hprof文件:
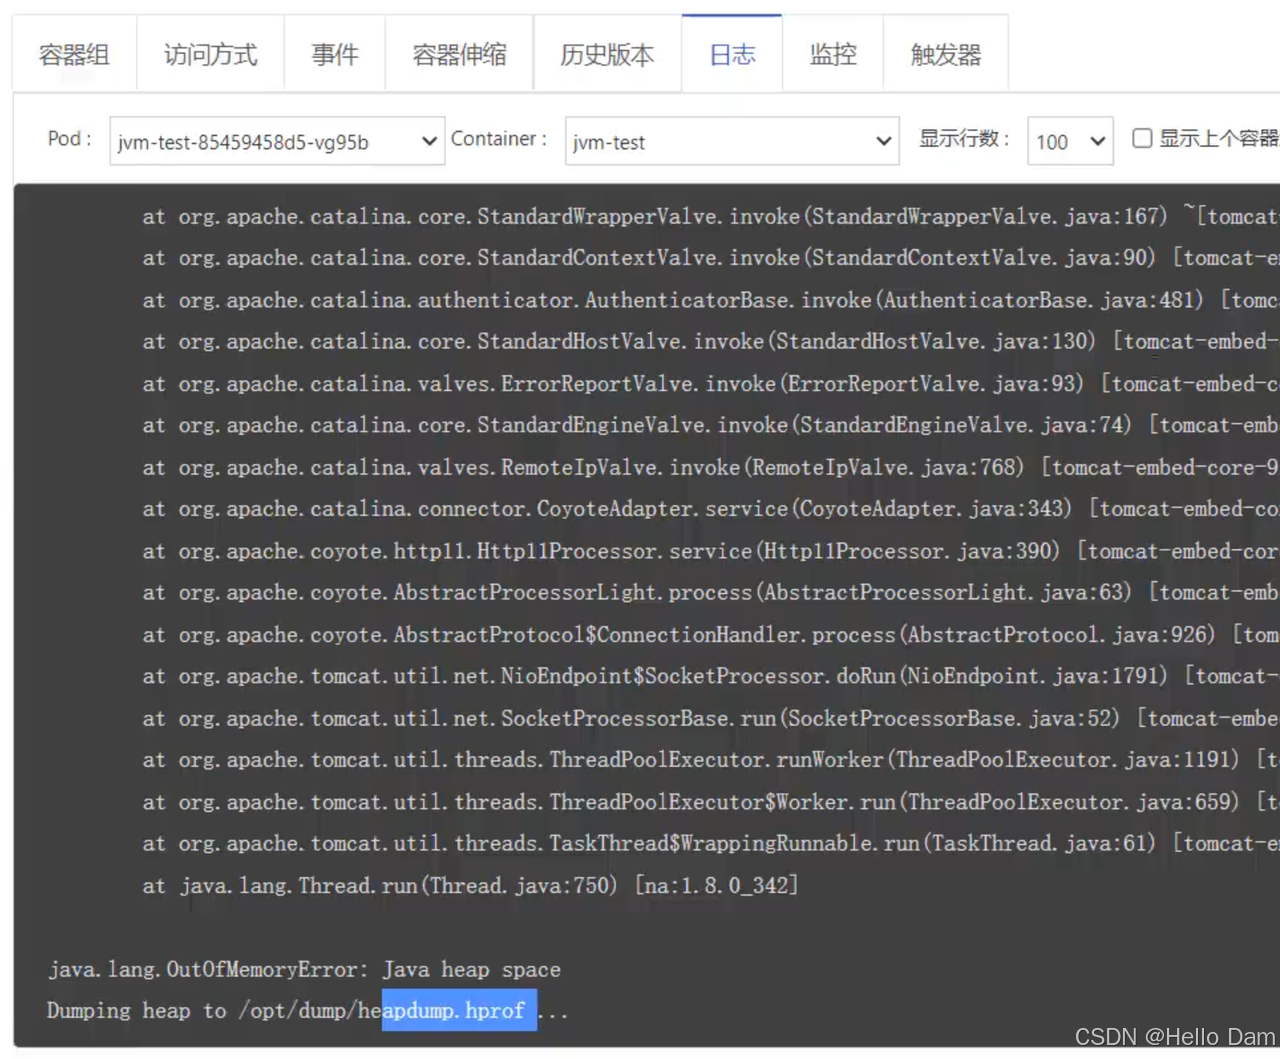
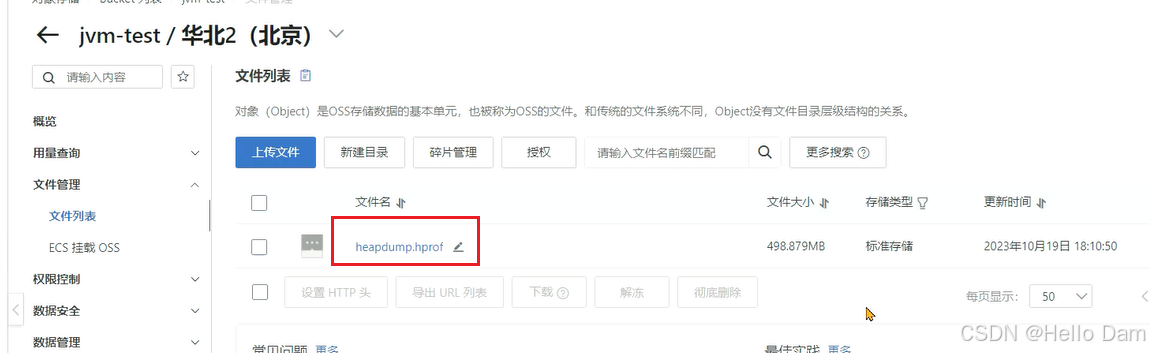
13、从直方图就可以看到是导出文件导致的内存溢出:
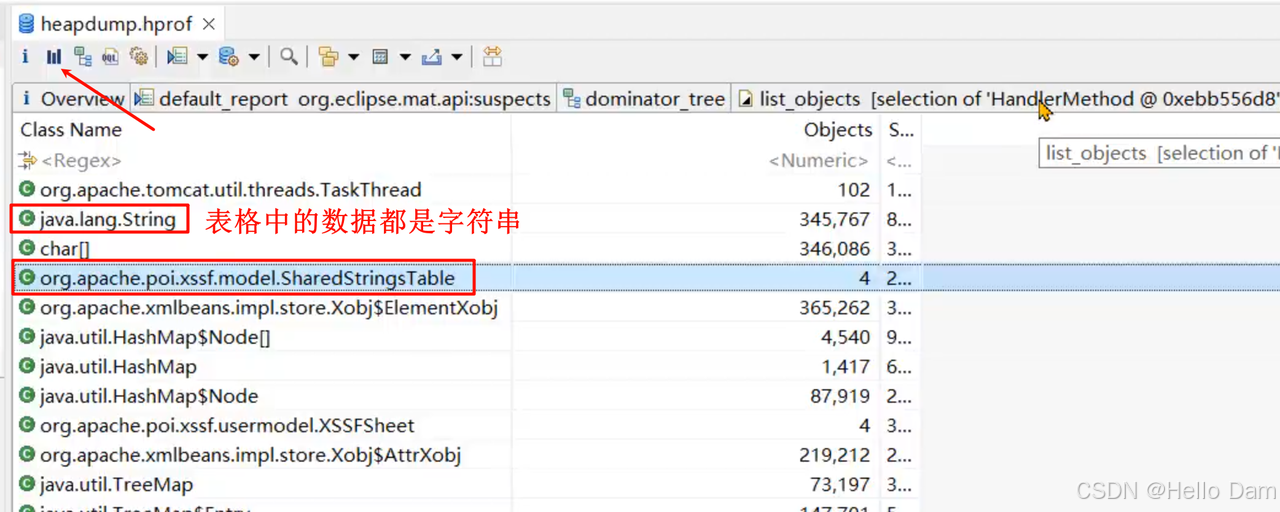
问题根源:
Excel文件导出如果使用POI的XSSFWorkbook,在大数据量(几十万)的情况下会占用大量的内存。
代码:com.itheima.jvmoptimize.practice.oom.controller.Demo2ExcelController
解决思路:
1、使用poi的SXSSFWorkbook(XSSFWorkbook的优化版本)
2、hutool提供的BigExcelWriter减少内存开销(Hutool的工具类更加好用,专门用来导出大文件)
shell
 //http://www.hutool.cn/docs/#/poi/Excel%E5%A4%A7%E6%95%B0%E6%8D%AE%E7%94%9F%E6%88%90-BigExcelWriter
@GetMapping("/export_hutool")
public void export_hutool(int size, String path) throws IOException {
    List<List<?>> rows = new ArrayList<>();
    for (int i = 0; i < size; i++) {
       rows.add( CollUtil.newArrayList(RandomStringUtils.randomAlphabetic(1000)));
    }

    BigExcelWriter writer= ExcelUtil.getBigWriter(path + RandomStringUtils.randomAlphabetic(10) + ".xlsx");
    // 一次性写出内容,使用默认样式
    writer.write(rows);
    // 关闭writer,释放内存
    writer.close();
}
3、使用easy excel,对内存进行了大量的优化(效果最好,强烈推荐)
不需要把所有要导出的数据放在内存中,可以分批写入,每次写入部分数据
shell
//https://easyexcel.opensource.alibaba.com/docs/current/quickstart/write#%E9%87%8D%E5%A4%8D%E5%A4%9A%E6%AC%A1%E5%86%99%E5%85%A5%E5%86%99%E5%88%B0%E5%8D%95%E4%B8%AA%E6%88%96%E8%80%85%E5%A4%9A%E4%B8%AAsheet
@GetMapping("/export_easyexcel")
public void export_easyexcel(int size, String path,int batch) throws IOException {

    // 方法1: 如果写到同一个sheet
    String fileName = path + RandomStringUtils.randomAlphabetic(10) + ".xlsx";
    // 这里注意 如果同一个sheet只要创建一次
    WriteSheet writeSheet = EasyExcel.writerSheet("测试").build();
    // 这里 需要指定写用哪个class去写
    try (ExcelWriter excelWriter = EasyExcel.write(fileName, DemoData.class).build()) {
        // 分100次写入
        for (int i = 0; i < batch; i++) {
            // 分页去数据库查询数据 这里可以去数据库查询每一页的数据
            List<DemoData> datas = new ArrayList<>();
            for (int j = 0; j < size / batch; j++) {
                DemoData demoData = new DemoData();
                demoData.setString(RandomStringUtils.randomAlphabetic(1000));
                datas.add(demoData);
            }
            excelWriter.write(datas, writeSheet);
            //写入之后datas数据就可以释放了
        }
    }

}
案例4:ThreadLocal使用时占用大量内存
背景:小李负责了一个微服务,但是他发现系统在没有任何用户使用时,也占用了大量的内存,导致可以使用的内存大大减少。
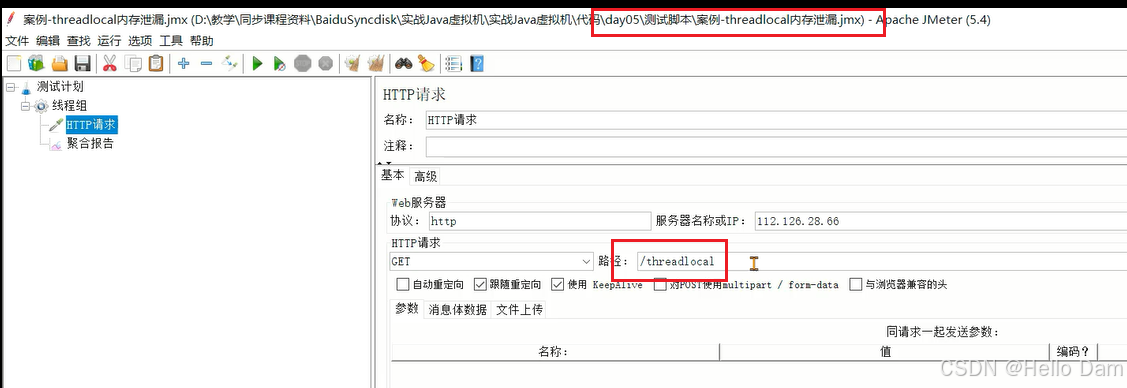
1、打开jmeter测试脚本
【接口内容】
java
import com.itheima.jvmoptimize.practice.demo.service.TbArticleService;
import org.springframework.http.ResponseEntity;
import org.springframework.web.bind.annotation.GetMapping;
import org.springframework.web.bind.annotation.RequestMapping;
import org.springframework.web.bind.annotation.RestController;

import javax.annotation.Resource;
import java.util.List;
import java.util.Random;
import java.util.stream.Collectors;

/**
 * -Xmx1g -Xms1g
 * -XX:+HeapDumpOnOutOfMemoryError -XX:HeapDumpPath=D:/jvm/dump/heapdemo.hprof
 */
@RestController
@RequestMapping("/threadlocal")
public class DemoThreadLocal {

    @GetMapping
    public ResponseEntity test() {
        // 一进来就抛异常
        error();
        return ResponseEntity.ok().build();
    }

    private void error() {
        throw new RuntimeException("出错了");
    }

}
测试结果
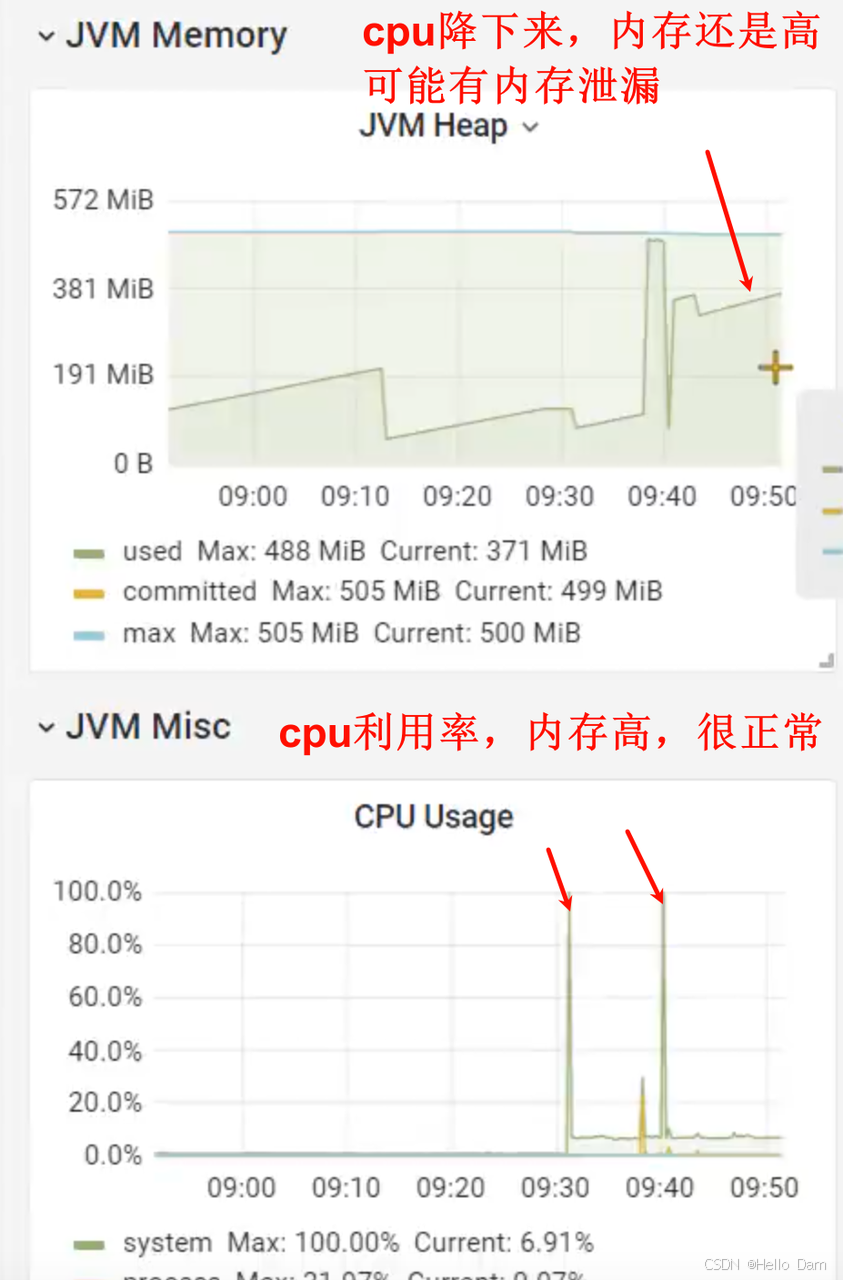
2、内存有增长,但是没溢出。所以通过jmap命令导出hprof文件

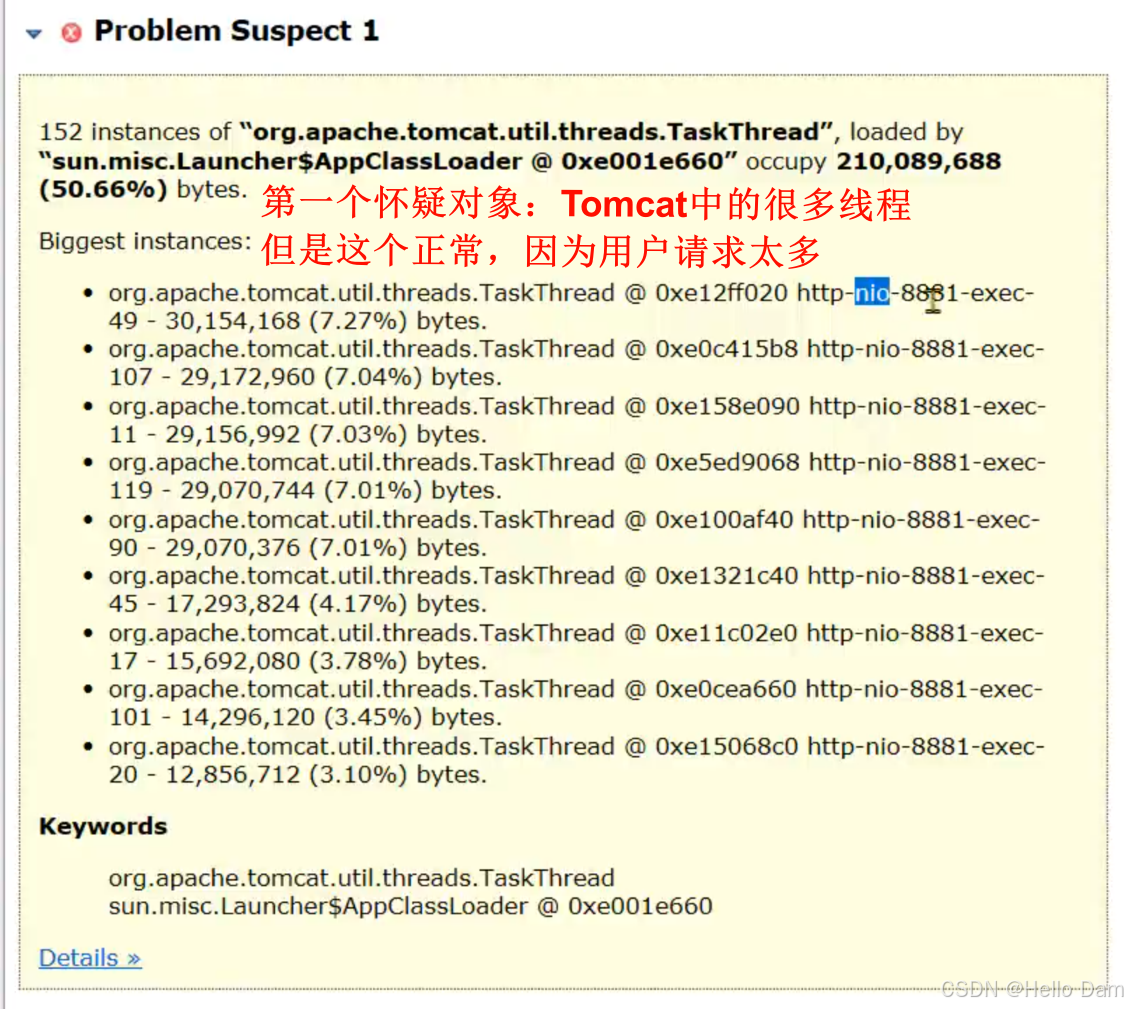
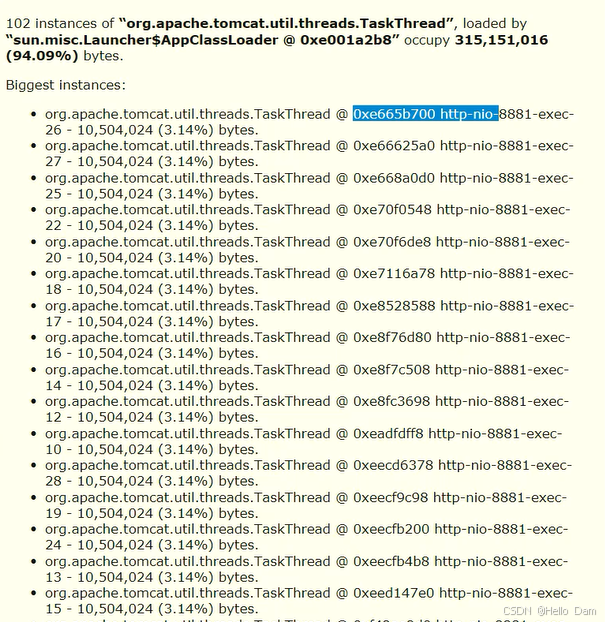
3、MAT分析之后发现每个线程中都包含了大量的对象:
4、在支配树中可以发现是ThreadLocalMap导致的内存增长:
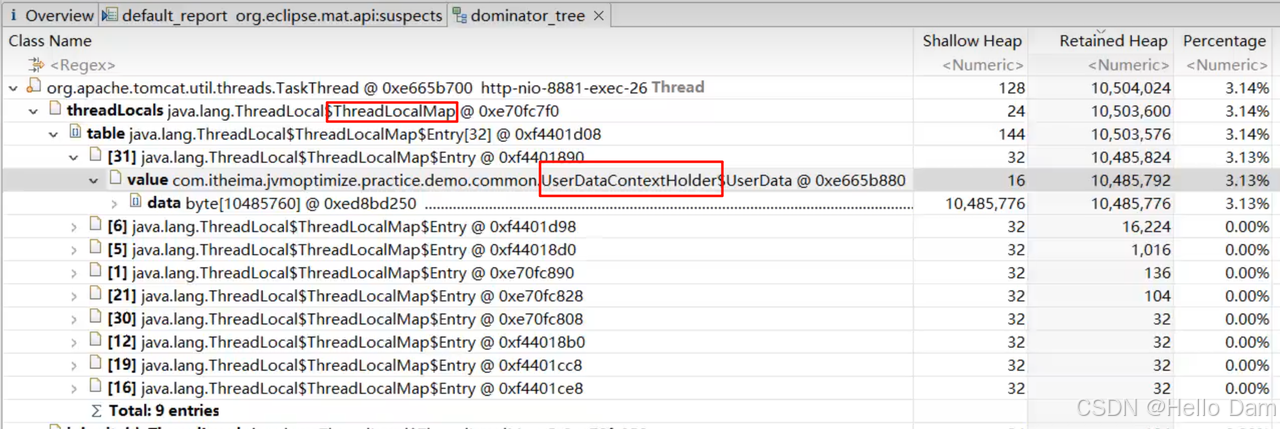
10M大小的来源
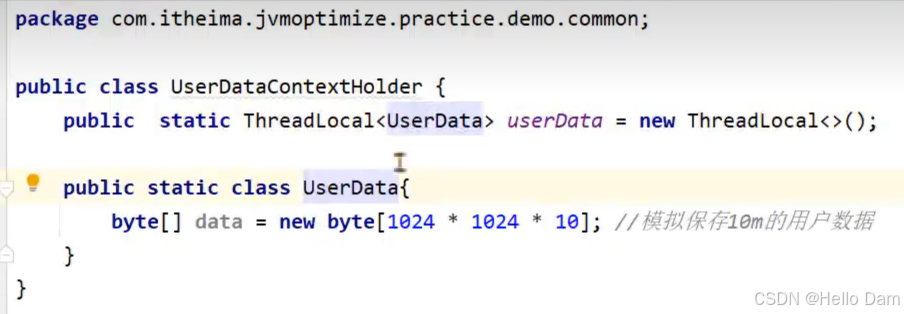
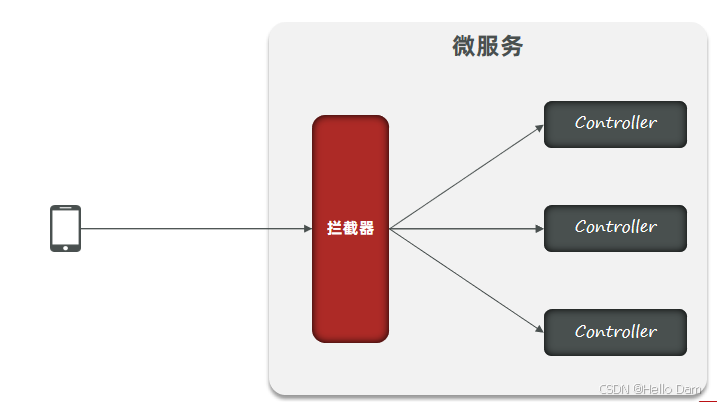
当用户请求过来的时候,微服务的拦截器根据用户的请求头信息在内存中组装一个对象放到ThreadLocal中,方便后续在Controller层、Service层进行使用。按理说,请求结束之后,拦截器就要把这部分内存释放掉,但是这里可能存在某些问题导致内存没有释放
5、ThreadLocalMap就是ThreadLocal对象保存数据的地方,所以只要分析ThreadLocal代码即可。在拦截器中,ThreadLocal清理的代码被错误的放在postHandle中,如果接口发生了异常,这段代码不会调用到,这样就产生了内存泄漏,将其移动到afterCompletion(这个方法一定会执行)就可以了。
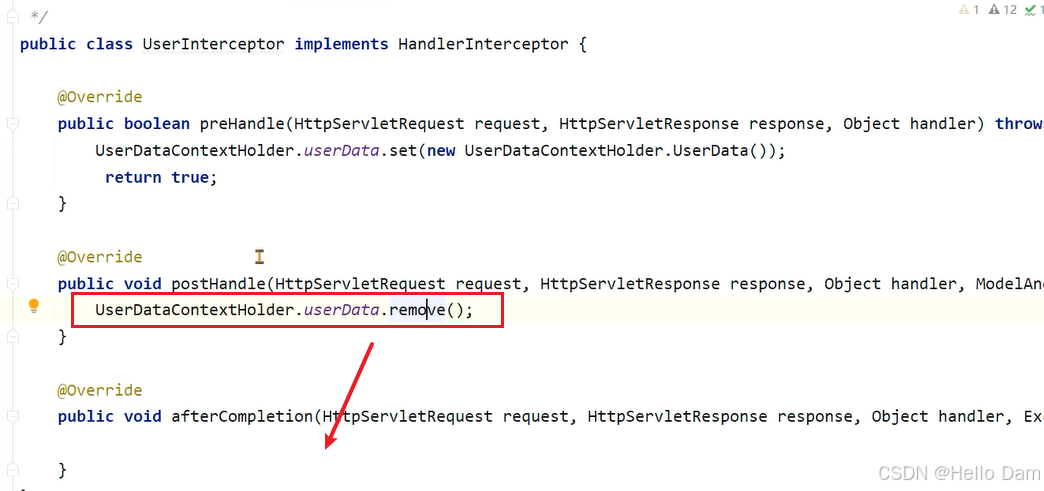
修正之后的代码:
java
import com.itheima.jvmoptimize.practice.demo.common.UserDataContextHolder;
import org.springframework.web.servlet.HandlerInterceptor;
import org.springframework.web.servlet.ModelAndView;

import javax.servlet.http.HttpServletRequest;
import javax.servlet.http.HttpServletResponse;

/**
 * 拦截器的实现,模拟放入数据到threadlocal中
 */
public class UserInterceptor implements HandlerInterceptor {

    @Override
    public boolean preHandle(HttpServletRequest request, HttpServletResponse response, Object handler) throws Exception {
        UserDataContextHolder.userData.set(new UserDataContextHolder.UserData());
         return true;
    }

    @Override
    public void postHandle(HttpServletRequest request, HttpServletResponse response, Object handler, ModelAndView modelAndView) throws Exception {

    }

    @Override
    public void afterCompletion(HttpServletRequest request, HttpServletResponse response, Object handler, Exception ex) throws Exception {
        UserDataContextHolder.userData.remove();
    }
}
按理说,请求结束之后,tomcat中线程池的线程长时间不用的话,会被回收,那线程里面的数据也会被回收,这里为什么不会被回收呢?
原因:核心线程就算空闲,也不会回收,这部分线程里面的对象内存会积压
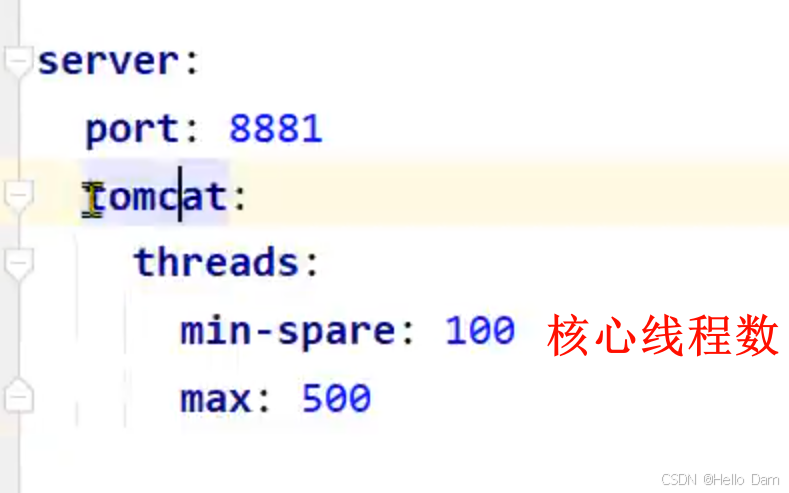
min-spare计算设置为0,最后还是会有10个核心线程是保留的
问题根源和解决思路:
很多微服务会选择在拦截器preHandle方法中去解析请求头中的数据,并放入一些数据到ThreadLocal中方便后续使用。在拦截器的afterCompletion方法中,必须要将ThreadLocal中的数据清理掉。
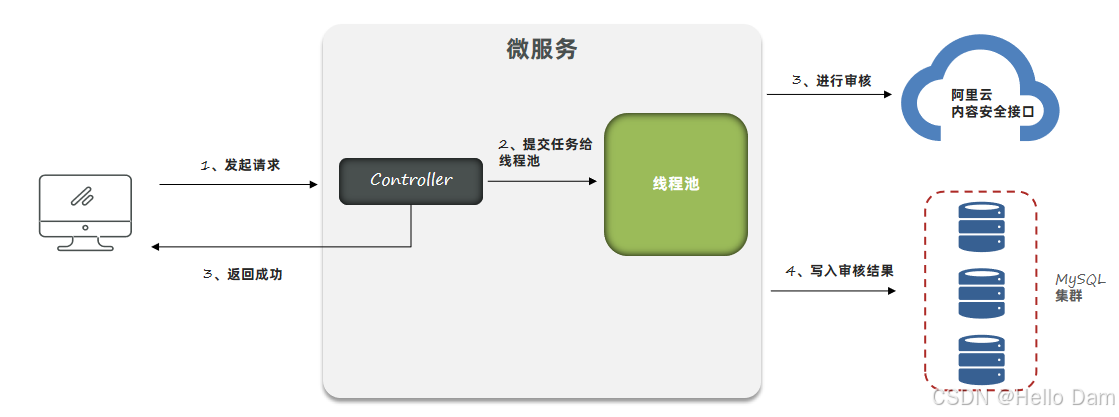
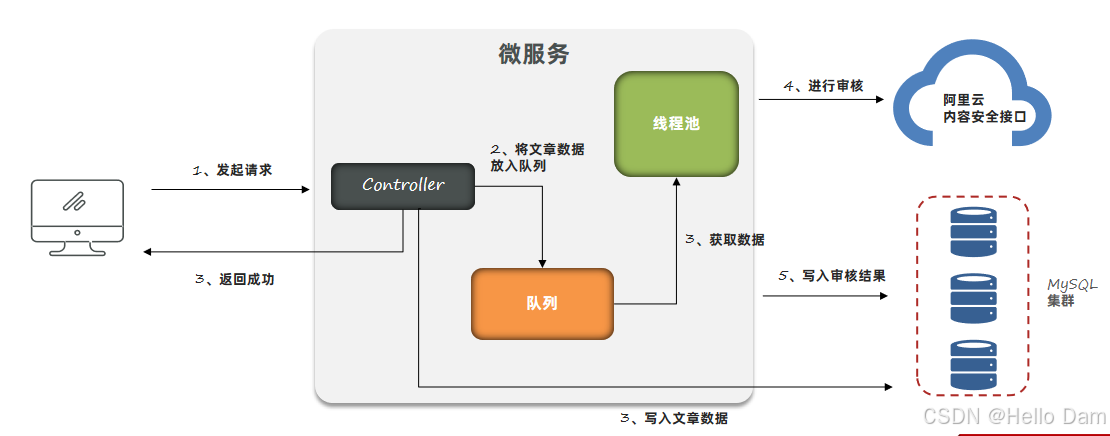
案例5:文章内容审核接口的内存问题
背景:文章微服务中提供了文章审核接口,会调用阿里云的内容安全接口进行文章中文字和图片的审核 ,在自测过程中出现内存占用较大的问题。

设计1:使用SpringBoot中的@Async注解进行异步的审核。
com.itheima.jvmoptimize.practice.oom.controller.Demo1ArticleController类中的article1方法
使用线程池:做异步审核,提交审核就返回给用户,不用等到审核结束。
Spring Bootr中使用@Async注解,即可完成异步功能实现。
【Controller】
java
package com.itheima.jvmoptimize.practice.demo.controller;

import cn.hutool.json.JSON;
import com.fasterxml.jackson.core.JsonProcessingException;
import com.fasterxml.jackson.databind.ObjectMapper;
import com.itheima.jvmoptimize.practice.demo.pojo.ArticleDto;
import com.itheima.jvmoptimize.practice.demo.service.ArticleService;
import org.springframework.amqp.rabbit.core.RabbitTemplate;
import org.springframework.beans.factory.annotation.Autowired;
import org.springframework.web.bind.annotation.*;

/**
 * -XX:+HeapDumpOnOutOfMemoryError
 */
@RestController
@RequestMapping("/article")
public class Demo1ArticleController {

    @Autowired
    private ArticleService articleService;

    @PostMapping("/demo1/{id}")
    public void article1(@PathVariable("id") long id, @RequestBody ArticleDto article){
        article.setId(id);
        articleService.asyncSaveArticle(article);
    }

}
【Service】
java
import com.itheima.jvmoptimize.practice.demo.pojo.ArticleDto;
import com.itheima.jvmoptimize.practice.demo.service.ArticleService;
import com.itheima.jvmoptimize.practice.demo.utils.AliyunUtil;
import org.springframework.beans.factory.annotation.Autowired;
import org.springframework.scheduling.annotation.Async;
import org.springframework.stereotype.Service;
import static com.itheima.jvmoptimize.practice.demo.config.ThreadPoolTaskConfig.BUFFER_QUEUE;
@Service
public class ArticleServiceImpl implements ArticleService {
@Autowired
private AliyunUtil aliyunUtil;
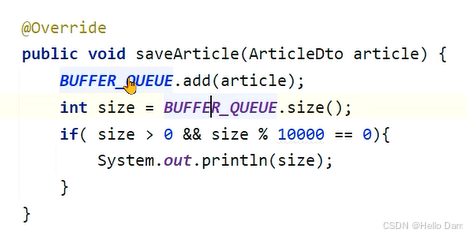
@Override
public void saveArticle(ArticleDto article) {
BUFFER_QUEUE.add(article);
int size = BUFFER_QUEUE.size();
if( size > 0 && size % 10000 == 0){
System.out.println(size);
}
}
@Override
// asyncTaskExecutor是线程池的名字,通过线程池来执行下面的方法
@Async("asyncTaskExecutor")
public void asyncSaveArticle(ArticleDto article) {
// 阿里云安全审核
aliyunUtil.verify(article.getTitle() + "。" + article.getContent());
}
}
package com.itheima.jvmoptimize.practice.demo.utils;
import org.springframework.stereotype.Component;
/**
* 休眠是模拟安全审核慢,速度跟不上文章产生的速度,才会造成内存积压
*/
@Component
public class AliyunUtil {
//阿里云审核接口调用
public void verify(String content){
try {
/**
* 调用第三方接口审核数据,但是此时网络出现问题,
* 第三方接口长时间没有响应,此处使用休眠来模拟30秒
*/
Thread.sleep(30 * 1000);
} catch (InterruptedException e) {
e.printStackTrace();
}
}
}
【线程池配置】
package com.itheima.jvmoptimize.practice.demo.config;
import org.springframework.context.annotation.Bean;
import org.springframework.context.annotation.Configuration;
import org.springframework.scheduling.annotation.EnableAsync;
import org.springframework.scheduling.concurrent.ThreadPoolTaskExecutor;
import java.util.concurrent.ThreadPoolExecutor;
@Configuration
@EnableAsync
public class AsyncThreadPoolTaskConfig {
private static final int corePoolSize = 50; // 核心线程数(默认线程数)
private static final int maxPoolSize = 100; // 最大线程数
private static final int keepAliveTime = 10; // 允许线程空闲时间(单位:默认为秒)
private static final int queueCapacity = 200; // 缓冲队列数
private static final String threadNamePrefix = "Async-Task-"; // 线程池名前缀
@Bean("asyncTaskExecutor")
public ThreadPoolTaskExecutor getAsyncExecutor(){
ThreadPoolTaskExecutor executor = new ThreadPoolTaskExecutor();
executor.setCorePoolSize(corePoolSize);
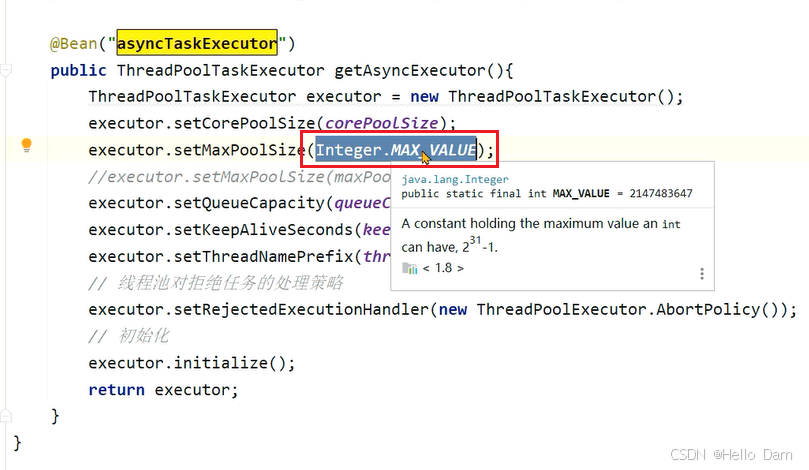
//executor.setMaxPoolSize(Integer.MAX_VALUE);
executor.setMaxPoolSize(maxPoolSize);
executor.setQueueCapacity(queueCapacity);
executor.setKeepAliveSeconds(keepAliveTime);
executor.setThreadNamePrefix(threadNamePrefix);
// 线程池对拒绝任务的处理策略
executor.setRejectedExecutionHandler(new ThreadPoolExecutor.AbortPolicy());
// 初始化
executor.initialize();
return executor;
}
}1、打开jmeter脚本,已经准好了一段测试用的文本。
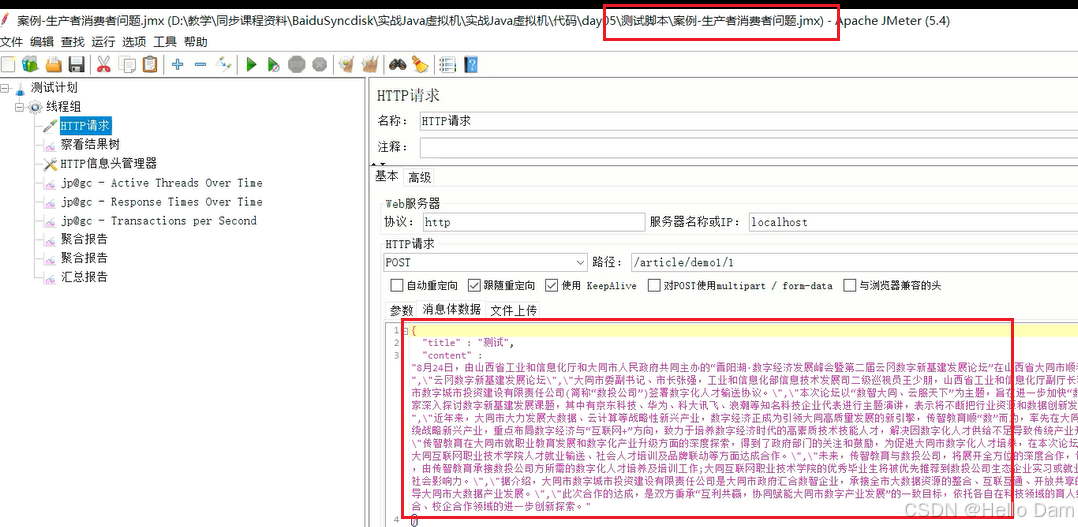
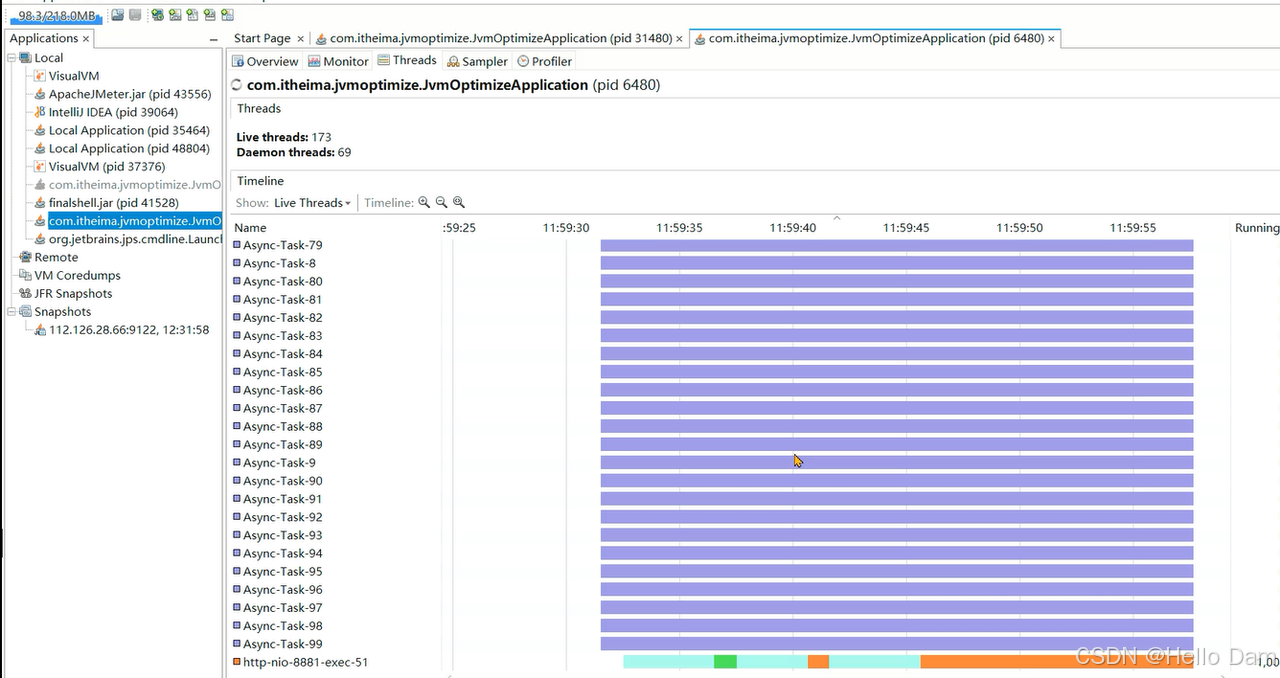
2、运行测试,发现线程数一直在增加:
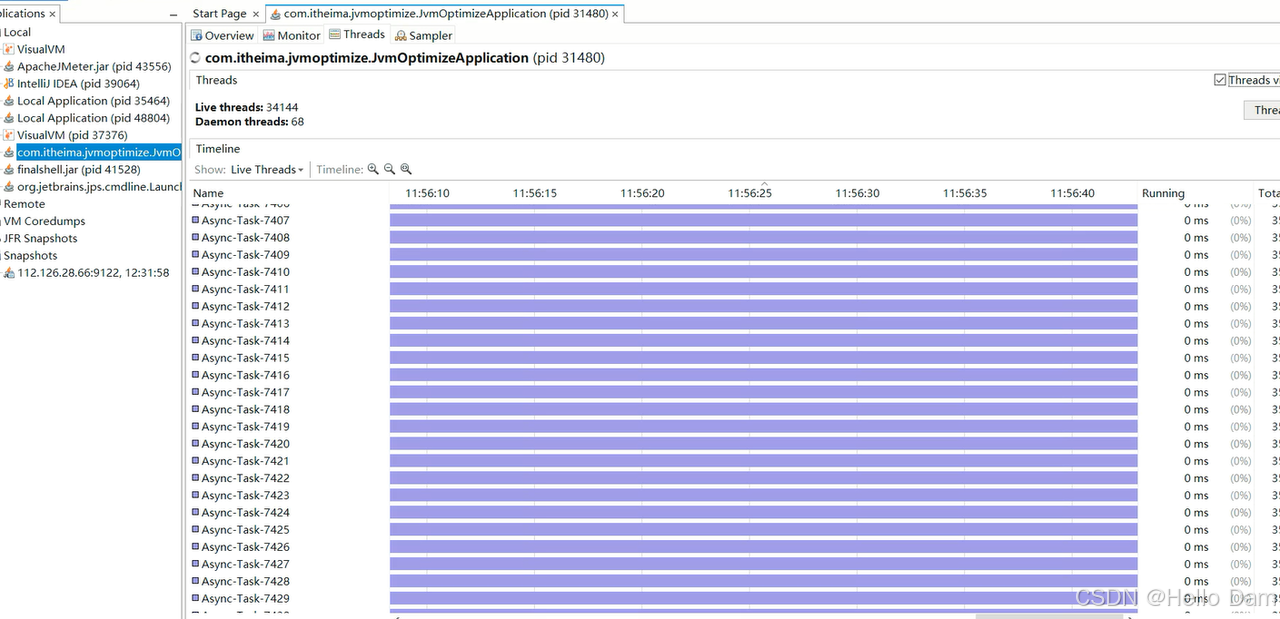
3、发现是因为异步线程池的最大线程数设置了Integer的最大值,所以只要没到上限就一直创建线程:
4、接下来修改为100,再次测试:
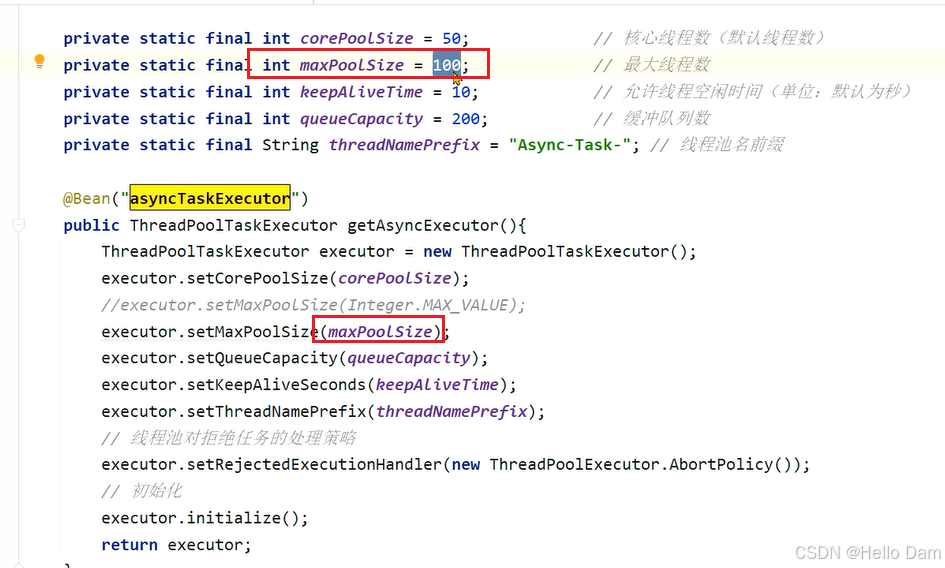
5、这次线程数相对来说比较正常:
存在问题:
1、线程池参数设置不当,会导致大量线程的创建或者队列中保存大量的数据。
2、任务没有持久化,一旦走线程池的拒绝策略或者服务宕机、服务器掉电等情况很有可能会丢失任务。
设计2:使用生产者和消费者模式进行处理,队列数据可以实现持久化到数据库。
【controller】
java
package com.itheima.jvmoptimize.practice.demo.controller;

import cn.hutool.json.JSON;
import com.fasterxml.jackson.core.JsonProcessingException;
import com.fasterxml.jackson.databind.ObjectMapper;
import com.itheima.jvmoptimize.practice.demo.pojo.ArticleDto;
import com.itheima.jvmoptimize.practice.demo.service.ArticleService;
import org.springframework.amqp.rabbit.core.RabbitTemplate;
import org.springframework.beans.factory.annotation.Autowired;
import org.springframework.web.bind.annotation.*;

/**
 * -XX:+HeapDumpOnOutOfMemoryError
 */
@RestController
@RequestMapping("/article")
public class Demo1ArticleController {

    @Autowired
    private ArticleService articleService;

    @PostMapping("/demo2/{id}")
    public void article2(@PathVariable("id") long id, @RequestBody ArticleDto article){
        article.setId(id);
        articleService.saveArticle(article);
    }
}
【队列】
java
package com.itheima.jvmoptimize.practice.demo.config;
import com.itheima.jvmoptimize.practice.demo.pojo.ArticleDto;
import org.springframework.context.annotation.Bean;
import org.springframework.context.annotation.Configuration;
import org.springframework.scheduling.annotation.EnableAsync;
import org.springframework.scheduling.concurrent.ThreadPoolTaskExecutor;
import java.util.concurrent.BlockingQueue;
import java.util.concurrent.LinkedBlockingQueue;
import java.util.concurrent.ThreadPoolExecutor;
@Configuration
@EnableAsync
public class ThreadPoolTaskConfig {
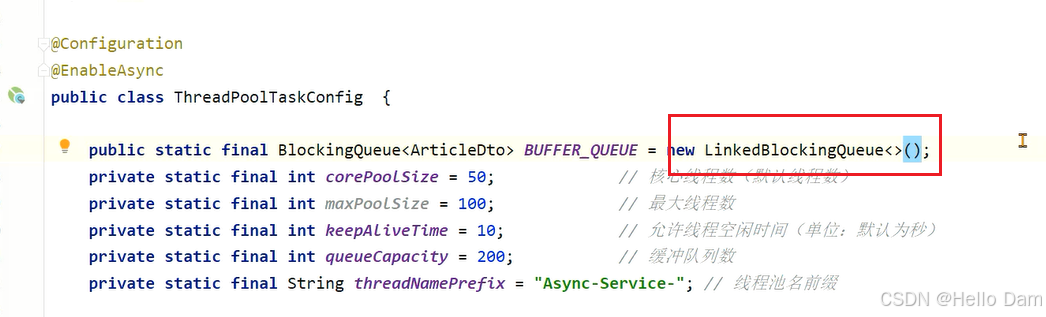
public static final BlockingQueue<ArticleDto> BUFFER_QUEUE = new LinkedBlockingQueue<>();
private static final int corePoolSize = 50; // 核心线程数(默认线程数)
private static final int maxPoolSize = 100; // 最大线程数
private static final int keepAliveTime = 10; // 允许线程空闲时间(单位:默认为秒)
private static final int queueCapacity = 200; // 缓冲队列数
private static final String threadNamePrefix = "Async-Service-"; // 线程池名前缀
@Bean("taskExecutor")
public ThreadPoolTaskExecutor getAsyncExecutor(){
ThreadPoolTaskExecutor executor = new ThreadPoolTaskExecutor();
executor.setCorePoolSize(corePoolSize);
executor.setMaxPoolSize(Integer.MAX_VALUE);
//executor.setMaxPoolSize(maxPoolSize);
executor.setQueueCapacity(queueCapacity);
executor.setKeepAliveSeconds(keepAliveTime);
executor.setThreadNamePrefix(threadNamePrefix);
// 线程池对拒绝任务的处理策略
executor.setRejectedExecutionHandler(new ThreadPoolExecutor.AbortPolicy());
// 初始化
executor.initialize();
return executor;
}
}【任务】
java
import com.itheima.jvmoptimize.practice.demo.pojo.ArticleDto;
import org.springframework.beans.factory.annotation.Autowired;
import org.springframework.beans.factory.annotation.Qualifier;
import org.springframework.scheduling.concurrent.ThreadPoolTaskExecutor;
import org.springframework.stereotype.Component;

import javax.annotation.PostConstruct;

import static com.itheima.jvmoptimize.practice.demo.config.ThreadPoolTaskConfig.BUFFER_QUEUE;

//@Component
public class ArticleSaveTask {
    @Autowired
    @Qualifier("taskExecutor")
    private ThreadPoolTaskExecutor threadPoolTaskExecutor;

    @PostConstruct
    public void pullArticleTask(){
        for (int i = 0; i < 50; i++) {
            // 使用50个线程从队列里面获取任务来执行
            threadPoolTaskExecutor.submit((Runnable) () -> {
                while (true){
                    try {
                        ArticleDto data = BUFFER_QUEUE.take();
                        /**
                         * 获取到队列中的数据之后,调用第三方接口审核数据,但是此时网络出现问题,
                         * 第三方接口长时间没有响应,此处使用休眠来模式30秒
                         */
                        Thread.sleep(30 * 1000);
                    } catch (InterruptedException e) {
                        e.printStackTrace();
                    }
                }
            });
        }
    }
}
1、测试之后发现,出现内存泄漏问题(其实并不是泄漏,而是内存中存放了太多的对象,但是从图上看着像内存泄漏了):
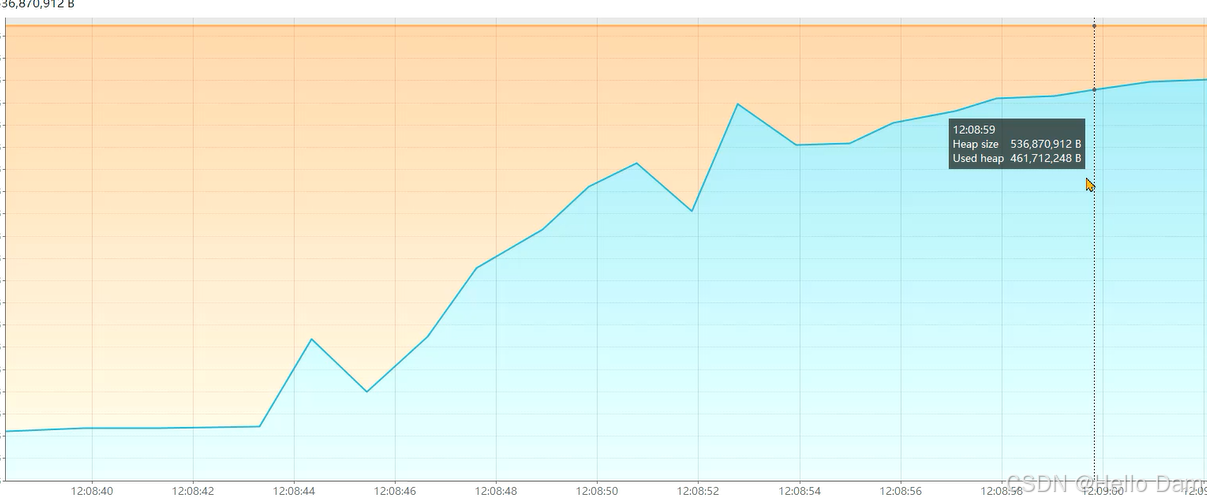
2、每次接口调用之后,都会将数据放入队列中。
3、而这个队列没有设置上限,导致队列中积压了太多任务:
4、调整一下上限设置为2000:
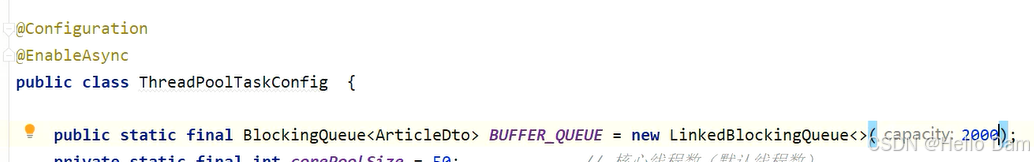
需要实现一套机制,如果队列满了,就将任务信息存储到数据库中,后期再将任务拿出来重新提交计算
5、这次就没有出现内存泄漏问题了:
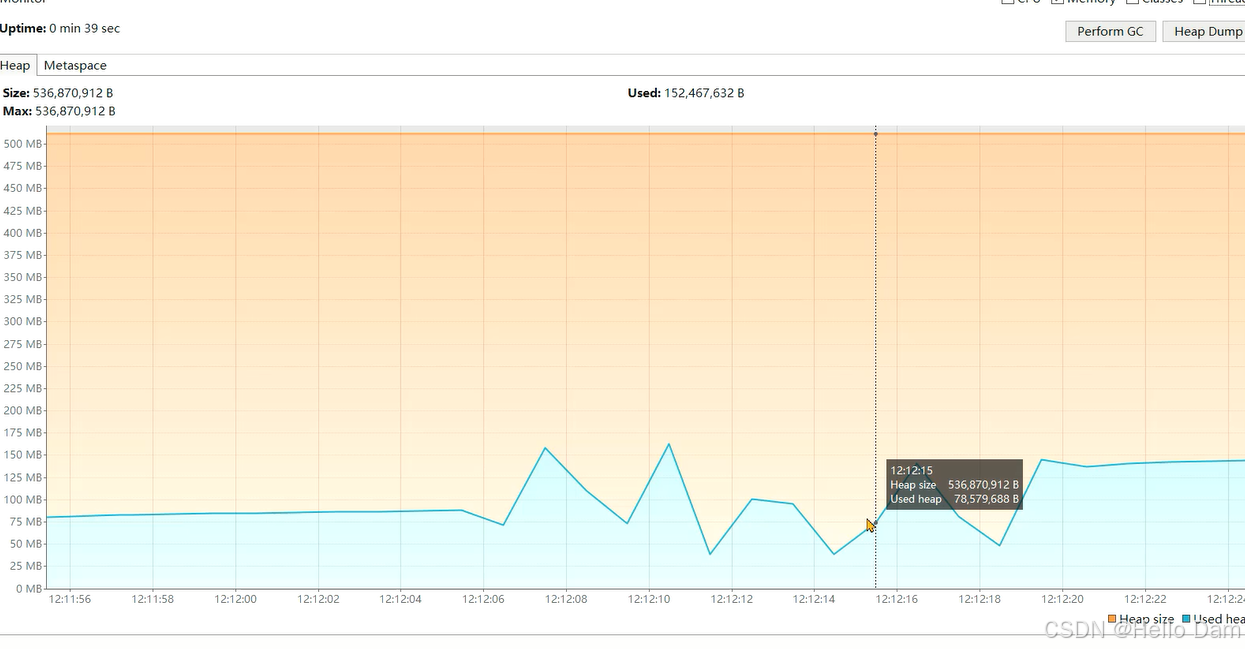
存在问题:
1、队列参数设置不正确,会保存大量的数据。
2、实现复杂,需要自行实现持久化的机制,否则数据会丢失。
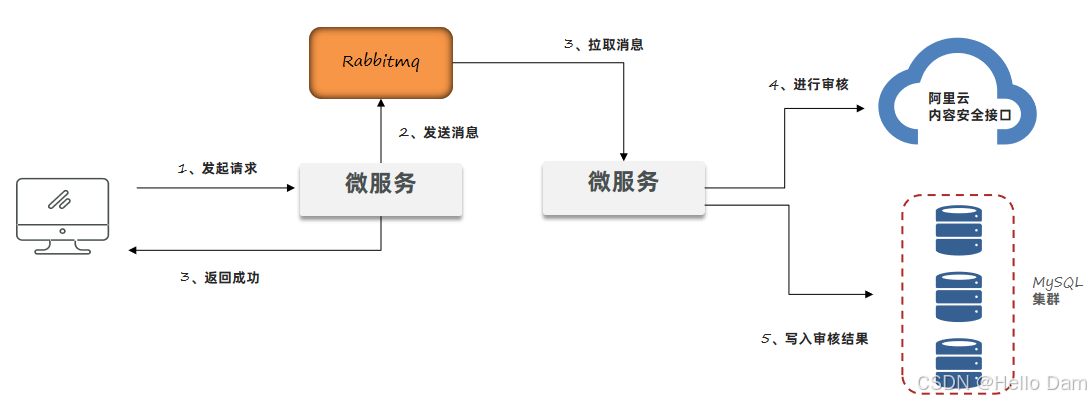
设计3:使用mq消息队列进行处理(推荐)
由MQ来保存文章的数据。发送消息的服务和拉取消息的服务可以是同一个,也可以不是同一个。MQ可以单独部署,而且具有持久化机制。
java
package com.itheima.jvmoptimize.practice.demo.controller;

import cn.hutool.json.JSON;
import com.fasterxml.jackson.core.JsonProcessingException;
import com.fasterxml.jackson.databind.ObjectMapper;
import com.itheima.jvmoptimize.practice.demo.pojo.ArticleDto;
import com.itheima.jvmoptimize.practice.demo.service.ArticleService;
import org.springframework.amqp.rabbit.core.RabbitTemplate;
import org.springframework.beans.factory.annotation.Autowired;
import org.springframework.web.bind.annotation.*;

/**
 * -XX:+HeapDumpOnOutOfMemoryError
 */
@RestController
@RequestMapping("/article")
public class Demo1ArticleController {
    @Autowired
    private RabbitTemplate rabbitTemplate;
    // 用来实现json序列化
    @Autowired
    private ObjectMapper objectMapper;

    @PostMapping("/demo3/{id}")
    public void article3(@PathVariable("id") long id, @RequestBody ArticleDto article) throws JsonProcessingException {
        article.setId(id);
        rabbitTemplate.convertAndSend("jvm-test",null,  objectMapper.writeValueAsString(article));
    }
}
【监听器】
java
package com.itheima.jvmoptimize.practice.demo.listener;

import com.rabbitmq.client.Channel;
import lombok.extern.slf4j.Slf4j;
import org.springframework.amqp.core.Message;
import org.springframework.amqp.rabbit.annotation.RabbitListener;
import org.springframework.amqp.rabbit.core.RabbitTemplate;
import org.springframework.beans.factory.annotation.Autowired;
import org.springframework.stereotype.Component;

import java.io.IOException;

@Component
public class SpringRabbitListener {
    // 启动10个线程来并行处理
    @RabbitListener(queues = "queue1",concurrency = "10")
    public void listenSimpleQueue(String msg) throws InterruptedException {
        System.out.println(msg);
        Thread.sleep(30 * 1000);
    }
}
测试结果
内存没有出现膨胀的情况
问题根源和解决思路
- 在项目中如果要使用异步进行业务处理,或者实现生产者 -- 消费者的模型,如果在Java代码中实现,会占用大量的内存去保存中间数据。
- 尽量使用Mq消息队列,可以很好地将中间数据单独进行保存,不会占用Java的内存。同时也可以将生产者和消费者拆分成不同的微服务。
在线定位问题
诊断问题有两种方法
生成内存快照并分析
优点:
- 通过完整的内存快照准确地判断出问题产生的原因
缺点:
- 内存较大时,生成内存快照较慢,这个过程中没办法响应用户的请求
- 通过MAT分析内存快照,至少要准备快照文件1.5 -- 2倍大小的内存空间
在线定位问题
优点:
- 无需生成内存快照,整个过程对用户的影响较小
缺点:
- 无法查看到详细的内存信息
- 需要通过arthas或者btrace工具调测发现问题产生的原因,需要具备一定的经验(例如要监测哪个方法)
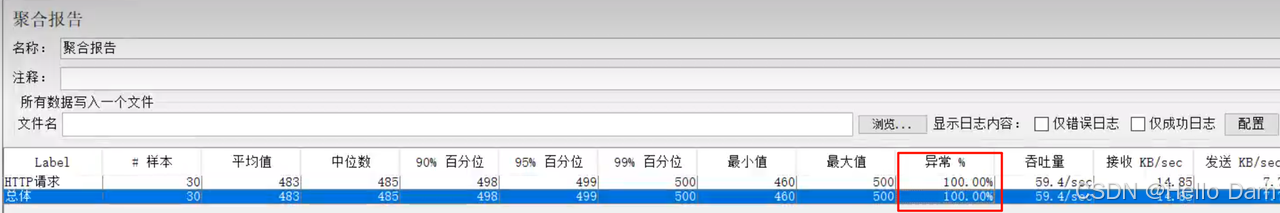
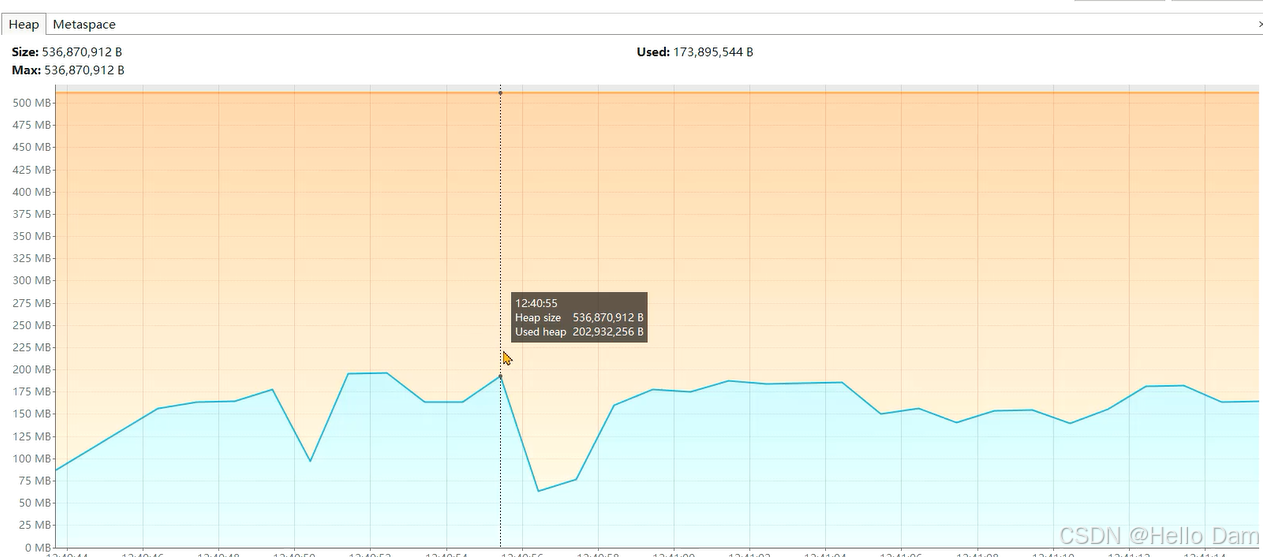
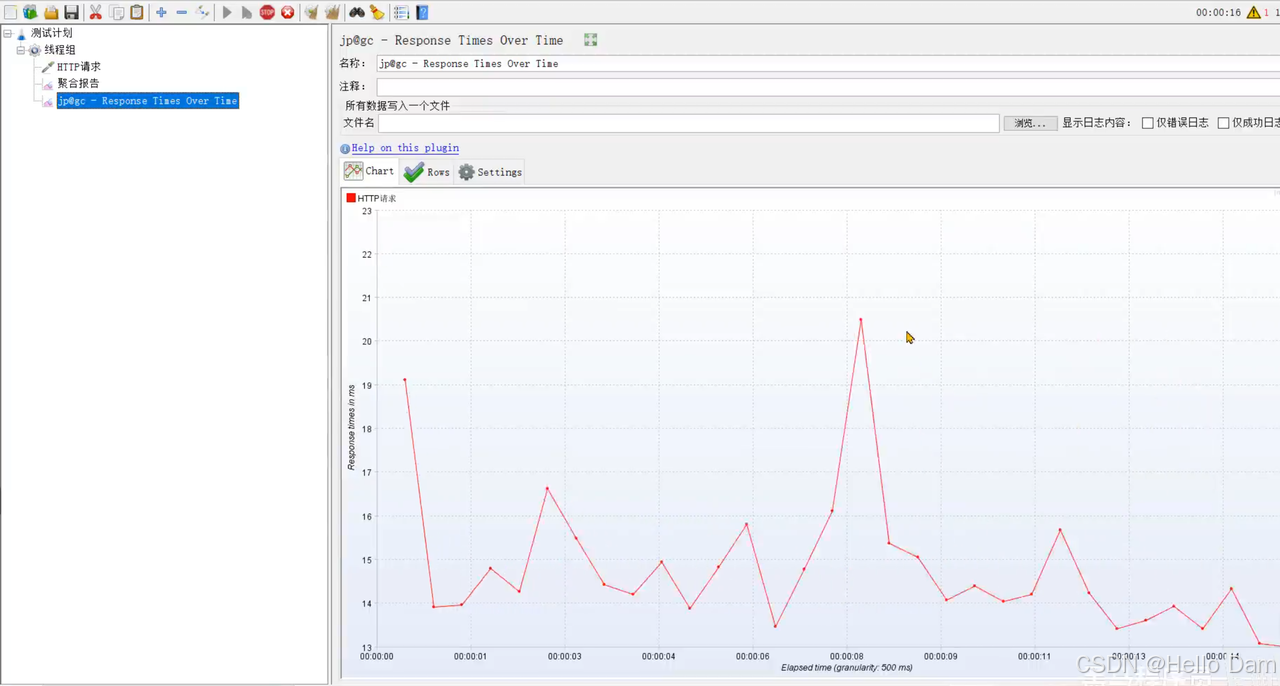
安装Jmeter插件查看接口响应信息
为了监控接口的响应时间RT、每秒事务数TPS等指标,需要在Jmeter上安装gc插件。
1、打开资料中的插件包并解压。
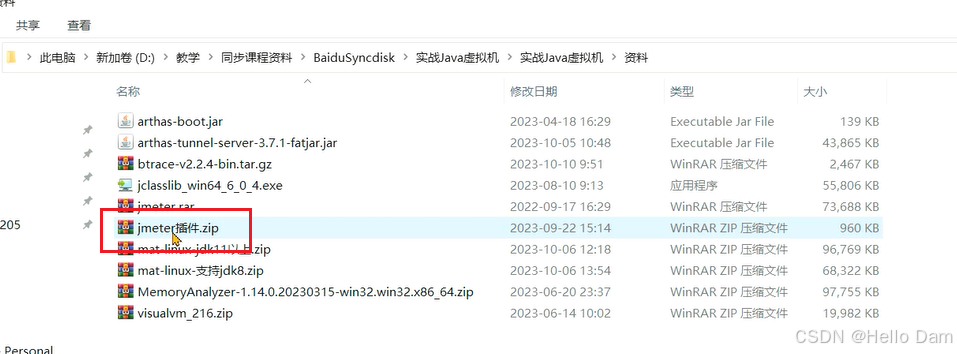
2、按插件包中的目录,复制到jmeter安装目录的相应目录下。
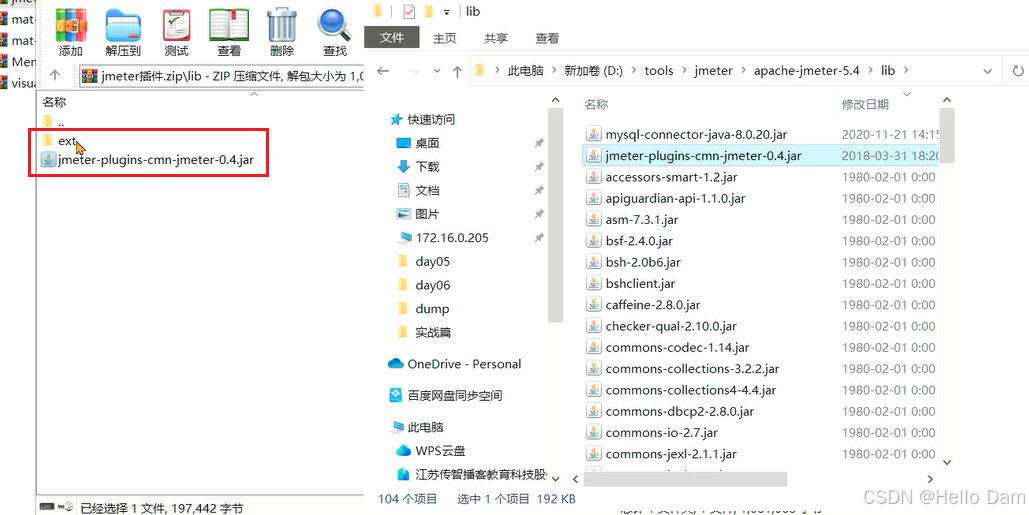
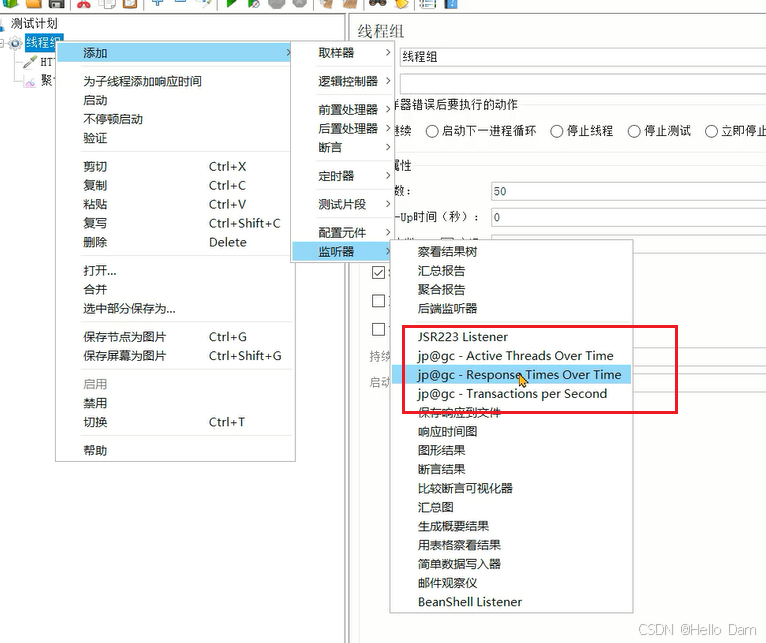
3、重启之后就可以在监听器中看到三个选项
- 活跃线程数
- 响应时间
- 每秒事务数
查看响应时长
定位内存大的对象创建位置
Arthas stack命令
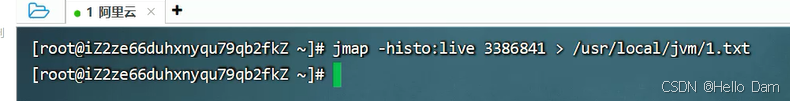
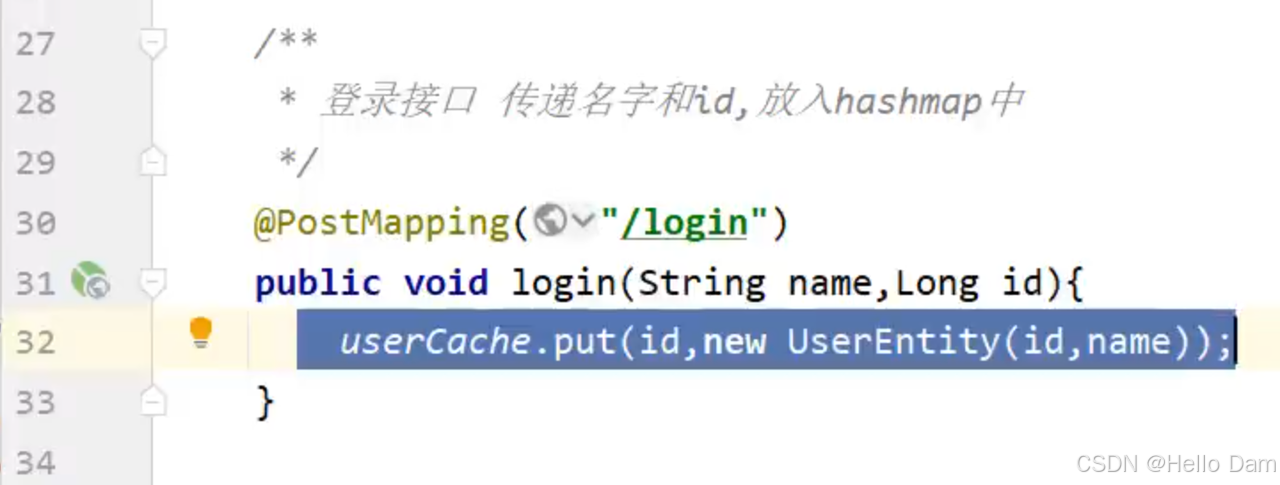
1、使用jmap -histo:live 进程ID > 文件名 命令将内存中存活对象以直方图的形式保存到文件中,这个过程会影响用户的时间,但是时间比较短暂(比生成堆内存快照对用户的影响小很多)
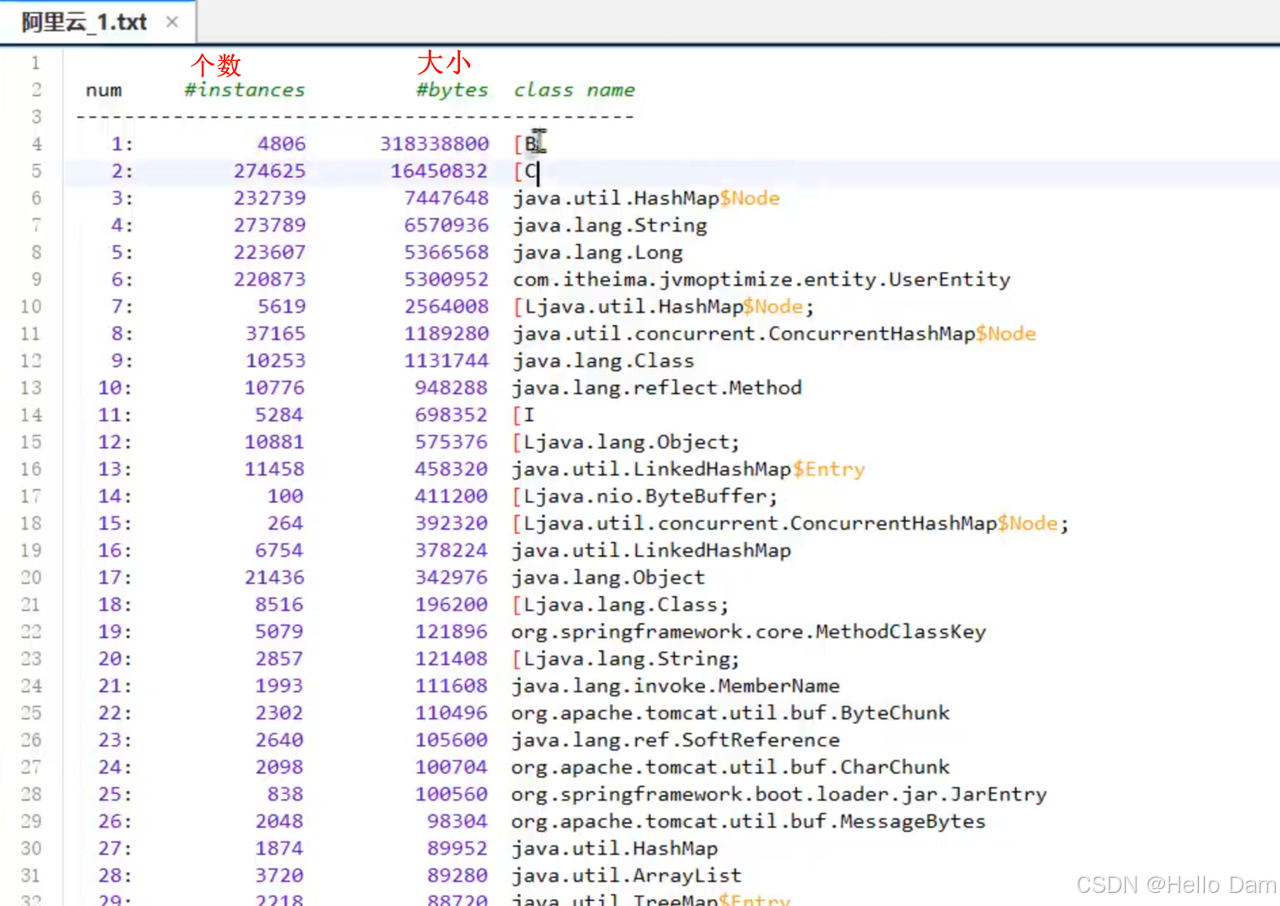
2、分析内存占用最多的对象,一般这些对象就是造成内存泄漏的原因 打开1.txt文件,从图中可以看到,有一个UserEntity对象占用非常多的内存。只要知道这个对象是在哪里创建出来的,就很容易定位到问题了
3、使用arthas的stack命令,追踪对象创建的方法被调用的调用路径,找到对象创建的根源(即构造方法在哪里调用的)。也可以使用btrace工具编写脚本追踪方法执行的过程。
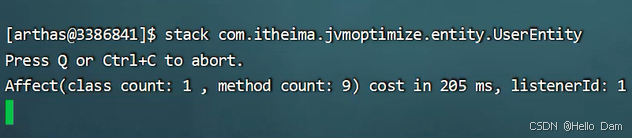
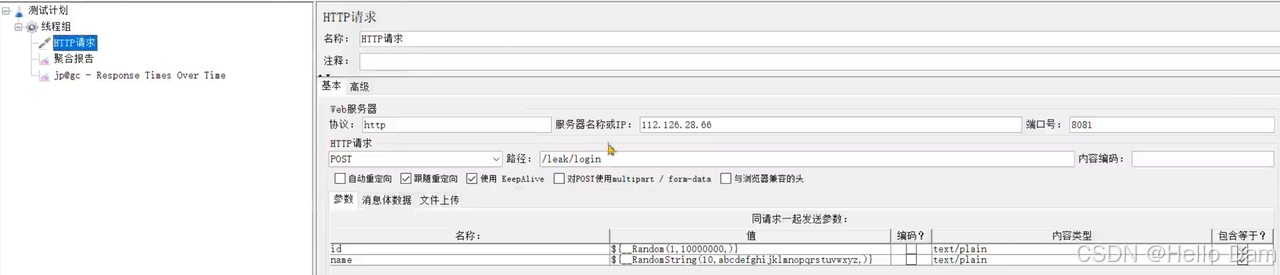
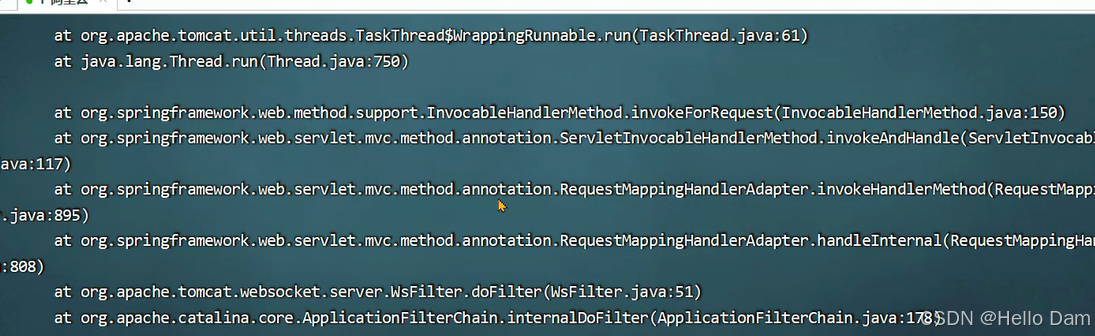
接下来启动jmeter脚本,会发现有大量的方法调用这样不利于观察。
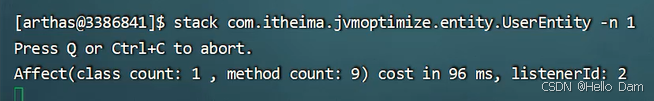
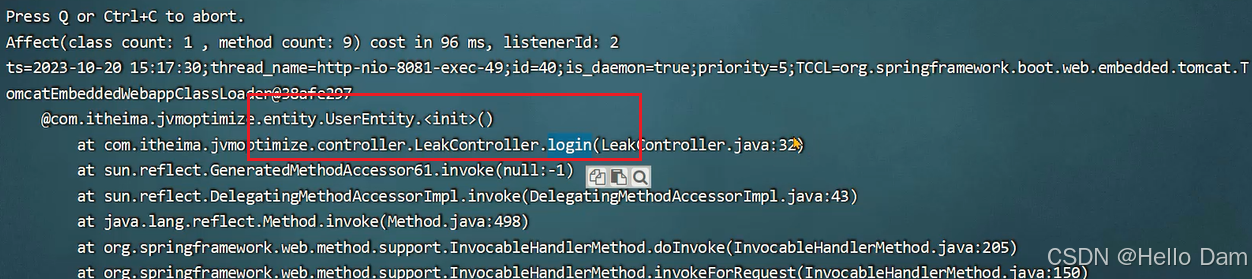
加上 -n 1 参数,限制只查看一笔调用:
这样就定位到了是login接口中创建的对象:
btrace在线定位
- 相比较arthas的stack命令,btrace允许我们自己编写代码获取感兴趣的内容,灵活性更高。
- BTrace 是一个在Java 平台上执行的追踪工具,可以有效地用于线上运行系统的方法追踪,具有侵入性小、对性能的影响微乎其微等特点。
- 项目中可以使用btrace工具,打印出方法被调用的栈信息。
使用方法:
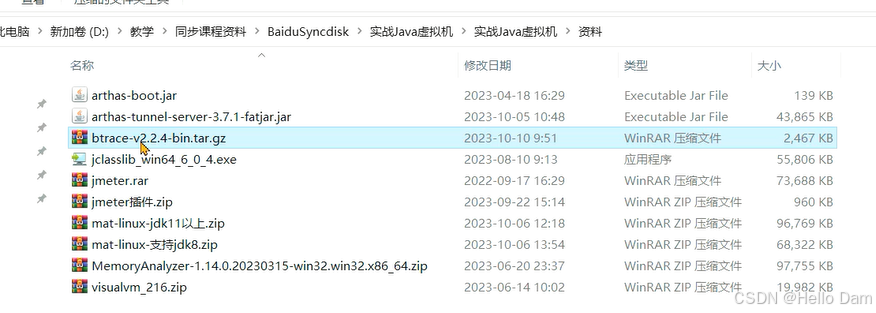
1、下载btrace工具, 官方地址:https://github.com/btraceio/btrace/releases/latest
在资料中也给出了:
编写代码的时候,需要引入这些jar包
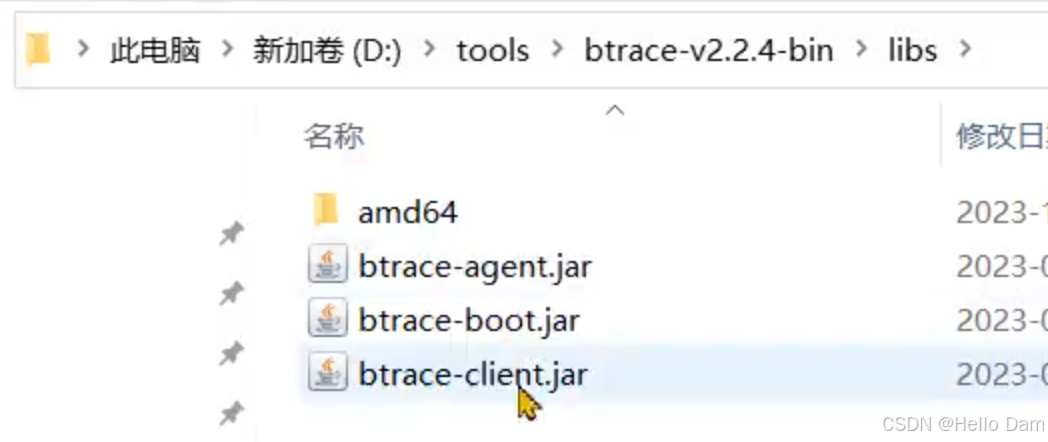
这里提供了很多案例,编写代码的时候可以参考
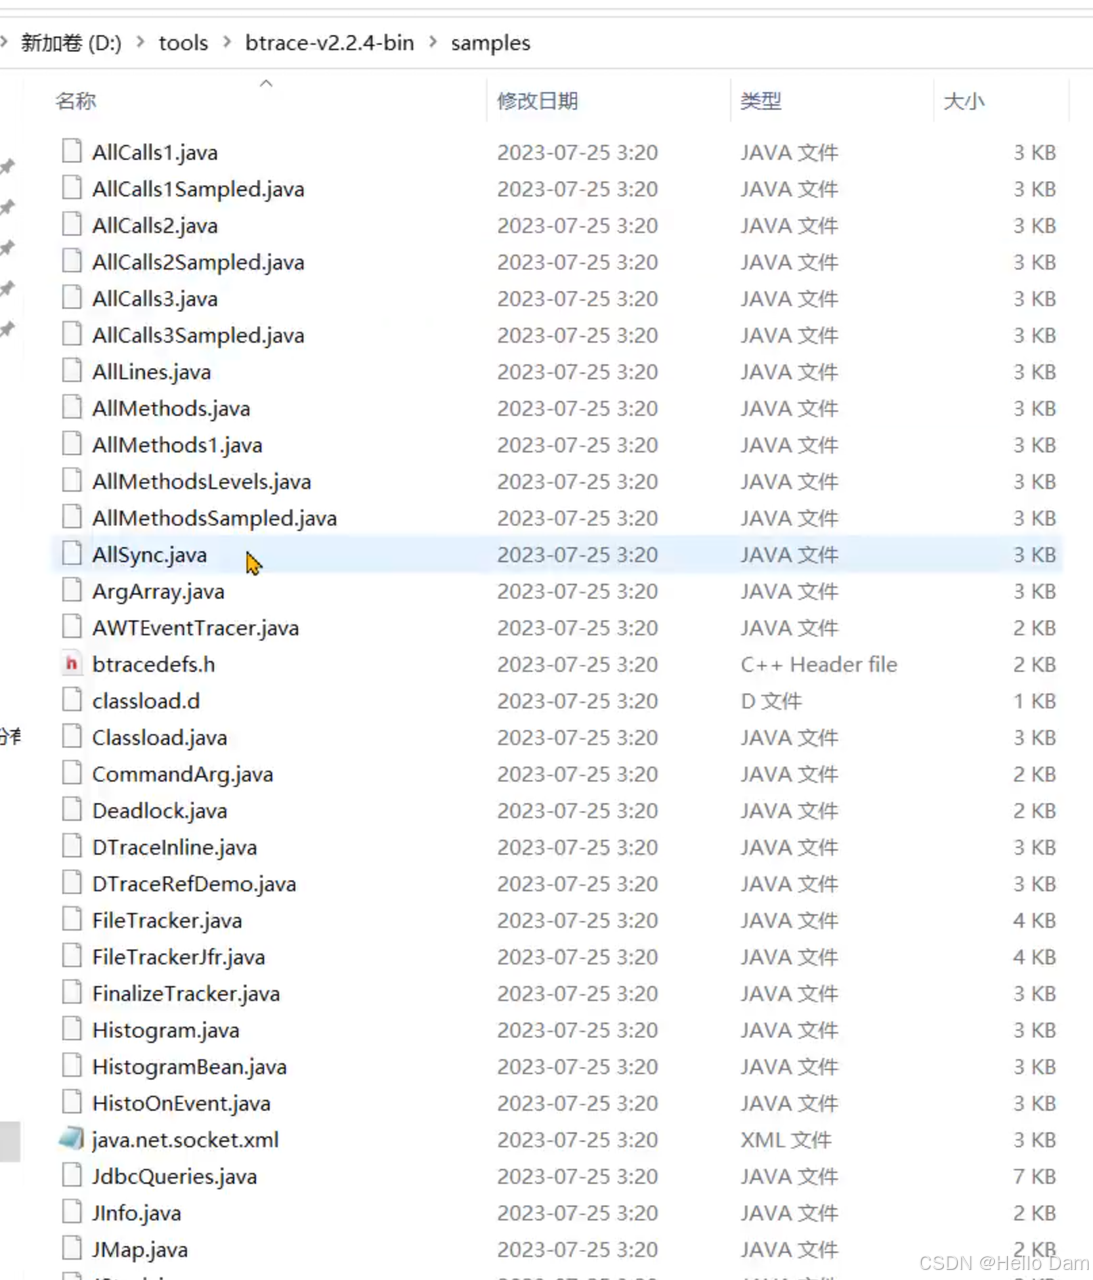
2、编写btrace脚本,通常是一个java文件
xml
<dependencies>
    <dependency>
        <groupId>org.openjdk.btrace</groupId>
        <artifactId>btrace-agent</artifactId>
        <version>${btrace.version}</version>
        // 本地文件引入,scope是system
        <scope>system</scope>
        <systemPath>D:\tools\btrace-v2.2.4-bin\libs\btrace-agent.jar</systemPath>
    </dependency>

    <dependency>
        <groupId>org.openjdk.btrace</groupId>
        <artifactId>btrace-boot</artifactId>
        <version>${btrace.version}</version>
        <scope>system</scope>
        <systemPath>D:\tools\btrace-v2.2.4-bin\libs\btrace-boot.jar</systemPath>
    </dependency>

    <dependency>
        <groupId>org.openjdk.btrace</groupId>
        <artifactId>btrace-client</artifactId>
        <version>${btrace.version}</version>
        <scope>system</scope>
        <systemPath>D:\tools\btrace-v2.2.4-bin\libs\btrace-client.jar</systemPath>
    </dependency>
</dependencies>
代码:
代码非常简单,就是打印出栈信息。clazz指定类,method指定监控的方法。
java
import org.openjdk.btrace.core.annotations.*;
import static org.openjdk.btrace.core.BTraceUtils.jstack;
import static org.openjdk.btrace.core.BTraceUtils.println;
@BTrace// 表示当前类是一个btrace脚本
public class TracingUserEntity {
// 条件满足的时候,就会出发这个方法
// method="/.*/" 表示监控所有的方法
@OnMethod(
clazz="com.itheima.jvmoptimize.entity.UserEntity",
method="/.*/")
public static void traceExecute(){
// btace内置方法,打印栈信息
jstack();
}
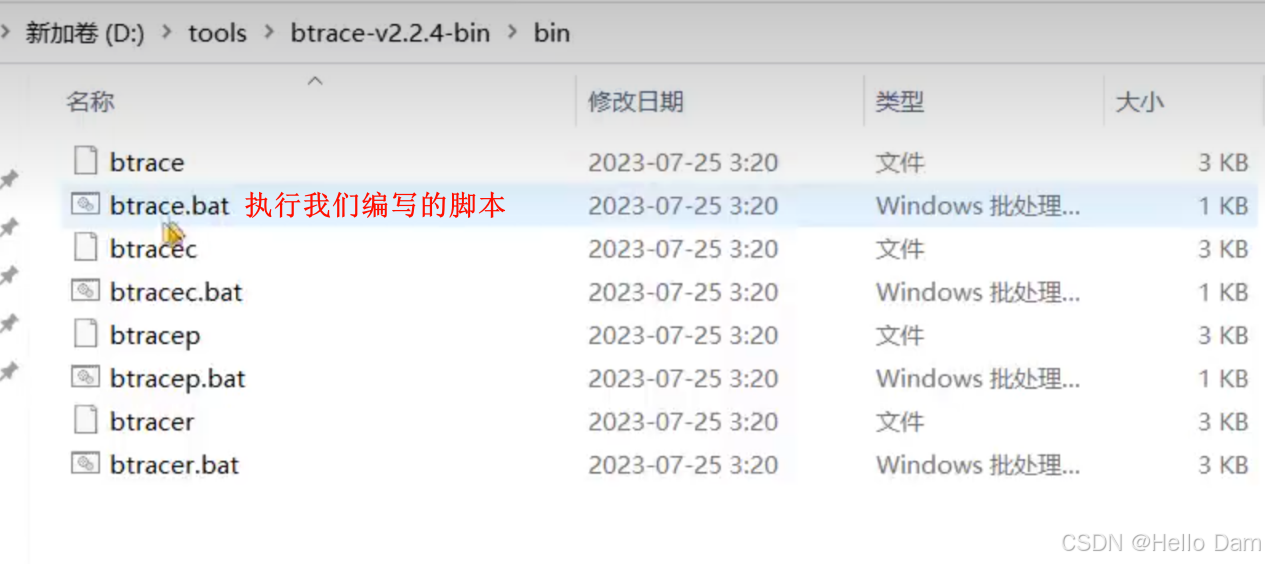
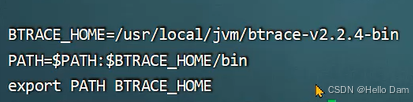
}3、将btrace工具和脚本上传到服务器,在服务器上运行 btrace 进程ID 脚本文件名 。
配置btrace环境变量,与JDK配置方式基本相同:
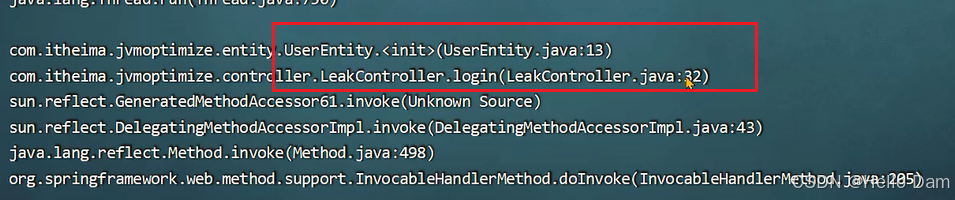
在服务器上运行 btrace 进程ID 脚本文件名:

4、观察执行结果。 启动jmeter之后,同样获取到了栈信息:
文章说明
该文章是本人学习 黑马程序员 的学习笔记,文章中大部分内容来源于 黑马程序员 的视频黑马程序员JVM虚拟机入门到实战全套视频教程,java大厂面试必会的jvm一套搞定(丰富的实战案例及最热面试题),也有部分内容来自于自己的思考,发布文章是想帮助其他学习的人更方便地整理自己的笔记或者直接通过文章学习相关知识,如有侵权请联系删除,最后对 黑马程序员 的优质课程表示感谢。