实验二 离散序列的基本运算
一、实验目的
(1)进一步了解离散时间序列时域的基本运算。
(2)了解MATLAB语言进行离散序列运算的常用函数,掌握离散序列运算程序的编写方法。
二、实验涉及的MATLAB子函数
1.find
功能:寻找非零元素的索引号。
调用格式:find((n>=min(n1))&(n<=max(n1)));在符合关系运算条件的范围内寻找非零元素的索引号。
2.fliplr
功能:对矩阵行元素进行左右翻转。
调用格式:x1=fliplr(x);将x的行元素进行左右翻转,赋给变量x1。
三、实验原理
离散序列的时域运算包括信号的相加、相乘,信号的时域变换包括信号的移位、反折、倒相及信号的尺度变换等。
在MATLAB中,离散序列的相加等运算是两个向量之间的运算,因此参加运算的两个序列向量必须具有相同的维数,否则应进行相应的处理。
四、实验任务
(1)认真阅读实验原理,明确本次实验目的,复习有关离散时间序列运算的理论知识。
(2)在MATLAB中编写运行各例题程序,理解离散序列运算的性质,了解各条语句的意义。
(3)读懂各例题程序,了解基本的离散序列运算MATLAB中的程序编写方法。
(4)列写已调试通过的实验任务程序, 打印或描绘实验程序产生的曲线图形。
1.序列移位
将一个离散信号序列进行移位,形成新的序列:x1(n)=x(n-m)
当m>0时,原序列x(n)向右移m位,形成的新序列称为x(n)的延时序列;当m<0时,原序列x(n)向左移m位,形成的新序列称为x(n)的超前序列。
例3-1 x1(n)=u(n+6) (-10<n<10)
x2(n)=u(n-4) (-10<n<10)
编写一个MATLAB程序,对u(n)序列进行移位,由图3-1比较三个序列之间的关系。
n1=-10;n2=10;
k0=0;k1=-6;k2=4;
n=n1:n2; %生成离散信号的时间序列
x0=[n>=k0]; %生成离散信号x0(n)
x1=[(n-k1)>=0];%生成离散信号x1(n)
x2=[(n-k2)>=0];%生成离散信号x2(n)
subplot(3,1,1),stem(n,x0,¢filled¢,¢k¢);
axis([n1,n2,1.1*min(x0),1.1*max(x0)]);
ylabel(¢u(n)¢);
subplot(3,1,2),stem(n,x1,¢filled¢,¢k¢);
axis([n1,n2,1.1*min(x1),1.1*max(x1)]);
ylabel(¢u(n+6)¢);
subplot(3,1,3),stem(n,x2,¢filled¢,¢k¢);
axis([n1,n2,1.1*min(x2),1.1*max(x2)]);
ylabel(u¢(n-4)¢);
n1=-10;n2=10;

k0=0;k1=-6;k2=4;

n=n1:n2;            %生成离散信号的时间序列

x0=[ n >= k0];  %生成离散信号x0(n)

x1=[(n-k1)>=0];%生成离散信号x1(n)

x2=[(n-k2)>=0];%生成离散信号x2(n)

subplot(3,1,1),stem(n,x0,'filled','k');

axis([n1,n2,1.1*min(x0),1.1*max(x0)]);

ylabel('u(n)');

subplot(3,1,2),stem(n,x1,'filled','k');

axis([n1,n2,1.1*min(x1),1.1*max(x1)]);

ylabel('u(n+6)');

subplot(3,1,3),stem(n,x2,'filled','k');

axis([n1,n2,1.1*min(x2),1.1*max(x2)]);

ylabel('u(n-4)');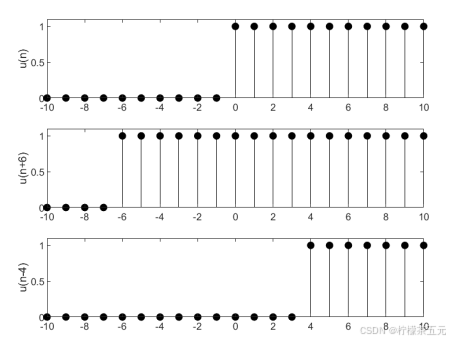
图3-1 u(n)及其位移序列u(n+6)和u(n-4)
例3-2 已知一正弦信号:

求其移位信号x(n-2)和x(n+2)在-2<n<10区间的序列波形。
解 MATLAB程序如下:
n=-2:10;n0=2;n1=-2;
x=2*sin(2*pi*n/10); %建立原信号x(n)
x1=2*sin(2*pi*(n-n0)/10); %建立x(n-2)信号
x2=2*sin(2*pi*(n-n1)/10);%建立x(n+2)信号
subplot(3,1,1),stem(n,x,¢filled¢,¢k¢);
ylabel(¢x(n)¢);
subplot(3,1,2),stem(n,x1,¢filled¢,¢k¢);
ylabel(¢x(n-2)¢);
subplot(3,1,3),stem(n,x2,¢filled¢,¢k¢);
ylabel(¢x(n+2)¢);
结果如图3-2所示。
n=-2:10;n0=2;n1=-2;

x=2*sin(2*pi*n/10);         %建立原信号x(n)

x1=2*sin(2*pi*(n-n0)/10);   %建立x(n-2)信号

x2=2*sin(2*pi*(n-n1)/10);%建立x(n+2)信号

subplot(3,1,1),stem(n,x,'filled','k');

ylabel('x(n)');

subplot(3,1,2),stem(n,x1,'filled','k');

ylabel('x(n-2)');

subplot(3,1,3),stem(n,x2,'filled','k');

ylabel('x(n+2)');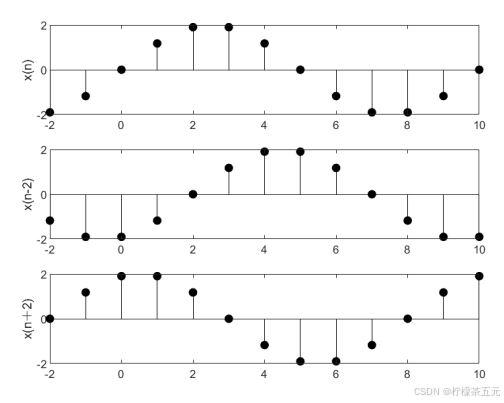
图3-2 正弦信号x(n)、x(n-2)和x(n+2)
2.序列相加
3.两个离散序列相加是指两个序列中相同序号n(或同一时刻)的序列值逐项对应相加,构成一个新的序列:x(n)=x1(n)+x2(n)
例3-3 求x(n)=d(n-2)+d(n-4) (0<n<10)。
解 MATLAB程序如下:
n1=0;n2=10;n01=2;n02=4; %赋初值
n=n1:n2;
x1=[(n-n01)==0]; %建立d(n-2)序列
x2=[(n-n02)==0]; %建立d(n-4)序列
x3=x1+x2;
subplot(3,1,1);stem(n,x1,¢filled¢);
axis([n1,n2,1.1*min(x1),1.1*max(x1)]);
ylabel(¢d(n-2)¢);
subplot(3,1,2);stem(n,x2,¢filled¢);
axis([n1,n2,1.1*min(x2),1.1*max(x2)]);
ylabel(¢d(n-4)¢);
subplot(3,1,3);stem(n,x3,¢filled¢);
axis([n1,n2,1.1*min(x3),1.1*max(x3)]);
ylabel(¢d(n-2)+d(n-4)¢);
结果如图3-3所示。
n1=0;n2=10;n01=2;n02=4;%赋初值

n=n1:n2;

x1=[(n-n01)==0];%建立d(n-2)序列

x2=[(n-n02)==0];%建立d(n-4)序列

x3=x1+x2;

subplot(3,1,1);stem(n,x1,'filled');

axis([n1,n2,1.1*min(x1),1.1*max(x1)]);

ylabel('d(n-2)');

subplot(3,1,2);stem(n,x2,'filled');

axis([n1,n2,1.1*min(x2),1.1*max(x2)]);

ylabel('d(n-4)');

subplot(3,1,3);stem(n,x3,'filled');

axis([n1,n2,1.1*min(x3),1.1*max(x3)]);

ylabel('d(n-2)+d(n-4)');
图3-3 d(n-2)和d(n-4)序列相加
3.序列反折
离散序列反折是指离散序列的两个向量以零时刻的取值为基准点,以纵轴为对称轴反折。在MATLAB中提供了fliplr函数,可以实现序列的反折。
例3-6已知一个信号:x(n)=e-0.3*n (-4<n<4)
求它的反折序列x(-n)。
解 MATLAB程序如下:
n=-4:4;
x=exp(-0.3*n);
x1=fliplr(x);
n1=-fliplr(n);
subplot(1,2,1),stem(n,x,¢filled¢);
title(¢x(n)¢);
subplot(1,2,2),stem(n1,x1,¢filled¢);
title(¢x(-n)¢);
结果如图3-6所示。
n=-4:4;

x=exp(-0.3*n);

x1=fliplr(x);

n1=-fliplr(n);

subplot(1,2,1),stem(n,x,'filled');

title('x(n)');

subplot(1,2,2),stem(n1,x1,'filled');

title('x(-n)');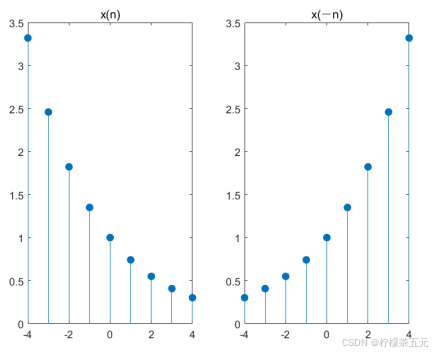
图3-6 序列x(n)和x(-n)反折序列
4.序列倒相
离散序列倒相是求一个与原序列的向量值相反,对应的时间序号向量不变序列。
例3-7将例3-6中信号:x(n)=e-0.3*n (-4<n<4)倒相。
解 MATLAB程序如下:
n=-4:4;
x=exp(-0.3*n);
x1=-x;
subplot(1,2,1),stem(n,x,¢filled¢);
title(¢x(n)¢);
axis([min(n),max(n),1.1*min(x1),1.1*max(x)]);
subplot(1,2,2),stem(n,x1,¢filled¢);
title(¢-x(n)¢);
axis([min(n),max(n),1.1*min(x1),1.1*max(x)]);
结果如图3-7所示。
n=-4:4;

x=exp(-0.3*n);

x1=-x;

subplot(1,2,1),stem(n,x,'filled');

title('x(n)');

axis([min(n),max(n),1.1*min(x1),1.1*max(x)]);

subplot(1,2,2),stem(n,x1,'filled');

title('-x(n)');

axis([min(n),max(n),1.1*min(x1),1.1*max(x)]);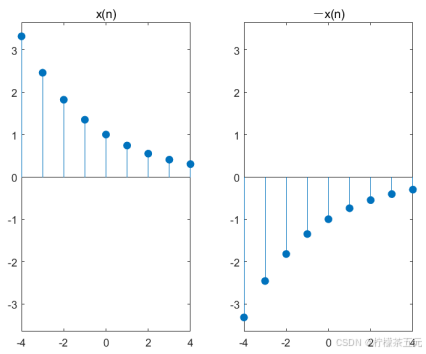
图3-7 序列x(n)和倒相序列-x(n)
5.序列的尺度变换
对于给定的离散序列x(n),序列x(mn)是x(n)每隔m点取一点形成,相当于时间轴n压缩了m倍;反之,序列x(n/m)是x(n)作m倍的插值而形成的,相当于时间轴n扩展了m倍。
例3-8 已知信号x(n)=sin(2pn),求x(2n)和x(n/2)的信号波形。为研究问题的方便,取0<n<20,并将n缩小20倍进行波形显示。
解 MATLAB程序如下:
n=(0:20)/20;
x=sin(2*pi*n); %建立原信号x(n)
x1=sin(2*pi*n*2);%建立x(2n)信号
x2=sin(2*pi*n/2);%建立x(n/2)信号
subplot(3,1,1),stem(n,x,¢filled¢);
ylabel(¢x(n)¢);
subplot(3,1,2),stem(n,x1,¢filled¢);
ylabel(¢x(2n)¢);
subplot(3,1,3),stem(n,x2,¢filled¢);
ylabel(¢x(n/2)¢);
结果如图3-8所示。
n=(0:20)/20;

x=sin(2*pi*n);     %建立原信号x(n)

x1=sin(2*pi*n*2);%建立x(2n)信号

x2=sin(2*pi*n/2);%建立x(n/2)信号

subplot(3,1,1),stem(n,x,'filled');

ylabel('x(n)');

subplot(3,1,2),stem(n,x1,'filled');

ylabel('x(2n)');

subplot(3,1,3),stem(n,x2,'filled');

ylabel('x(n/2)');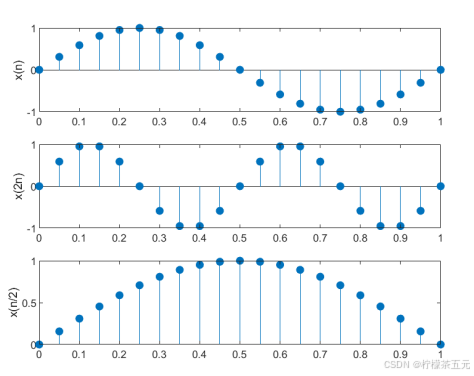
图3-8 序列x(n)、x(2n)和x(n/2)