Title
题目
Brain Connectivity Networks Constructed Using MRI for Predicting Patterns of Atrophy Progression in Parkinson Disease
使用 MRI 构建的大脑连接网络预测帕金森病萎缩进展模式
Background
背景
Whether connectome mapping of structural and across the brain could be used to predict patterns of atrophy progression in patients with mild Parkinsondisease (PD) has not been well studied.
是否可以使用全脑结构和功能连接的连接组映射来预测轻度帕金森病(PD)患者的萎缩进展模式尚未得到充分研究。
Method
方法
This prospective study included participants with mild PD and controls recruited from a single center between January 2012 and December 2023. Participants with PD underwent three-dimensional T1-weighted brain MRI, and the extent of regional GM atrophy was determined at baseline and every year for 3 years. The structural and functional brain connectome was constructed using diffusion tensor imaging and resting-state functional MRI in healthy controls. Disease exposure (DE) indexes---indexes of the pathology of each brain region---were defined as a function of the structural or functional connectivity of all the connected regions in the healthy connectome and the severity of atrophy of the connected regions in participants with PD. Partial correlations were tested between structural and functional DE indexes of each GM region at 1- or 2-year follow-up and atrophy progression at 2- or 3-year follow-up. Prediction models of atrophy at 2- or 3-year follow-up were constructed using exhaustive feature selection.
这项前瞻性研究包括2012年1月至2023年12月期间从单一中心招募的轻度帕金森病(PD)患者和对照组参与者。PD患者接受了三维T1加权脑MRI扫描,并在基线和每年进行一次灰质(GM)萎缩程度评估,持续3年。健康对照组使用弥散张量成像和静息态功能MRI构建结构和功能脑连接组。疾病暴露(DE)指数------每个脑区病理学的指数------被定义为健康连接组中所有连接区域的结构或功能连接以及PD患者连接区域萎缩严重程度的函数。测试了每个GM区域在1年或2年随访时的结构和功能DE指数与2年或3年随访时萎缩进展之间的部分相关性。使用详尽的特征选择构建了2年或3年随访时萎缩预测模型。
Conclusion
结论
The structural and functional organization of the brain connectome plays a role in atrophy progression in the early stages of PD.
大脑连接组的结构和功能组织在帕金森病(PD)早期阶段的萎缩进展中起着重要作用。
Results
结果
A total of 86 participants with mild PD (mean age at MRI, 60 years ± 8 SD; 48 male) and 60 healthy controls (mean age at MRI, 62 years ± 9; 31 female) were included. DE indexes at 1 and 2 years were correlated with atrophy at 2 and 3 years (r range, 0.22--0.33; P value range, .002--.04). Models including DE indexes predicted GM atrophy accumulation over 3 years in the right caudate nucleus and some frontal, parietal, and temporal brain regions (R2 range, 0.40--0.61; all P < .001).
共纳入86名轻度帕金森病(PD)患者(MRI时的平均年龄为60岁±8 SD;48名男性)和60名健康对照组(MRI时的平均年龄为62岁±9;31名女性)。1年和2年的疾病暴露(DE)指数与2年和3年的萎缩相关(r 范围为0.22--0.33;P 值范围为.002--.04)。包含DE指数的模型预测了右侧尾状核以及部分额叶、顶叶和颞叶脑区在3年内的灰质(GM)萎缩累积(R2 范围为0.40--0.61;所有 P < .001)。
Figure
图
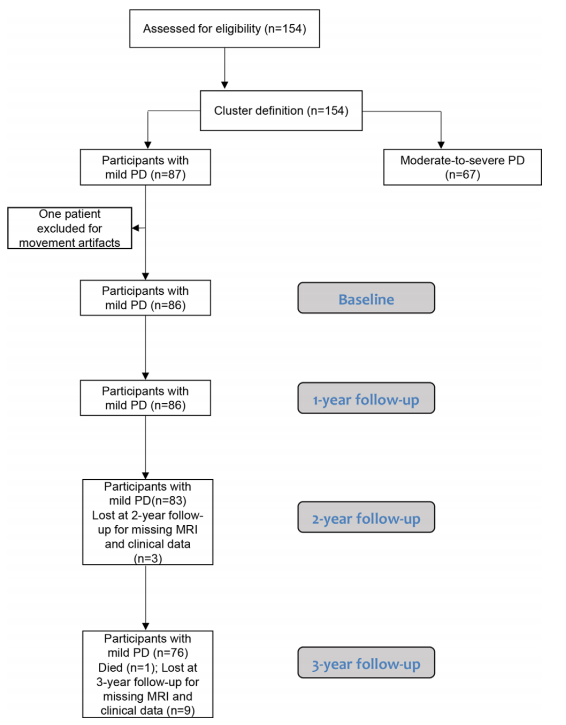
Figure 1: Flow diagram indicating the inclusion and exclusion process for the study cohort. PD = Parkinson disease.
图1: 显示研究队列的纳入和排除过程的流程图。PD = 帕金森病。
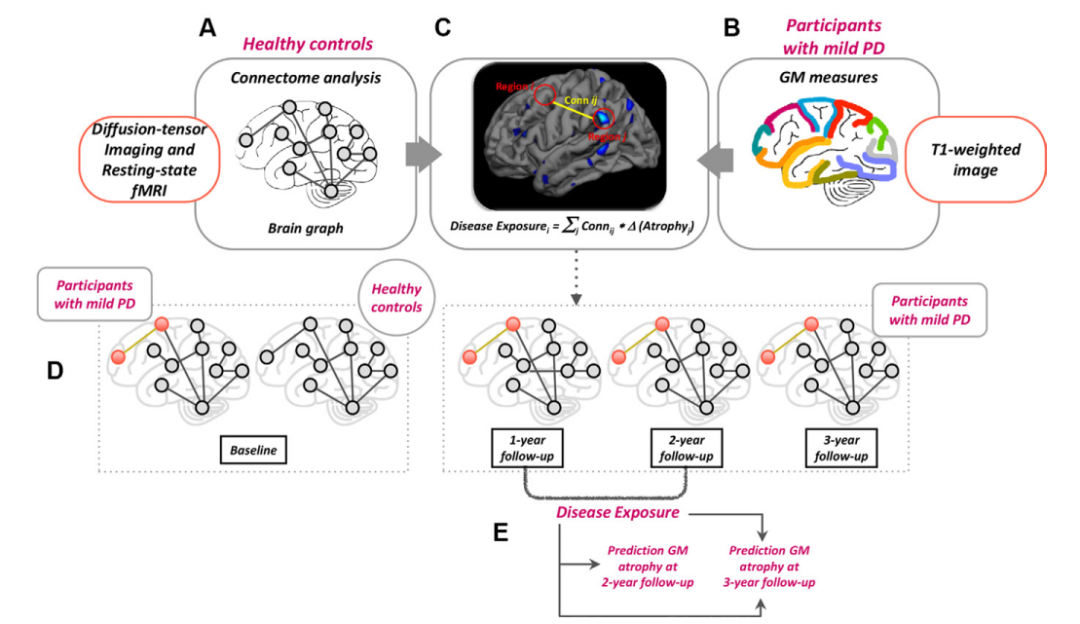
Figure 2: Diagram of study methods. (A) The structural and functional brain connectome in healthy controls at baseline was constructed. (B) Cortical thickness and gray matter (GM) volume were measured on three-dimensional T1-weighted images in participants with mild Parkinson disease (PD) (all visits) and healthy controls (baseline). (C) Disease exposure indexes---indexes of pathology in each brain region calculated at 1- and 2-year follow-up---were defined as a function of the structural and functional connectivity of each brain region relative to the connected brain regions in the connectome of healthy controls and the severity of atrophy of the connected regions in participants with PD. (D) Differences in cortical thickness or GM volume at baseline in participants with mild PD compared with healthy controls were estimated, as well as changes over 1, 2, and 3 years of follow-up in participants with mild PD. (E) Prediction models were used to evaluate GM atrophy changes in brain regions over time in participants with mild PD. fMRI = functional MRI.
图2: 研究方法示意图。(A) 构建了健康对照组在基线时的结构和功能脑连接组。(B) 测量了轻度帕金森病(PD)患者(所有随访)和健康对照组(基线)在三维T1加权图像上的皮层厚度和灰质(GM)体积。(C) 疾病暴露指数------在1年和2年随访时计算的每个脑区病理学指数------定义为相对于健康对照组连接组中连接脑区的结构和功能连接性以及PD患者连接区萎缩严重程度的函数。(D) 估计轻度PD患者与健康对照组相比在基线时的皮层厚度或GM体积差异,以及轻度PD患者在1年、2年和3年随访期间的变化。(E) 使用预测模型评估轻度PD患者脑区随时间变化的GM萎缩。fMRI = 功能性MRI。
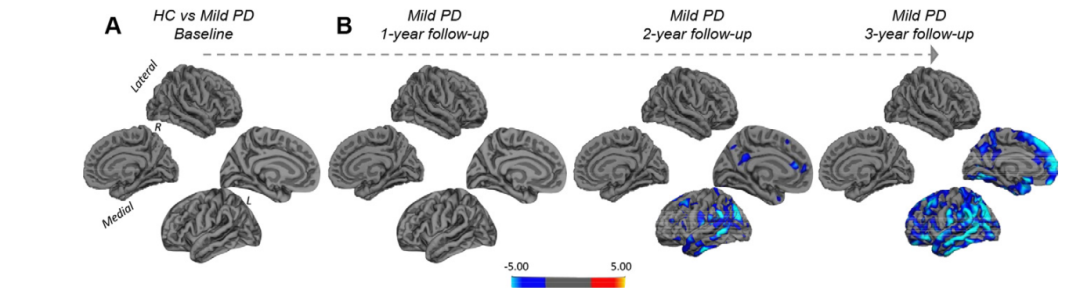
Figure 3: Gray matter atrophy patterns in participants with mild Parkinson disease (PD) (A) at baseline compared with healthy controls (HC) (general linear model in FreeSurfer adjusted for age) and (B) at 1-, 2-, and 3-year follow-up. Color bar represents t values. L = left, R = right. (Figure adapted, with permission, from reference 15.)
图3: 轻度帕金森病(PD)参与者的灰质萎缩模式 (A) 基线时与健康对照组(HC)相比(FreeSurfer中的一般线性模型调整了年龄)和 (B) 1年、2年和3年随访时的情况。色条表示t值。L = 左,R = 右。(图经参考文献15的许可改编。)
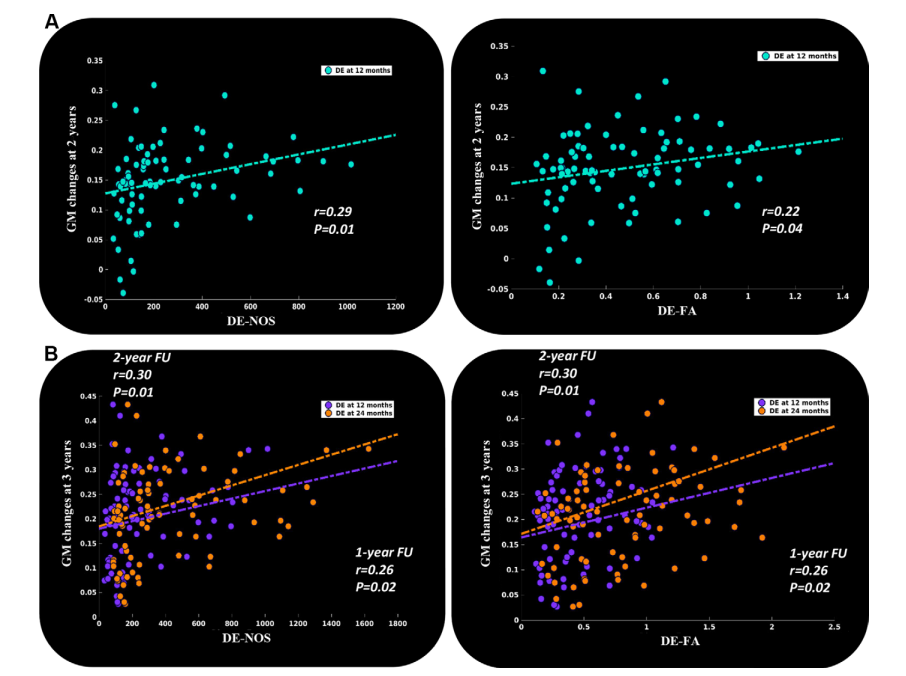
Figure 4: Scatter plots show the partial correlation between gray matter (GM) atrophy progression and structural connectivity disease exposure (DE) indexes calculated with number of streamlines (NOS) and fractional anisotropy (FA) for each GM region in participants with mild Parkinson disease. Partial correlations are shown for (A) the DE indexes at 1 year and GM atrophy at 2 years and (B) the DE indexes at 1 year (purple) and 2 years (orange) and GM atrophy at 3 years. Dots represent all 83 brain regions for each analysis. The dotted lines show the general trends of the relationships between the variables. FU = follow-up.
图4: 散点图显示了轻度帕金森病参与者中灰质(GM)萎缩进展与结构连接疾病暴露(DE)指数之间的部分相关性。DE指数是通过计算每个GM区域的流线数量(NOS)和分数各向异性(FA)得到的。(A) 显示了1年时的DE指数与2年时的GM萎缩的部分相关性,以及 (B) 显示了1年(紫色)和2年(橙色)时的DE指数与3年时的GM萎缩的部分相关性。每个分析中的点代表所有83个脑区。虚线显示了变量之间关系的一般趋势。FU = 随访。
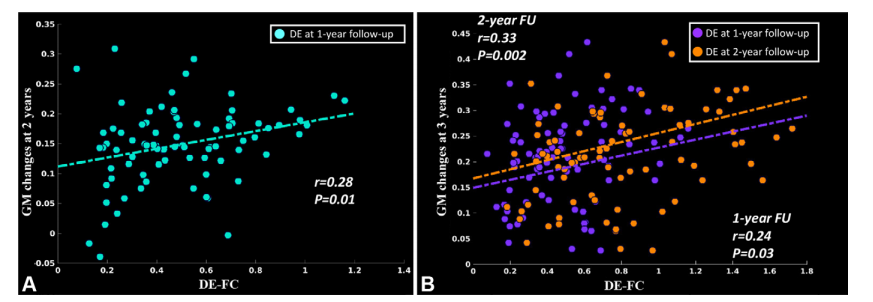
Figure 5: Scatter plots show the partial correlation between gray matter (GM) atrophy progression and the functional connectivity (FC) disease exposure (DE) index for each GM region in participants with mild Parkinson disease. Partial correlations are shown for (A) the DE index at 1 year and GM atrophy at 2 years and (B) the DE index at 1 year (purple) and 2 years (orange) and GM atrophy at 3 years. Dots represent all 83 brain regions for each analysis. The dotted lines show the general trends of the relationships between the variables. FU = follow-up
图5: 散点图显示了轻度帕金森病参与者中灰质(GM)萎缩进展与功能连接(FC)疾病暴露(DE)指数之间的部分相关性。(A) 显示了1年时的DE指数与2年时的GM萎缩的部分相关性,以及 (B) 显示了1年(紫色)和2年(橙色)时的DE指数与3年时的GM萎缩的部分相关性。每个分析中的点代表所有83个脑区。虚线显示了变量之间关系的一般趋势。FU = 随访。
Table
表
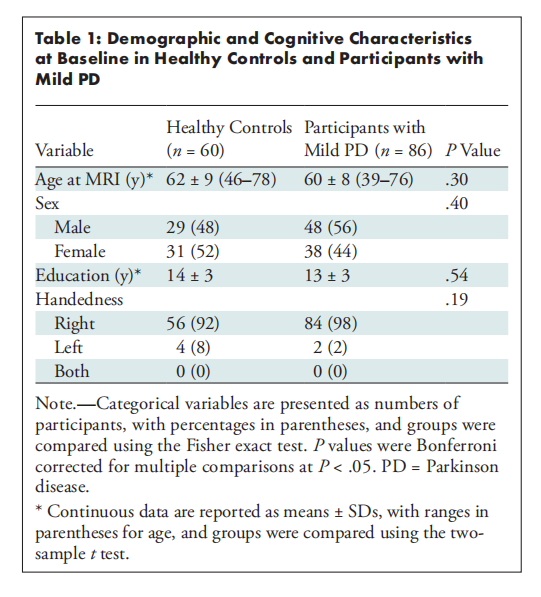
Table 1: Demographic and Cognitive Characteristics at Baseline in Healthy Controls and Participants with Mild PD
表1: 健康对照组和轻度帕金森病(PD)参与者在基线时的人口统计和认知特征
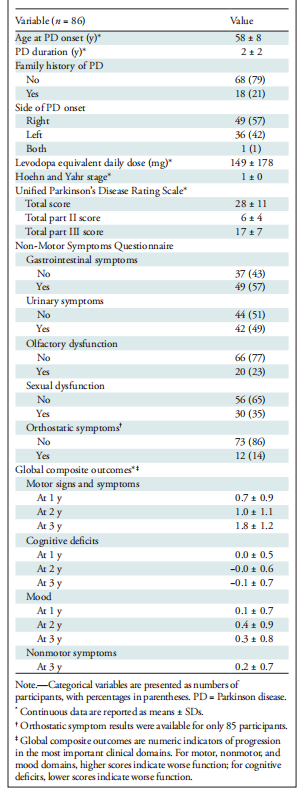
Table 2: Clinical Characteristics at Baseline in Participants with Mild PD
表2: 轻度帕金森病(PD)参与者在基线时的临床特征
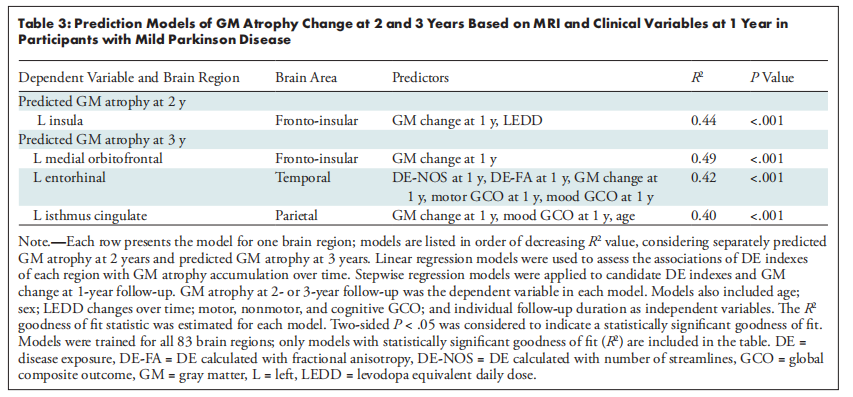
Table 3: Prediction Models of GM Atrophy Change at 2 and 3 Years Based on MRI and Clinical Variables at 1 Year in Participants with Mild Parkinson Disease
表3: 基于1年时MRI和临床变量的轻度帕金森病(PD)参与者在2年和3年时灰质(GM)萎缩变化的预测模型
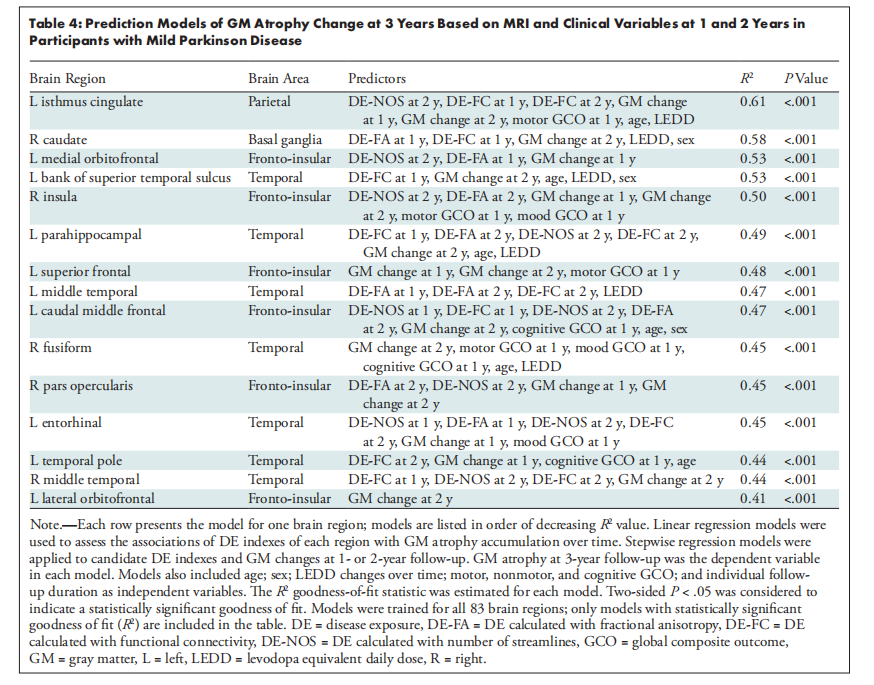
Table 4: Prediction Models of GM Atrophy Change at 3 Years Based on MRI and Clinical Variables at 1 and 2 Years in Participants with Mild Parkinson Disease
表4: 基于1年和2年时MRI和临床变量的轻度帕金森病(PD)参与者在3年时灰质(GM)萎缩变化的预测模型