VGG16模块的可视化
VGG16简介:
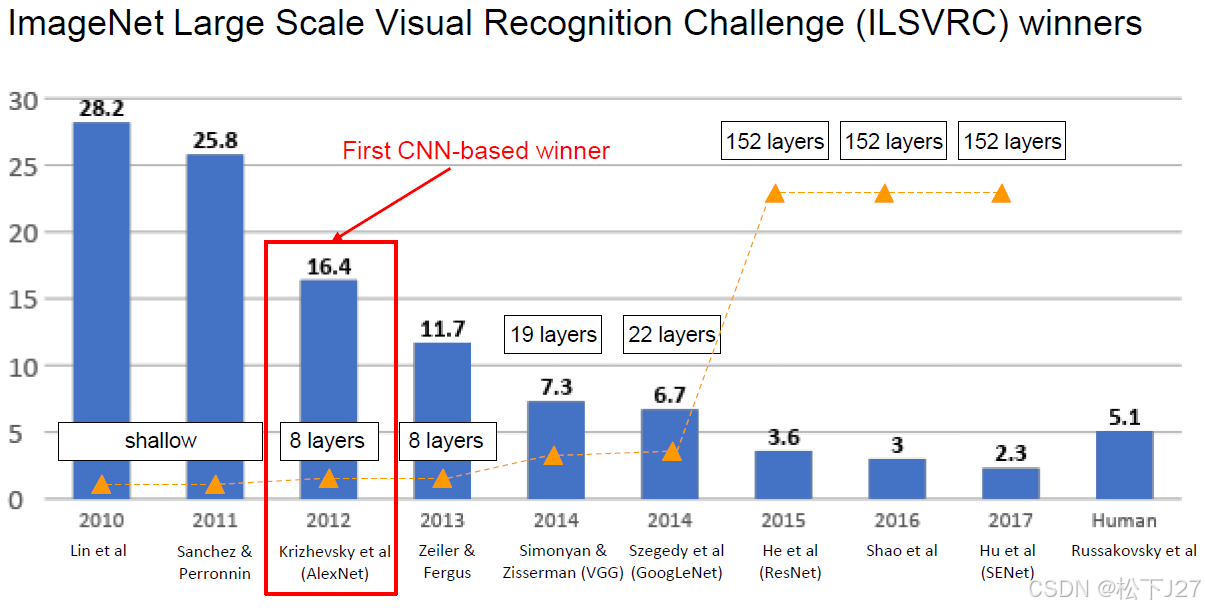
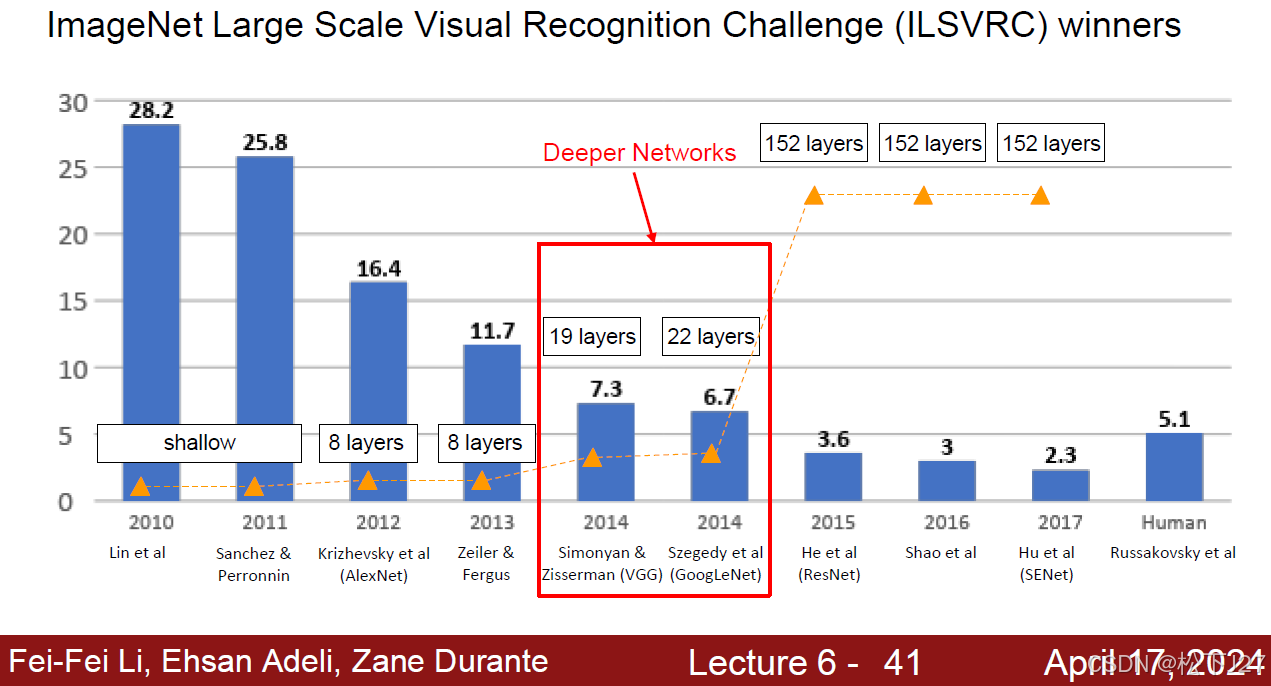
VGG是继AlexNet之后的后起之秀,相对于AlexNet他有如下特点:
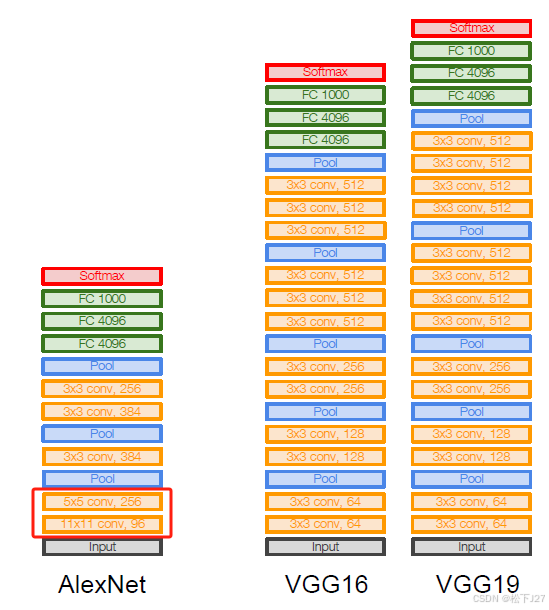
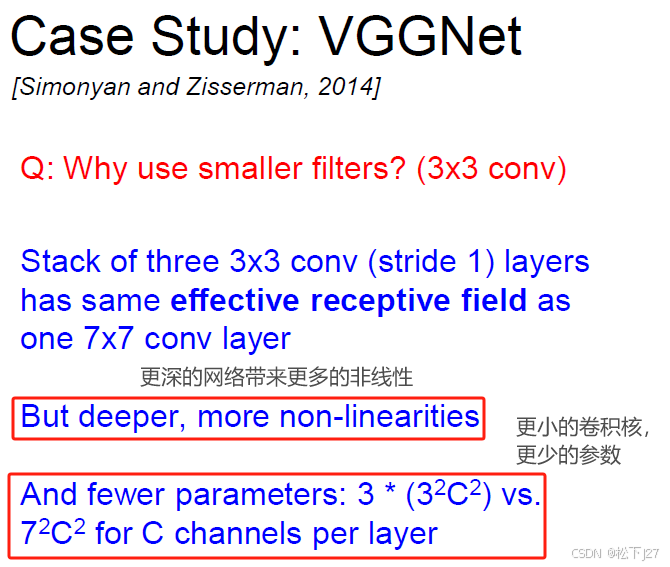
1,更深的层数!相对于仅有8层的AlexNet而言,VGG把层数增加到了16和19层。
2,更小的卷积核!不仅如此,相对于AlexNet中的大卷积核(如下图中的 11x11和5x5卷积核),VGG中只使用了3x3的小卷积核。
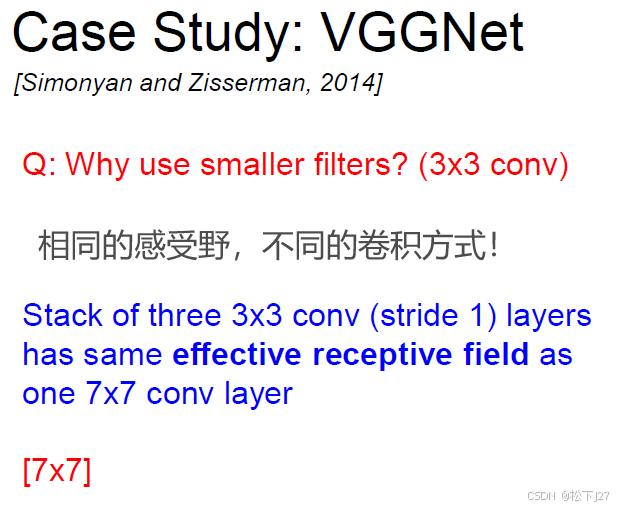
3,更深的网络,更多的非线性。通过用多个3x3的小filter去替换AlexNet中的大卷积核,不仅能够保持原有的感受野,还能让网络变得更深。
而且,由于网络加深了,模型的非线性也增加了(一般情况下,卷积层指的都是2D卷积后接一个非线性激活函数ReLU)。因此,网络的特征表示能力也加强了(ability of representation learning)。
ips: 表示学习(representation learning)是什么?
"表示学习是指从原始数据中自动学习特征或表示的一种方法,而不是依赖于人工设计的特征。在传统的机器学习中,特征工程(feature engineering)是一个重要的步骤,需要人工设计和选择合适的特征以便于模型学习。但是,表示学习通过算法自动提取数据的特征,减少了对人工干预的依赖。"
VGG16各层feature map可视化实战
一般情况下,一旦模型训练好之后(本例中是用ImageNet预先训练好的VGG16模型)随便喂一副输入图像,就能得到分类结果。但为了更好的理解模型所学习到的卷积核究竟是什么样的?这些卷积核和输入图像卷积后会得到什么样的结果?之所以最终会习得这样的卷积核?
这些问题都可以通过观察卷积后得到的activation map/feature map帮助人们明白。实际上有点类似于debug,只需把所有的中间结果保留下来就好了。
Part I 用预先训练好的模型对图像分类
1,导入需要的用到的库函数
python
from tensorflow.keras.applications.vgg16 import VGG16,preprocess_input,decode_predictions
from tensorflow.keras.preprocessing import image
import numpy as np
import matplotlib.pyplot as plt
from matplotlib import font_manager

# 设置字体为 SimHei (黑体)
plt.rcParams['font.sans-serif'] = ['SimHei']
# 避免中文字体显示不正常
plt.rcParams['axes.unicode_minus'] = False
2,导入基于ImageNet数据库预先训练好的Vgg16模型
为了看到prediction的分类结果,这里导入的是包含顶层(也就是全连接层FC和softmax层)的完整模型,并且命名为naive_model。
python
#使用基于imagenet预先训练好的模型
naive_model=VGG16(weights='imagenet')
3,导入原始输入图像,并对图像做适当的预处理以VGG16输入图像的要求
以一只螳螂为例,这是原始图像:
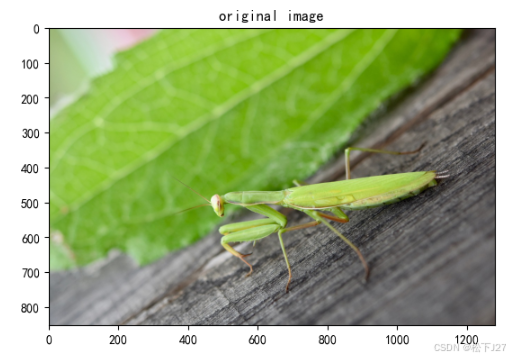
python
#load image同时resize到224x224的尺寸
myimg_path='images\mantis.jpg'

# 读取图像
myimg = image.load_img(myimg_path)
print(f"原始图像的尺寸为:{myimg.size}")

#imshow
fig=plt.figure()
plt.imshow(myimg)
plt.title("original image")

# 调整图像大小
myimg = myimg.resize((224, 224))
print(f"resize后的尺寸:{myimg.size}")

# 将图片转换为numpy数组
myimg_array = image.img_to_array(myimg)

# 对图片进行VGG16模型所需的预处理
myimg_array = preprocess_input(myimg_array)

#经过预处理后的图像
plt.figure()
plt.imshow(myimg_array)
plt.title("preprocessed image")

# 扩展维度以匹配模型期望的输入形状
myimg_array = np.expand_dims(myimg_array, axis=0)
print(f"拓展维度后的尺寸:{myimg_array.shape}")
这是经过预处理后的图像:
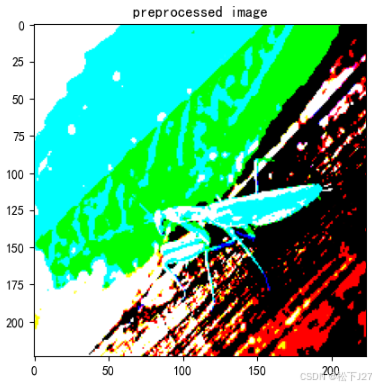
预处理过程共分为四步:1,把图像尺寸缩放为224x224。2,将图像类型转换为numpy数组。3,调用VGG16自带的preprocess函数。4,拓展一个维度。

4,使用包含FC+softmax的Naive Model对图像进行分类
python
# 使用模型对图片进行预测,返回的predictions是一个一维向量
predictions = naive_model.predict(myimg_array)
print(predictions.shape)

#解码预测结果,并打印出VGG16模型预测的前5个类别及其对应的概率
decode_preds=decode_predictions(predictions,top=5)[0]
print("当前图片的预测结果按照概率由高到低排列如下:\n")
for i, pred in enumerate(decode_preds):
    print(f"{i+1}: 类别ID: {pred[0]}, 类别名称: {pred[1]}, 概率: {pred[2]:.4f}")
输出前五个概率最高的类别名称:

其中:mantis=螳螂, grasshopper=蚂蚱,cricket=蟋蟀,walking stick=拐杖
绘制所有类别的概率分布,并显示最大概率神经元所对应的位置
python
#返回模型最后一层的神经元个数,即总的类别数
print("Vgg16模型总的类别数为:",naive_model.output_shape[1])
x=range(naive_model.output_shape[1])
y=predictions[0]

plt.figure(figsize=(10,3))
plt.bar(x,y)
plt.title("预测结果的整体概率分布")
plt.xlabel('1000个分类的索引')
plt.ylabel('对应概率')

#解析类别索引
max_prob=max(predictions[0])
max_prob_index=predictions[0].tolist().index(max_prob)
print("最大概率所对应的索引为:",max_prob_index)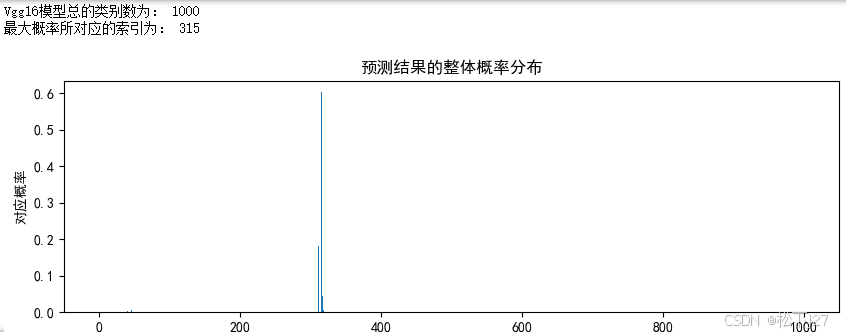
至此,已经完成了模型的创建,导入图像和使用模型对图像进行分类的全部过程,并且从预测结果上来看,也达到了比较满意的效果。后面就可以进入正题,通过显示每层经过卷积后(更准确的说应该是经过卷积和ReLU后)的feature map长什么样,帮助我们去更好的理解整个过程。
值得一提的是,为了能看到每层的feature map,我们需要重新创建一个模型。而且这个模型必须是不包含顶层的模型,既然不包含顶层,也就无法对图像分类了。好在分类结果在前面已经验证过了!
Part II feature map的可视化
1,创建不包含顶层的VGG16 model
python
# 使用基于 ImageNet 预训练的 VGG16 模型(不包含全连接层)
model_without_top = VGG16(weights='imagenet', include_top=False)
model_without_top.summary()

# 获取该模型的总层数
total_layers = len(model_without_top.layers)

# 输出总层数
print(f"模型的总层数为: {total_layers}")
上述代码先是创建了一个用ImageNet预先训练好的不包含顶层的VGG16模型,并命名为model_without_top。为了和标准VGG16模型以示区别,我分布输出了原始模型和不带顶层模型的模型总层数。


(点击图像可放大显示)
2,为即将创建的新模型配置新模型的输入和输出
python
# 新模型的输入层
new_model_Input=model_without_top.input

'''
创建了一个列表 layer_outputs,这个列表包含了 model_without_top 模型中每层的输出(即特征图)。

具体来说:model_without_top.layers 是 VGG16 模型中所有层的列表。layer.output 是每一层的输出张量(Tensor)。
这些输出张量代表了该层在输入图像上的特征图。遍历了模型中的所有层,并将每一层的输出张量添加到 layer_outputs 列表中。
'''

# 把每层的输出层都提出来,并保存到layer_outputs中
layer_outputs = []
for layer in model_without_top.layers:
    output = layer.output
    layer_outputs.append(output)

# 新模型的输出层
new_model_Output=layer_outputs
上述代码基于前面已经创建好的模型,分别获得了新模型的input层和output层。其中,新模型的input层与不包含顶层模型model_without_top的input相同,都是一个张量。而新模型的output层为model_without_top每层的输出,都是列表。
3,用keras的model函数创建可以输出feature map的新模型
python
'''
创建一个新的 Keras 模型 activation_model,这个新模型的输入层与原始 VGG16 模型的输入层相同,输出层是 layer_outputs 列表。
通过这种方式,activation_model 将返回每一层的特征图,而不是像原始模型那样只返回最终的分类结果。
'''

#创建一个新的 Keras 模型,这个模型的输出是 VGG16 模型每层的特征图
from tensorflow.keras.models import Model
activation_model = Model(inputs=new_model_Input, outputs=new_model_Output)
# 设置新模型的名字
activation_model.name = "vgg16_feature_map"
activation_model.summary()

# 输出每一层所对应的名字便于后面调用feature map时使用
for i in range(total_layers):
    print(f"第{i}层是{activation_model.layers[i].name}")
这段代码用之前选择好的input和output去创建了一个专门用于可视化各层feature map的新模型activation model。


通过观察两者的summary不难发现,这段代码所创建的activation_model与之前的model_without_top和完全一样。既然这样为什么还要用Model函数创建一个新的activation_model,而不直接用model_without_top?
虽然
model_without_top和activation_model最终输出的模型图一模一样,但两者的设计意图不同:
1,对于model_without_top而言: 它主要用于获取模型的最后一层特征图(即,改模型的最终输出),便于后续展平后输入到自定义的分类器中。因此,这个模型无法输出每一层的feature map/输出。
2,对于activation_model而言:通过Model重新构建的activation_model就是要保存各层的feature map,因此他的输出就是每一层的特征图/输出。可以在一次预测中获取所有层的输出。因此,尽管它与model_without_top的结构和输入是相同的,但它的输出是不同的,包含了所有中间层的输出。
4,加载图像并使用新模型对图像的分类结果进行预测
python
# 加载图像并调整为 224x224 的尺寸
myimg_path = 'images\\mantis.jpg'
myimg = image.load_img(myimg_path, target_size=(224, 224))

# 将图像转换为 NumPy 数组
myimg_array = image.img_to_array(myimg)

# 扩展维度以匹配模型期望的输入形状
myimg_array = np.expand_dims(myimg_array, axis=0)

# 对图像进行 VGG16 模型所需的预处理
myimg_array = preprocess_input(myimg_array)

# 使用新模型对图像进行预测,并获取所有层的特征图
activations = activation_model.predict(myimg_array)
Part III 可视化结果
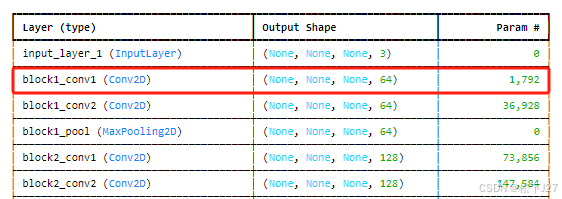
1,查看block1_conv1的feature map(也就是卷积后的结果),共有64个channel,即64个feature map,图像尺寸为224x224.
基于之前打印好的各层index, 在code中输入index就能得到对应层的前64个feature map。
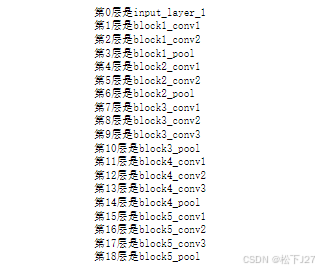
python
LayerNum=1#输入相应层的index
activation_map_layer=activations[LayerNum]
layer_name=model_without_top.layers[LayerNum].name
layer_size=activation_map_layer.shape
feature_map_num=activation_map_layer.shape[-1]
print(f"当前正在查看的layer是:{layer_name},他的尺寸是:{layer_size},总共有{feature_map_num}个feature map(chanel)")

# 绘制前8x8个特征图
N=activation_map_layer.shape[-1]
plt.figure(figsize=(35,35))
for i in range(N):
    plt.subplot(N//8+1, 8, i+1)
    plt.imshow(activation_map_layer[0, :, :, i])  # 显示特征图
    plt.axis('off')  # 隐藏坐标轴
plt.suptitle(f'Feature Maps from Layer: {model_without_top.layers[LayerNum].name}', fontsize=56)
plt.show()
这是block1_conv1的输出结果,即当前层的feature maps:
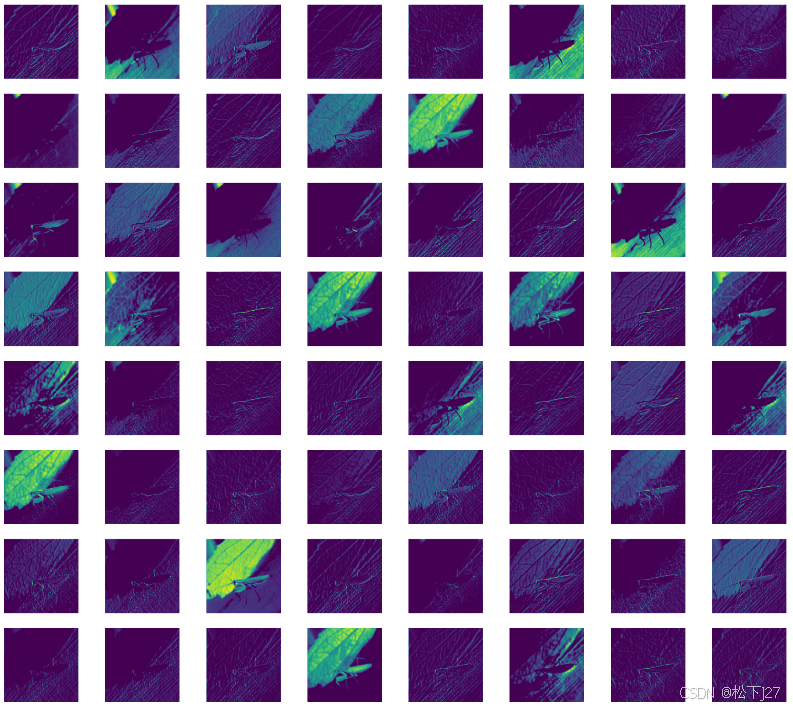
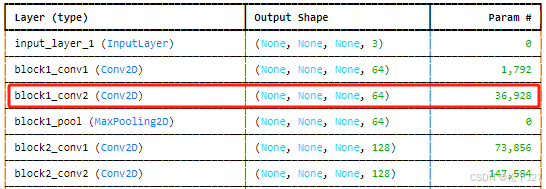
2, 查看block1_conv2的feature map,共有64个feature map,图像尺寸为224x224.
python
LayerNum=2#输入相应层的index
activation_map_layer=activations[LayerNum]
layer_name=model_without_top.layers[LayerNum].name
layer_size=activation_map_layer.shape
feature_map_num=activation_map_layer.shape[-1]
print(f"当前正在查看的layer是:{layer_name},他的尺寸是:{layer_size},总共有{feature_map_num}个feature map(chanel)")

# 绘制前8x8个特征图
N=64
plt.figure(figsize=(35,35))
for i in range(N):
    plt.subplot(N//8+1, 8, i+1)
    plt.imshow(activation_map_layer[0, :, :, i])  # 显示特征图
    plt.axis('off')  # 隐藏坐标轴
plt.suptitle(f'Feature Maps from Layer: {model_without_top.layers[LayerNum].name}', fontsize=56)
plt.show()
block1_conv2的输出结果:
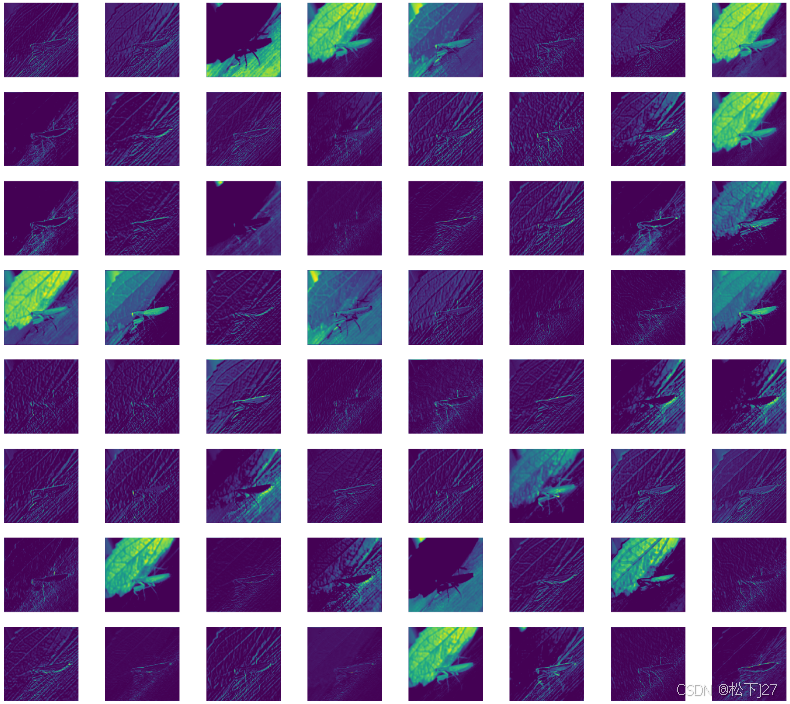
小结:
通过简单的比较block1_conv1和block1_conv2,感觉他们所提取的特征都差不多,大同小异,重在提取图像中的细节特征。值得一提的是block1_conv2是在block1_conv1的基础上求得的。
细节特征提取 :在网络的早期层,通常会提取低级别的特征,比如边缘、纹理和颜色。这些层提取的特征往往是相似的,因为它们处理的都是图像的基本结构。
block1_conv2进一步细化了block1_conv1的输出特征,从而提取出更加细微的细节。
3,查看block1_pool的feature map,共有64个feature map,图像尺寸为112x112.
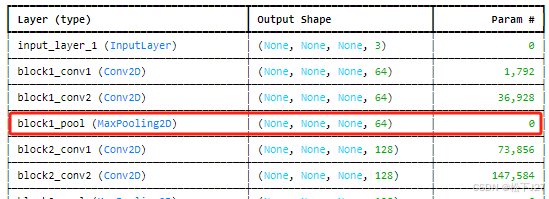
python
LayerNum=3#输入相应层的index
activation_map_layer=activations[LayerNum]
layer_name=model_without_top.layers[LayerNum].name
layer_size=activation_map_layer.shape
feature_map_num=activation_map_layer.shape[-1]
print(f"当前正在查看的layer是:{layer_name},他的尺寸是:{layer_size},总共有{feature_map_num}个feature map(chanel)")

# 绘制前8x8个特征图
N=64
plt.figure(figsize=(35,35))
for i in range(N):
    plt.subplot(N//8+1, 8, i+1)
    plt.imshow(activation_map_layer[0, :, :, i])  # 显示特征图
    plt.axis('off')  # 隐藏坐标轴
plt.suptitle(f'Feature Maps from Layer: {model_without_top.layers[LayerNum].name}', fontsize=56)
plt.show()
block1_pool的输出结果:
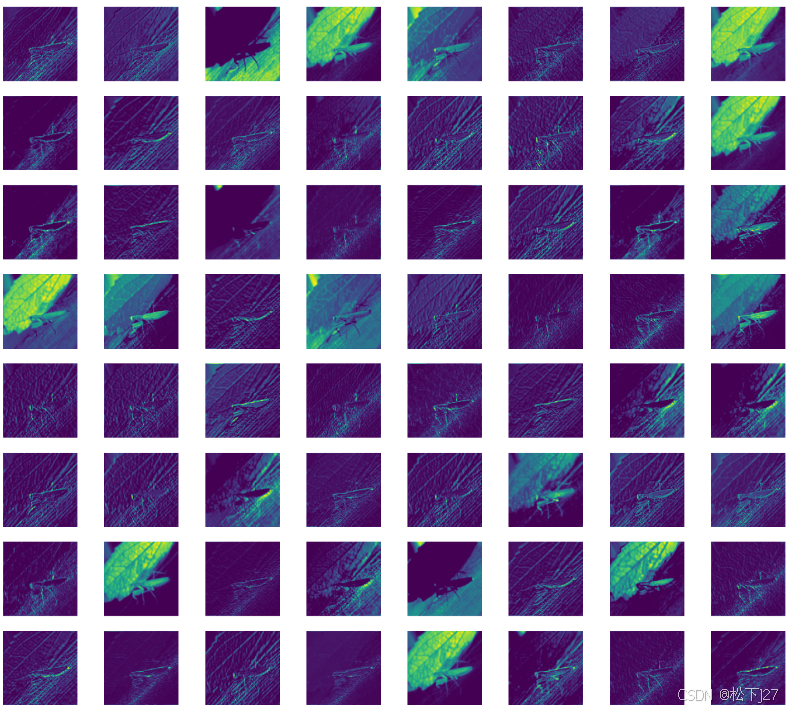
小结:
比较block1_conv2和block1_pool的feature map没有发生任何改变,只不过经过pooling layer处理后,图像的尺寸缩小为一半。
尺寸缩小与信息保留 :池化层(pooling layer)的主要功能是缩小特征图的尺寸,减少计算量,同时保留关键信息。正如你所观察到的,
block1_pool主要是通过最大池化(max pooling)操作将图像尺寸缩小一半,特征图本身的内容和形状特征在一定程度上保持不变,但分辨率降低了。
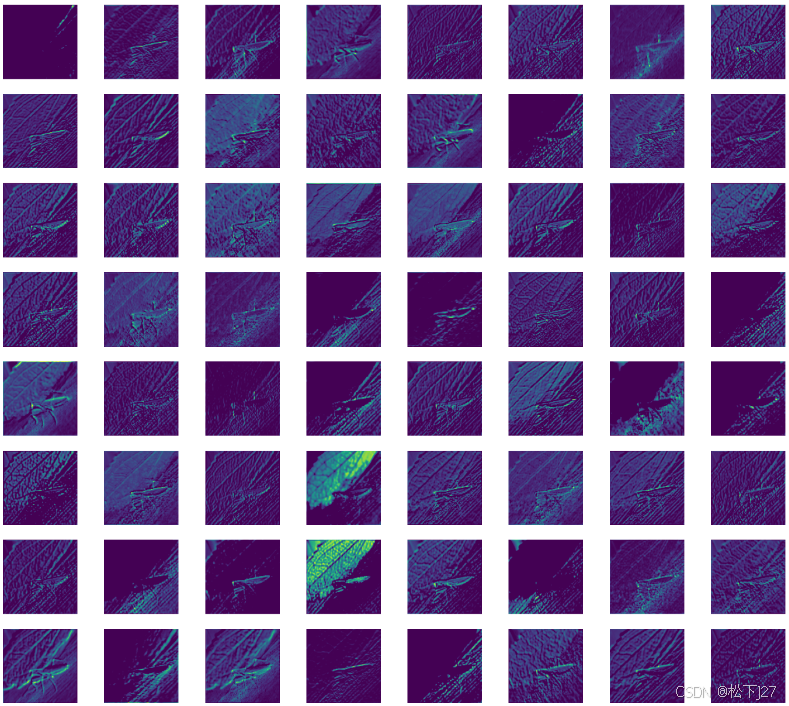
4, 查看block2_conv1的feature map,共有128个feature map,图像尺寸为112x112.
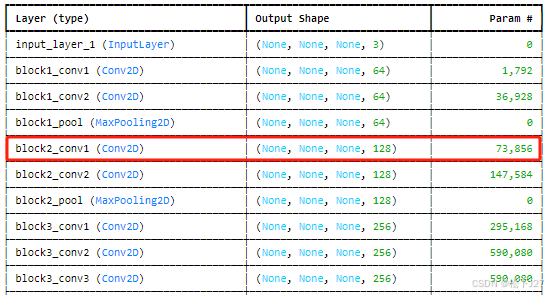
python
LayerNum=4#输入相应层的index
activation_map_layer=activations[LayerNum]
layer_name=model_without_top.layers[LayerNum].name
layer_size=activation_map_layer.shape
feature_map_num=activation_map_layer.shape[-1]
print(f"当前正在查看的layer是:{layer_name},他的尺寸是:{layer_size},总共有{feature_map_num}个feature map(chanel)")

# 绘制前8x8个特征图
N=64
plt.figure(figsize=(35,35))
for i in range(N):
    plt.subplot(N//8+1, 8, i+1)
    plt.imshow(activation_map_layer[0, :, :, i])  # 显示特征图
    plt.axis('off')  # 隐藏坐标轴
plt.suptitle(f'Feature Maps from Layer: {model_without_top.layers[LayerNum].name}', fontsize=56)
plt.show()
block2_conv1的输出结果:
小结:
比较block1_conv2和block2_conv1,经过尺寸缩小后block2_conv1所提取的是轮廓特征。
逐层抽象化 :随着网络深度的增加,网络开始提取更复杂的特征。
block2_conv1相比block1_conv2更关注于较大尺度的轮廓特征,而不是单纯的细节。这个过程类似于从简单的边缘检测过渡到更复杂的形状和结构识别。
5,查看block3_con1的feature map,共有256个feature map,图像尺寸为56x56.
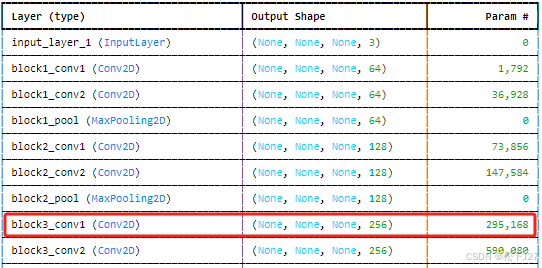
python
LayerNum=7#输入相应层的index
activation_map_layer=activations[LayerNum]
layer_name=model_without_top.layers[LayerNum].name
layer_size=activation_map_layer.shape
feature_map_num=activation_map_layer.shape[-1]
print(f"当前正在查看的layer是:{layer_name},他的尺寸是:{layer_size},总共有{feature_map_num}个feature map(chanel)")

# 绘制前8x8个特征图
N=64
plt.figure(figsize=(35,35))
for i in range(N):
    plt.subplot(N//8+1, 8, i+1)
    plt.imshow(activation_map_layer[0, :, :, i])  # 显示特征图
    plt.axis('off')  # 隐藏坐标轴
plt.suptitle(f'Feature Maps from Layer: {model_without_top.layers[LayerNum].name}', fontsize=56)
plt.show()
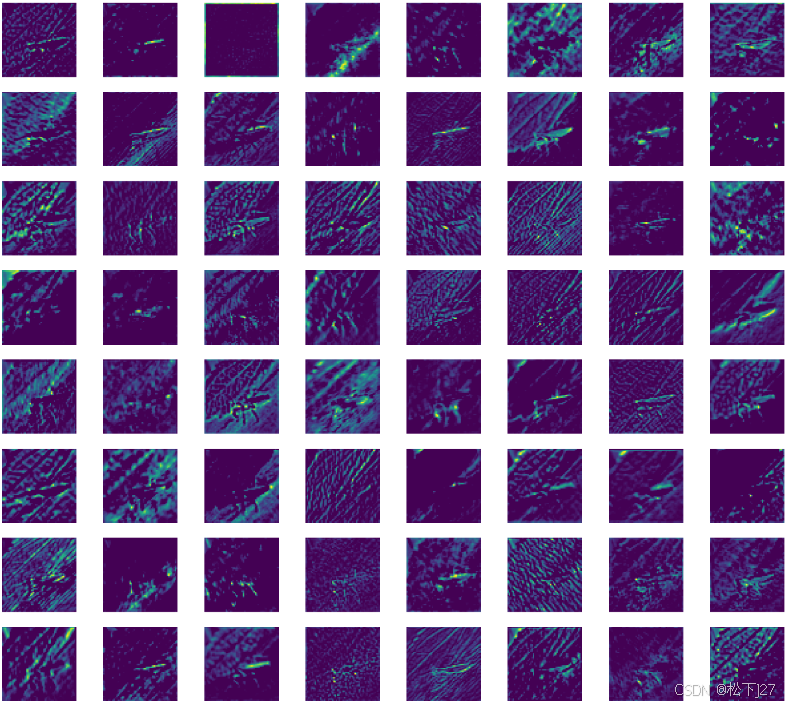
block3_conv1的输出结果:
小结:
继block1_conv1,block2_conv1之后block3_conv1的尺寸缩小的更多,提取更为抽象的轮廓特征。
逐层抽象化 : 在更深层次的卷积层,网络逐渐关注更复杂的特征组合。例如,
block3_conv1可能会从之前层次中提取的边缘和轮廓进一步组合,形成对更复杂形状的表示。这也是网络逐步实现从具体到抽象的过程,特征变得越来越难以用肉眼辨别。
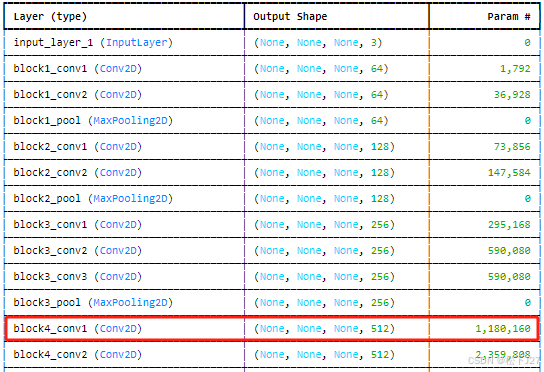
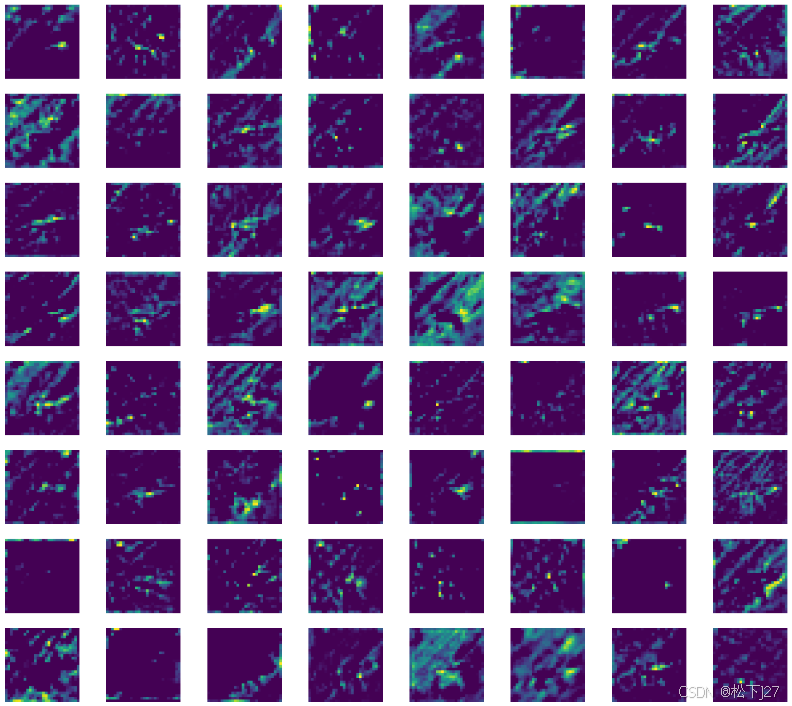
6,查看block4_con1的feature map,共有512个feature map,图像尺寸为28x28.
python
LayerNum=11#输入相应层的index
activation_map_layer=activations[LayerNum]
layer_name=model_without_top.layers[LayerNum].name
layer_size=activation_map_layer.shape
feature_map_num=activation_map_layer.shape[-1]
print(f"当前正在查看的layer是:{layer_name},他的尺寸是:{layer_size},总共有{feature_map_num}个feature map(chanel)")

# 绘制前8x8个特征图
N=64
plt.figure(figsize=(35,35))
for i in range(N):
    plt.subplot(N//8+1, 8, i+1)
    plt.imshow(activation_map_layer[0, :, :, i])  # 显示特征图
    plt.axis('off')  # 隐藏坐标轴
plt.suptitle(f'Feature Maps from Layer: {model_without_top.layers[LayerNum].name}', fontsize=56)
plt.show()
block4_conv1的输出结果:
7, 查看block5_con1的feature map,共有512个feature map,图像尺寸为14x14.
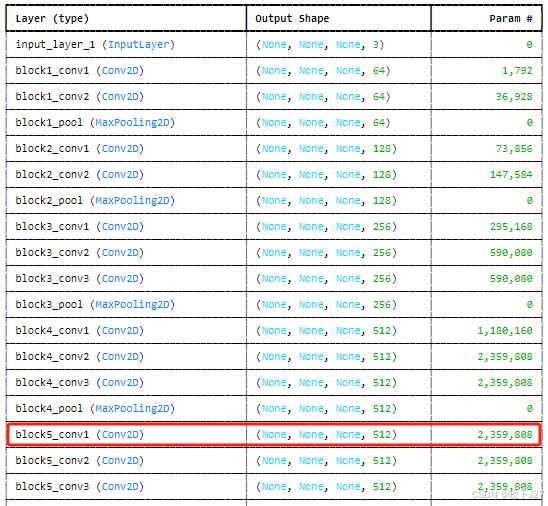
python
LayerNum=15#输入相应层的index
activation_map_layer=activations[LayerNum]
layer_name=model_without_top.layers[LayerNum].name
layer_size=activation_map_layer.shape
feature_map_num=activation_map_layer.shape[-1]
print(f"当前正在查看的layer是:{layer_name},他的尺寸是:{layer_size},总共有{feature_map_num}个feature map(chanel)")

# 绘制前8x8个特征图
N=64
plt.figure(figsize=(35,35))
for i in range(N):
    plt.subplot(N//8+1, 8, i+1)
    plt.imshow(activation_map_layer[0, :, :, i])  # 显示特征图
    plt.axis('off')  # 隐藏坐标轴
plt.suptitle(f'Feature Maps from Layer: {model_without_top.layers[LayerNum].name}', fontsize=56)
plt.show()
block5_conv1的输出结果:
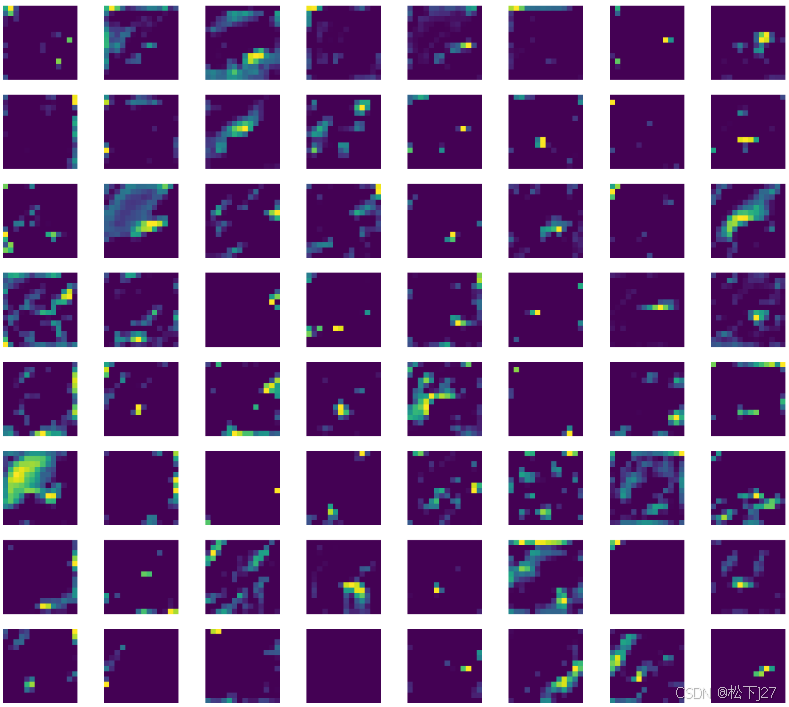
小结:
随着模型的深度越来越深,feature map的尺寸也越来越小,所提取的特征人眼也越来越难辨识,越来越抽象。一直到最后一层block5_conv3,基本上就完成了对原始输入图像的decode,后续展平后就可以基于FC+softmax分类了。
抽象程度和可识别性 : 随着网络的加深,特征图的尺寸越来越小,特征越来越抽象。到
block5_conv3时,网络已经能够提取到足够复杂和高度抽象的特征,这些特征对于模型的最终分类任务至关重要。虽然人眼难以直接理解这些特征图,但它们实际上编码了输入图像中非常复杂的高层次信息。
(全文完)
--- 作者,松下J27
参考文献(鸣谢):
1,代码实战-VGG16各层输出结果可视化_哔哩哔哩_bilibili
2,Stanford University CS231n: Deep Learning for Computer Vision

(配图与本文无关)
古诗词赏析:
《过零丁洋》
宋---文天祥
辛苦遭逢起一经,干戈寥落四周星。
山河破碎风飘絮,身世浮沉雨打萍。
惶恐滩头说惶恐,零丁洋里叹零丁。
人生自古谁无死?留取丹心照汗青。
**版权声明:**所有的笔记,可能来自很多不同的网站和说明,在此没法一一列出,如有侵权,请告知,立即删除。欢迎大家转载,但是,如果有人引用或者COPY我的文章,必须在你的文章中注明你所使用的图片或者文字来自于我的文章,否则,侵权必究。 ----松下J27