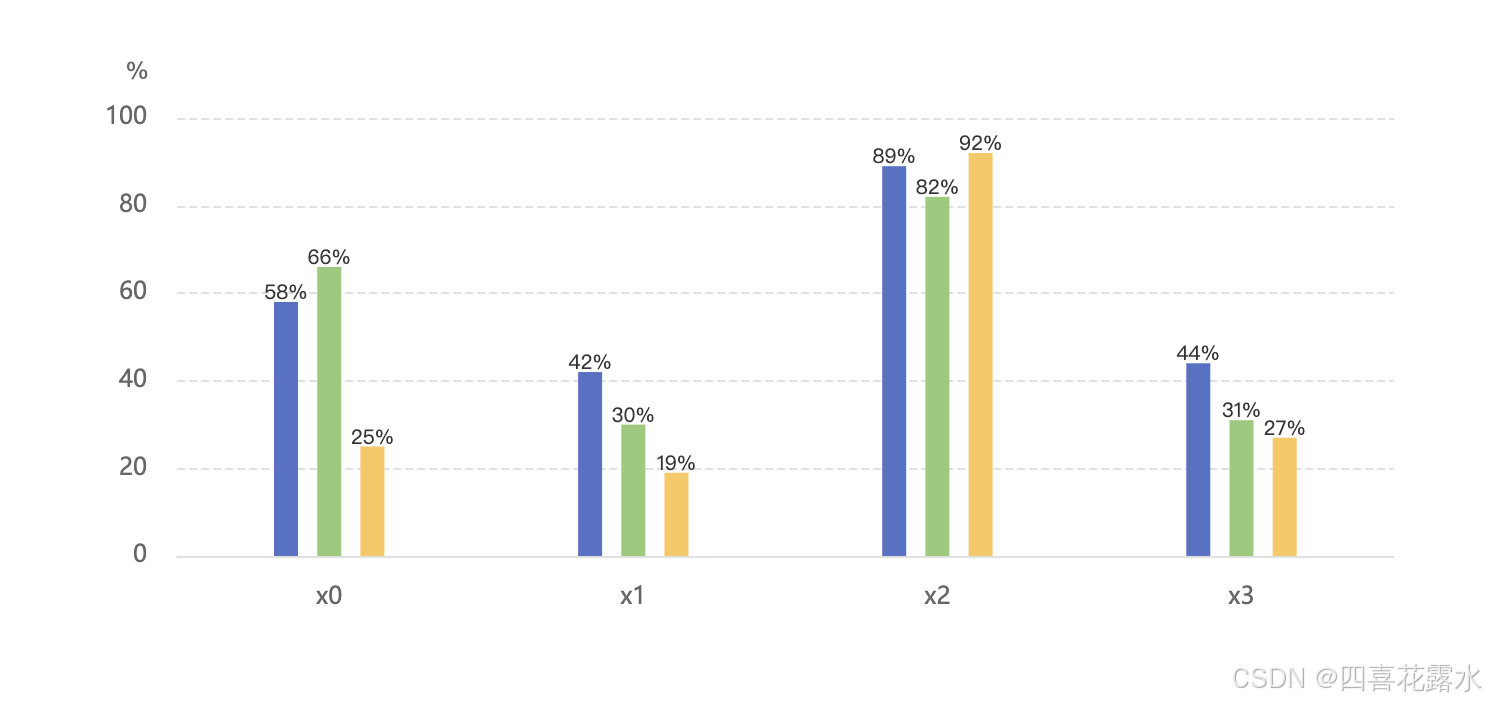
Echart 柱形图 相同项提取复用

html 复制代码
<!DOCTYPE html>
<html lang="en">

<head>
    <meta charset="UTF-8">
    <meta name="viewport" content="width=device-width, initial-scale=1.0">
    <title>Document</title>
    <script src="http://libs.baidu.com/jquery/2.0.0/jquery.min.js"></script>
    <script src="https://cdn.jsdelivr.net/npm/echarts@5.2.2/dist/echarts.min.js"></script>
    <style>
        .chart-item {
            width: 50%;
            height: 300px;
            margin: 48px auto;
        }
    </style>
</head>

<body>
    <div class="chart-item" id="chart"></div>
    <script>
        // 提取
        // 把会重复用到的部分提取出来,可以封装到另一个js文件中
        var commonTool = {
            opt: {
                axis: {
                    splitLine: {
                        show: true,
                        lineStyle: {
                            type: 'dashed',
                            color: "#e0e0e0",
                            width: 1
                        }
                    },
                    axisLine: {
                        show: true,
                        lineStyle: {
                            color: "#e0e0e0",
                            width: 1
                        }
                    },
                    axisLabel: function (opt) {
                        var defaulte = {
                            textStyle: {
                                color: "#666",
                                fontSize: 12
                            },
                            fontFamily: "Microsoft YaHei",
                            margin: 15

                        };
                        var opt = $.extend("", defaulte, opt);
                        return opt;
                    },
                }
            }
        }
        // 提取 END

        var myChartArr = [];
        function drawChart(id, data) {
            var myEchart = echarts.init(document.getElementById(id));
            var option = {
                tooltip: {
                    trigger: "axis",
                    backgroundColor: "rgba(0,0,0,0.66)",
                    borderColor: 'rgba(0,0,0,0)',
                    axisPointer: {
                        type: "shadow",
                        label: {
                            show: false,
                        },
                    },
                    textStyle: {
                        color: '#fff',
                        fontSize: 12,
                    },
                },
          
                grid: {
                    left: "6%",
                    right: "3%",
                    bottom: "3%",
                    top: "15%",
                    containLabel: true,
                    z: 22,
                },
                xAxis: [{
                    type: "category",
                    data: data[0],
                    axisLabel: commonTool.opt.axis.axisLabel(),
                    axisLine: commonTool.opt.axis.axisLine,
                    axisTick: commonTool.opt.axis.axisTick,
                    z: 1
                }],
                yAxis: [{
                    type: "value",
                    name: "%",
                    nameTextStyle: {
                        color: '#666',
                        fontSize: 12,
                        padding: [0, 40, 3, 0]
                    },
                    axisLabel: commonTool.opt.axis.axisLabel(),
                    splitLine: commonTool.opt.axis.splitLine,
                    splitArea: {
                        show: false
                    },
                    axisTick: {
                        show: false
                    },
                    axisLine: {
                        show: false,
                    },
                    z: 1
                }],
                series: [{
                    name: "item1",
                    type: "bar",
                    barWidth: "12",
                    barGap: "80%",
                    data: data[1],
                    label: {
                        normal: {
                            show: true,
                            position: 'top',
                            color: "#333",
                            distance: 0,
                            formatter: '{c}%',
                            fontSize: 10
                        }
                    },
                    z: 1
                }, {
                    name: "item2",
                    type: "bar",
                    barWidth: "12",
                    barGap: "80%",
                    data: data[2],
                    label: {
                        normal: {
                            show: true,
                            position: 'top',
                            color: "#333",
                            distance: 0,
                            formatter: '{c}%',
                            fontSize: 10
                        }
                    },
                    z: 1
                }, {
                    name: "item3",
                    type: "bar",
                    barWidth: "12",
                    barGap: "80%",
                    data: data[3],
                    label: {
                        normal: {
                            show: true,
                            position: 'top',
                            color: "#333",
                            distance: 0,
                            formatter: '{c}%',
                            fontSize: 10
                        }
                    },
                    z: 1
                }]
            };
            myEchart.setOption(option)
            myChartArr.push(myEchart)
        }


        var dataX = [],
            dataX2 = [],
            dataY1 = [],
            dataY2 = [],
            dataY3 = [];
        for (var i = 0; i < 4; i++) {
            dataX.push("x" + i);
            dataY1.push(Math.ceil(Math.random() * 1000 % 100));
            dataY2.push(Math.ceil(Math.random() * 1000 % 100));
            dataY3.push(Math.ceil(Math.random() * 1000 % 100));
        }
        drawChart('chart', [dataX, dataY1, dataY2, dataY3])


        $(window).resize(function () {
            for (var i = 0; i < myChartArr.length; i++) {
                myChartArr[i].resize();
            }
        })
    </script>
</body>

</html>
相关推荐
Python大数据分析@14 分钟前
通俗的讲,网络爬虫到底是什么?
前端·爬虫·网络爬虫
不爱学英文的码字机器31 分钟前
[操作系统] 环境变量详解
开发语言·javascript·ecmascript
Lysun00135 分钟前
vue2的$el.querySelector在vue3中怎么写
前端·javascript·vue.js
jerry-891 小时前
Centos类型服务器等保测评整/etc/pam.d/system-auth
java·前端·github
工业甲酰苯胺1 小时前
深入解析 Spring AI 系列:解析返回参数处理
javascript·windows·spring
小爬菜1 小时前
Django学习笔记(启动项目)-03
前端·笔记·python·学习·django
想要打 Acm 的小周同学呀1 小时前
前端Vue2项目使用md编辑器
前端·编辑器·vue2·markdown 语法
计算机-秋大田1 小时前
基于SSM的家庭记账本小程序设计与实现(LW+源码+讲解)
java·前端·后端·微信小程序·小程序·课程设计
海的预约2 小时前
VUE之路由Props、replace、编程式路由导航、重定向
前端·vue.js·智能路由器
西柚与蓝莓3 小时前
报错:{‘csrf_token‘: [‘The CSRF token is missing.‘]}
前端·flask