- **线程活动时间线:**列出属于您的应用程序进程的每个线程,并使用下面列出的颜色沿着时间线指示其活动。记录跟踪后,您可以从此时间线中选择一个线程,以在跟踪窗格中检查其数据。
- **绿色:**线程处于活动状态或准备好使用 CPU。也就是说,它处于正在运行或可运行状态。
- **黄色:**线程处于活动状态,但正在等待 I/O 操作(例如磁盘或网络 I/O),然后才能完成其工作。
- **灰色:**线程正在休眠,不消耗任何 CPU 时间。当线程需要访问尚不可用的资源时,有时会发生这种情况。线程要么进入自愿睡眠状态,要么内核将线程置于睡眠状态,直到所需的资源可用。CPU Profiler 还报告 Android Studio 和 Android 平台添加到应用程序进程中的线程的 CPU 使用情况,例如
JDWP、Profile Saver、Studio:VMStats、Studio:Perfa和Studio:Heartbeat(尽管线程活动时间线中显示的确切名称可能有所不同)。Android Studio 会报告此数据,以便您可以确定线程活动和 CPU 使用率实际上是由应用代码引起的。
**三、**Android studio Memory调试
选择监测memory:
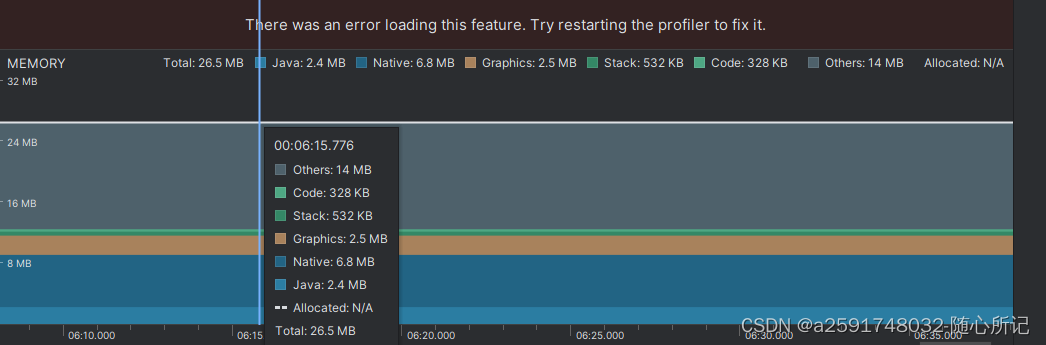
官网说明:
- Java: Memory from objects allocated from Java or Kotlin code.
- Native: Memory from objects allocated from C or C++ code.
Even if you're not using C++ in your app, you might see some native memory used here because the Android framework uses native memory to handle various tasks on your behalf, such as when handling image assets and other graphics---even though the code you've written is in Java or Kotlin.
- Graphics: Memory used for graphics buffer queues to display pixels to the screen, including GL surfaces, GL textures, and so on. (Note that this is memory shared with the CPU, not dedicated GPU memory.)
- Stack: Memory used by both native and Java stacks in your app. This usually relates to how many threads your app is running.
- Code: Memory that your app uses for code and resources, such as dex bytecode, optimized or compiled dex code, .so libraries, and fonts.
- Others: Memory used by your app that the system isn't sure how to categorize.
- Allocated: The number of Java/Kotlin objects allocated by your app. This does not count objects allocated in C or C++.
When connected to a device running Android 7.1 and lower, this allocation count starts only at the time the Memory Profiler connected to your running app. So any objects allocated before you start profiling are not accounted for. However, Android 8.0 and higher includes an on-device profiling tool that keeps track of all allocations, so this number always represents the total number of Java objects outstanding in your app on
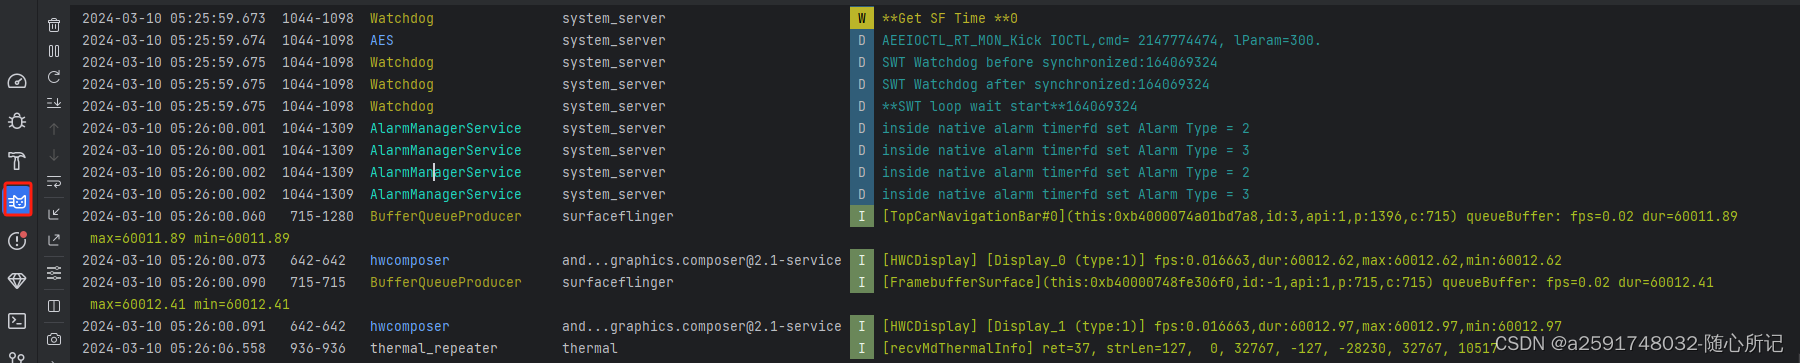
四、Android studio logcat调试
点击如下红框进行logcat调试:
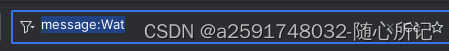
过滤条件:
//输入package:(输入一个p就会有提示的) ,+ 你的包名 package:com.test.test
// 输入level: ,后面加上等级,如info,debug,warning等 // 当等级为Info时,过滤Info及以上的日志 level:debug
// 输入tag: ,后面跟上你要过滤的TAG,此功能同老版本的AS tag:TAG
// 输入message: +过滤的关键字 message:KW
详细可 参考官网:
最后
我一直以来都有整理练习大厂面试题的习惯,有随时跳出舒服圈的准备,也许求职者已经很满意现在的工作,薪酬,觉得习惯而且安逸。
不过如果公司突然倒闭,或者部门被裁减,还能找到这样或者更好的工作吗?
我建议各位,多刷刷面试题,知道最新的技术,每三个月可以去面试一两家公司,因为你已经有不错的工作了,所以可以带着轻松的心态去面试,同时也可以增加面试的经验。
我可以将最近整理的一线互联网公司面试真题+解析分享给大家,大概花了三个月的时间整理2246页,帮助大家学习进步。
由于篇幅限制,文档的详解资料太全面,细节内容太多,所以只把部分知识点截图出来粗略的介绍,每个小节点里面都有更细化的内容!以下是部分内容截图:
加入社区》https://bbs.csdn.net/forums/4304bb5a486d4c3ab8389e65ecb71ac0
1725642325874)]
加入社区》https://bbs.csdn.net/forums/4304bb5a486d4c3ab8389e65ecb71ac0