一、目的:基于WPF的DrawingVisual开发的Chart图表和表格绘制
二、预览
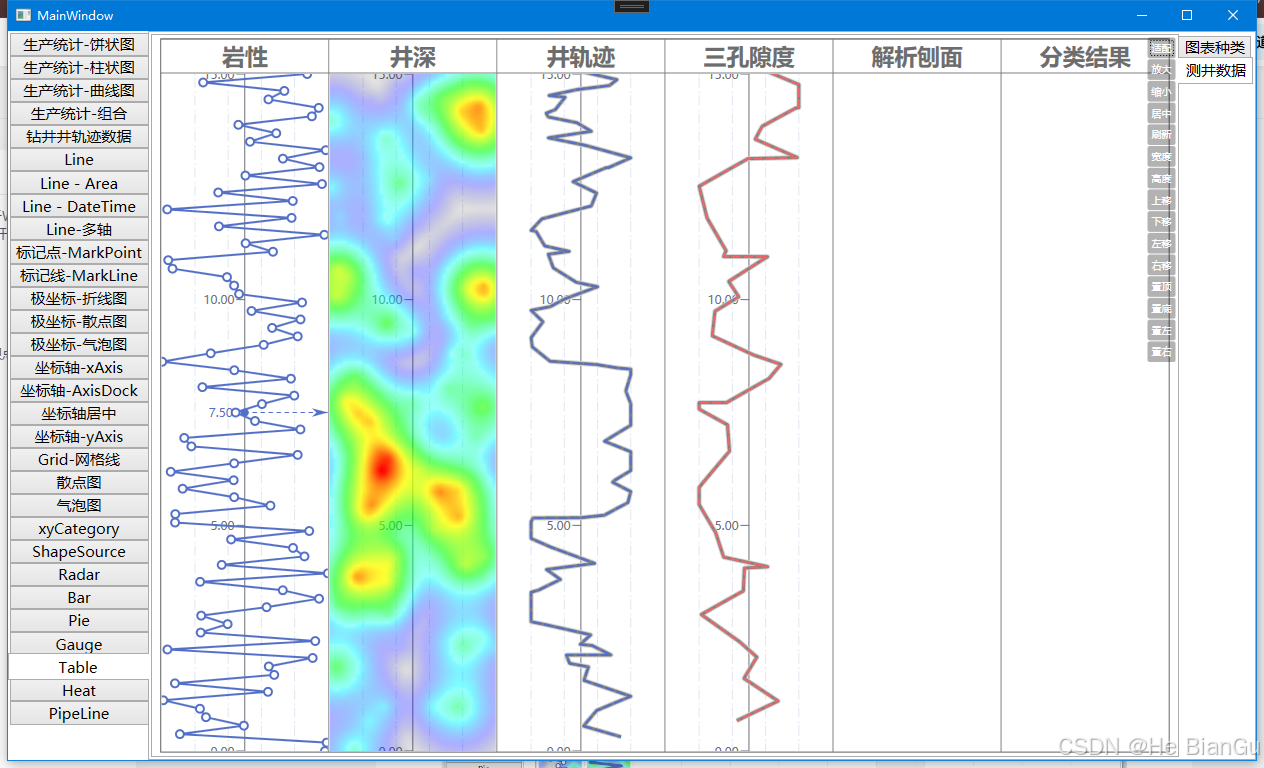
钻井井轨迹表格数据演示示例(应用Table布局,模拟井轨迹深度的绘制)
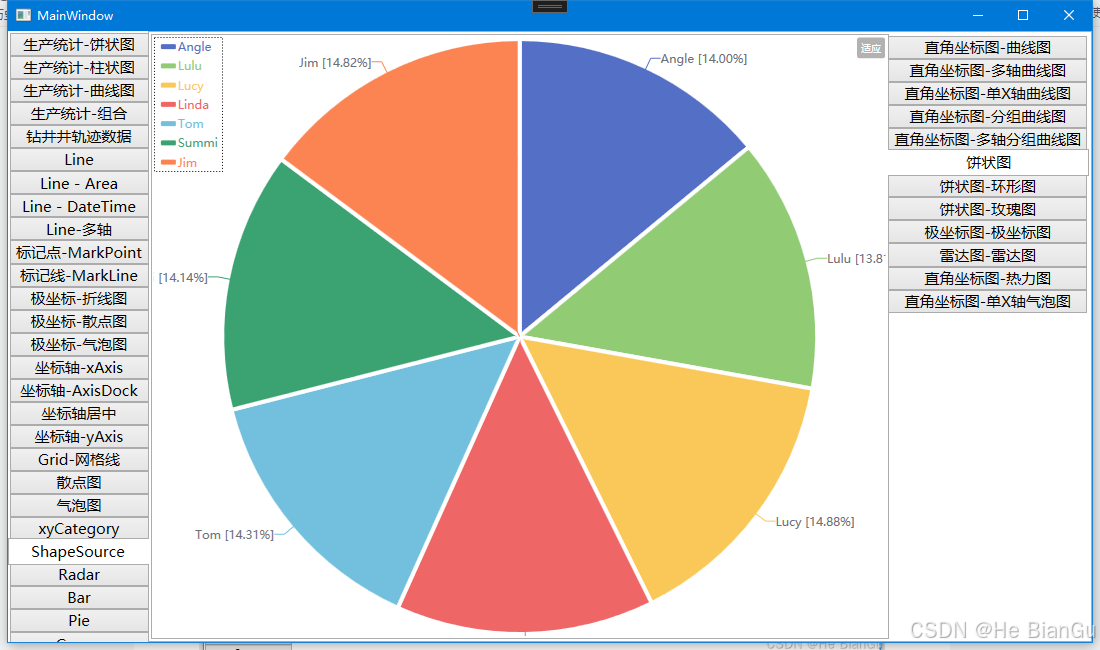
饼图表格数据演示示例(应用Table布局,模拟多个饼状图组合显示)
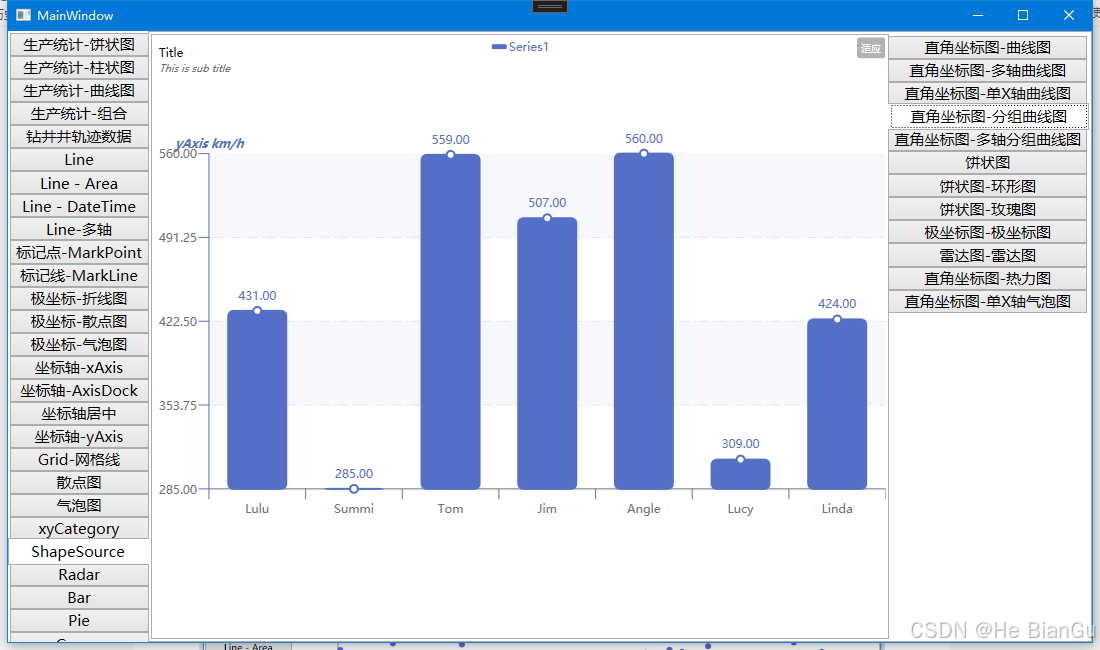
柱状图表格数据演示示例(应用Table布局,模拟多个柱状图组合显示)
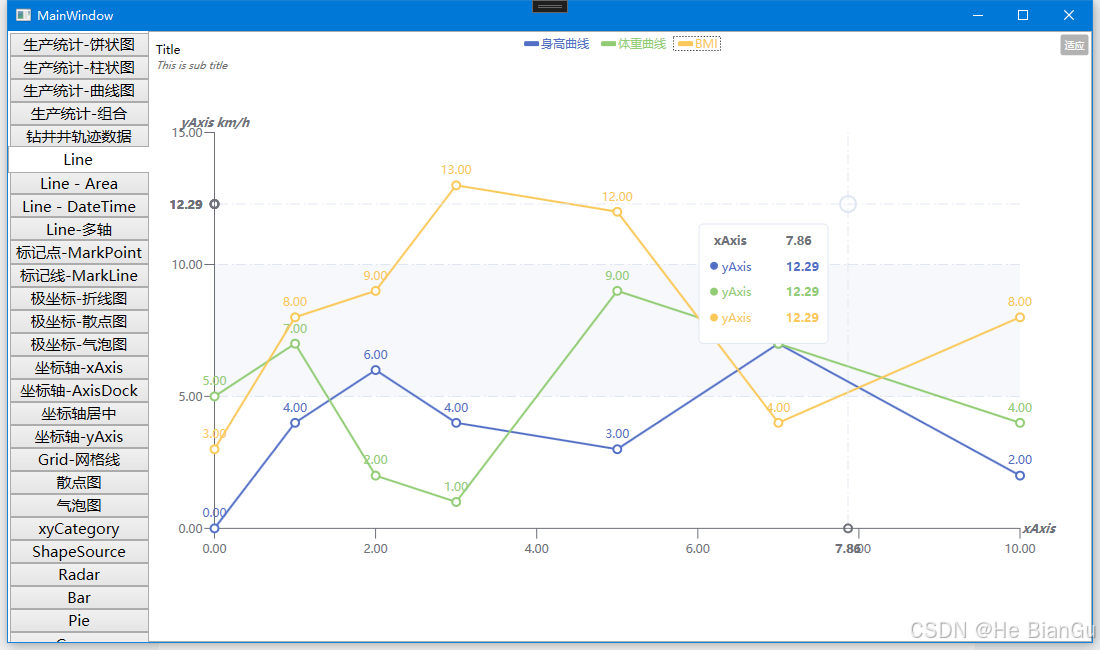
折线图表格数据演示示例(应用Table布局,模拟曲线图数据显示)
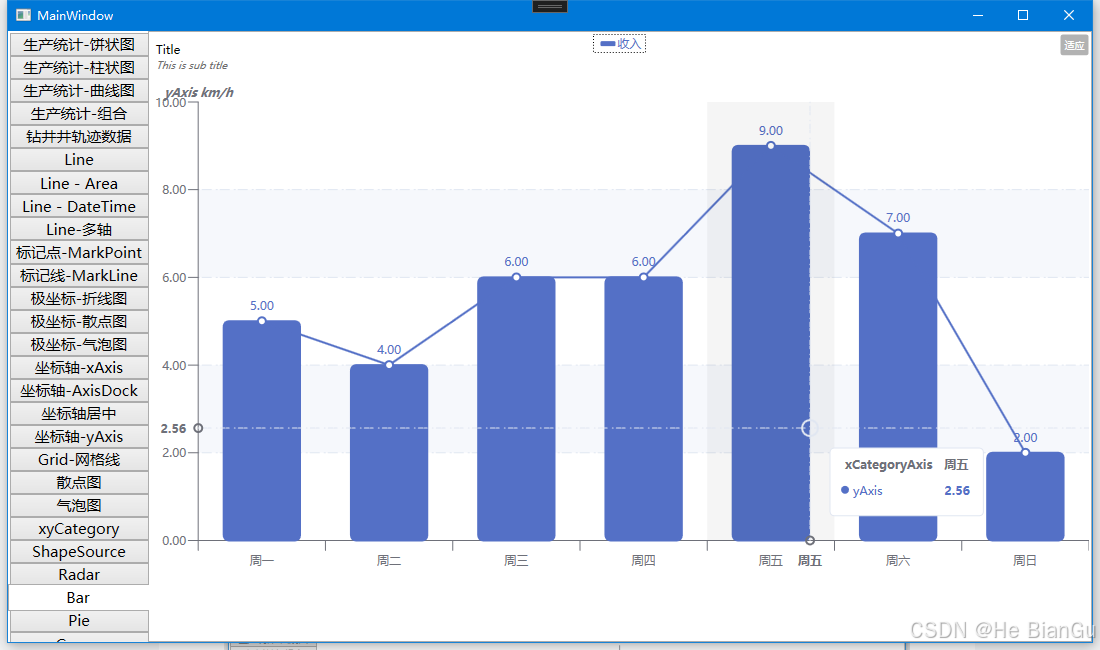
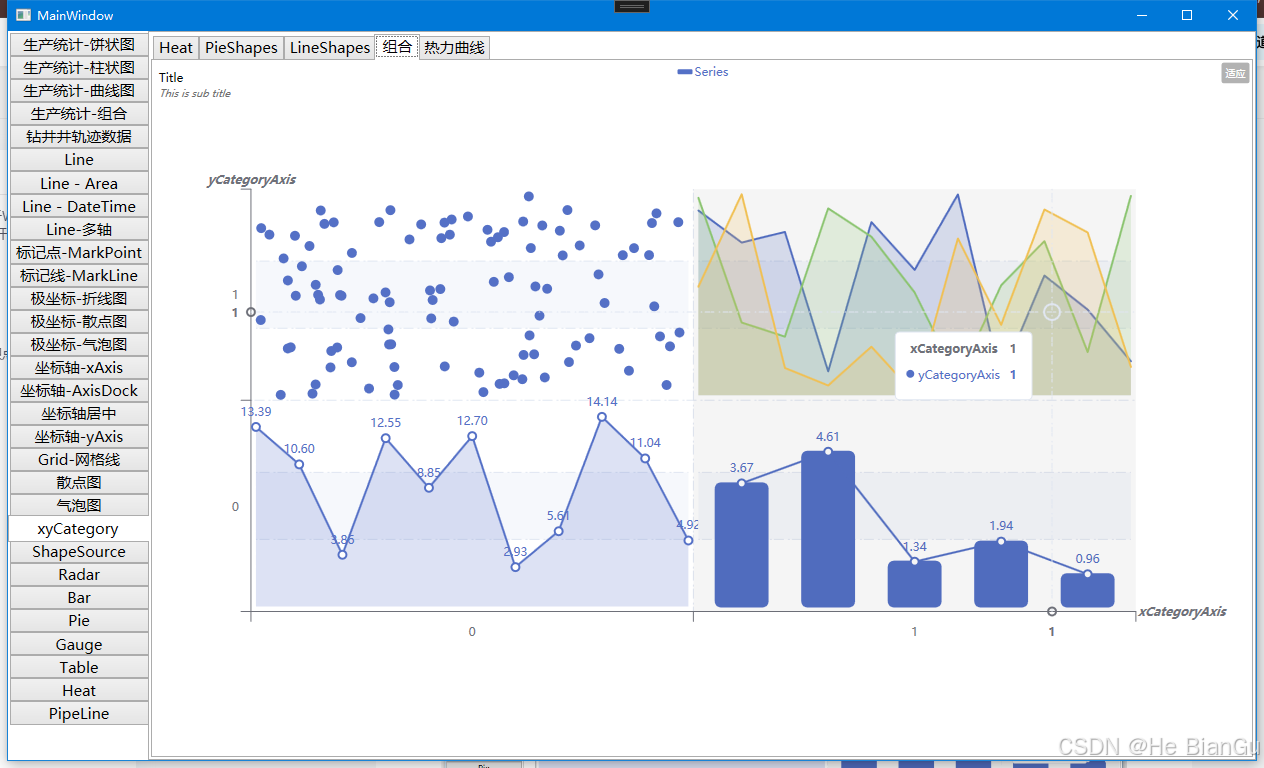
组合图表格数据演示示例 (应用Table布局,模拟散点、气泡图、折线图和柱状图显示)
三、环境
VS2022,NET7
四、主要功能
折线图(支持显示文本,显示点等设置)
按聚类显示 (支持横坐标按分类显示)
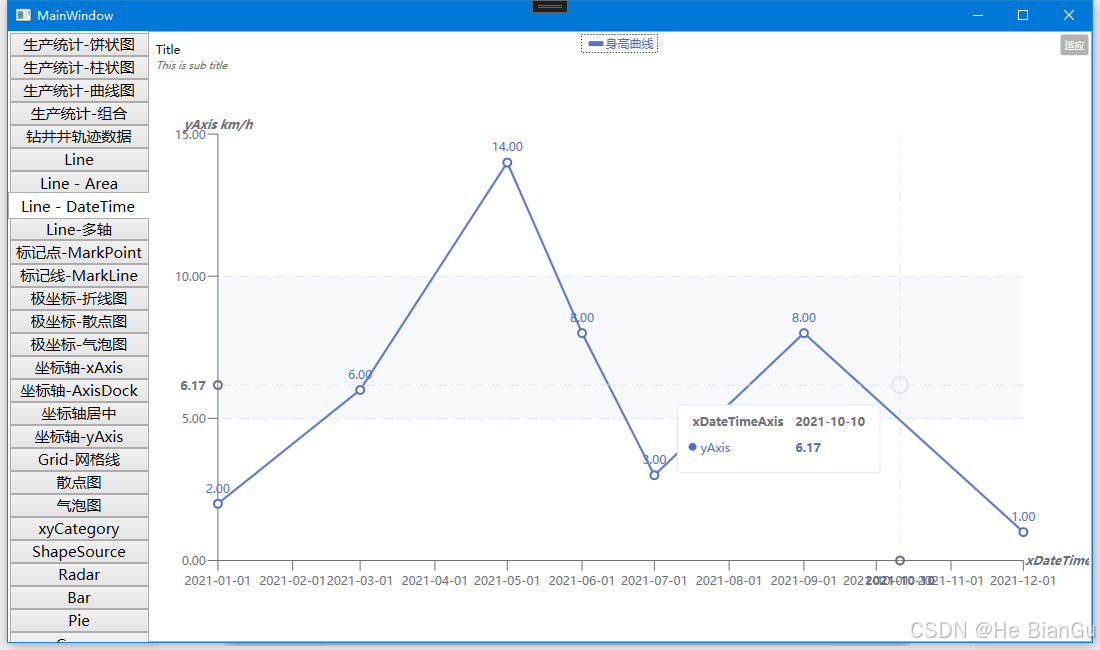
按日期显示(支持横坐标或纵坐标按日期数据显示)
显示面积(支持折线图显示面积)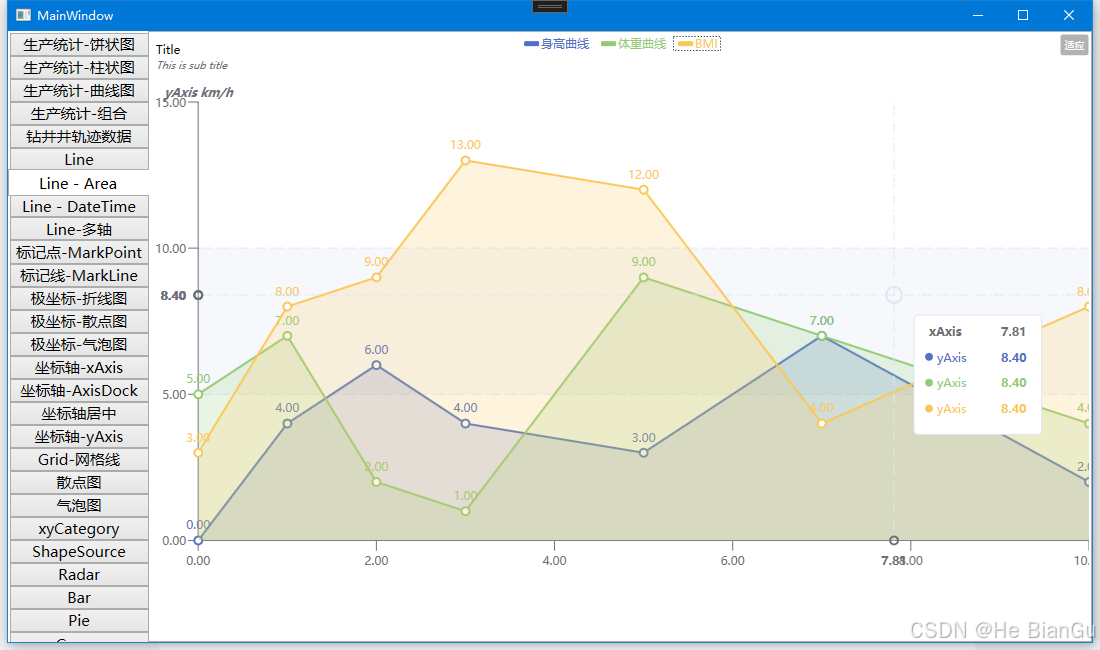
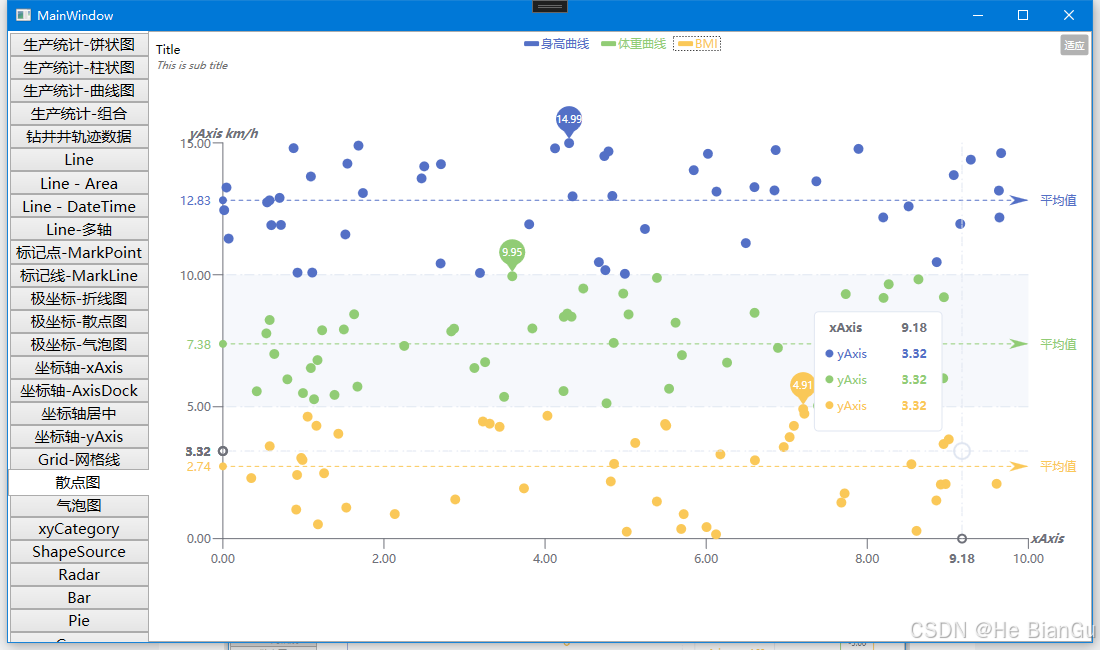
散点图
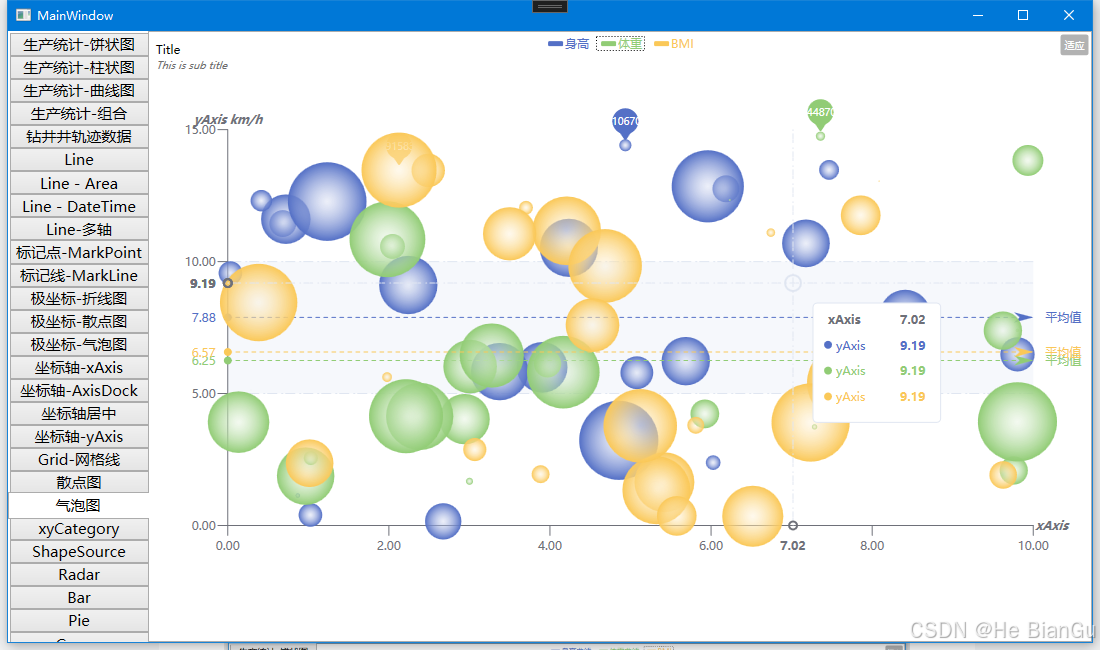
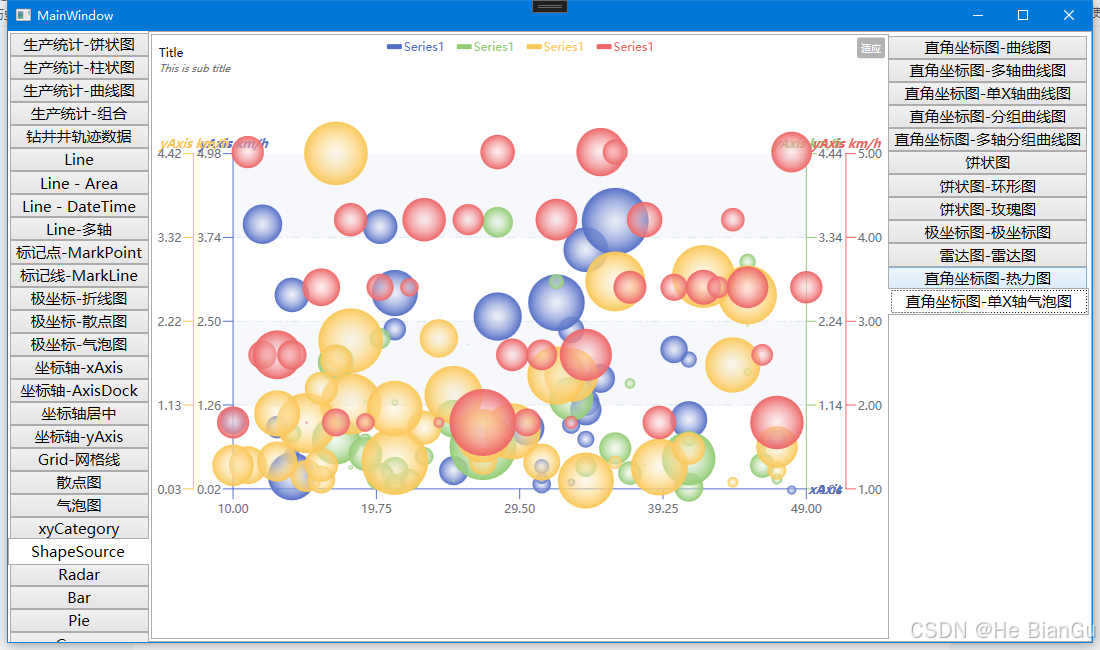
气泡图
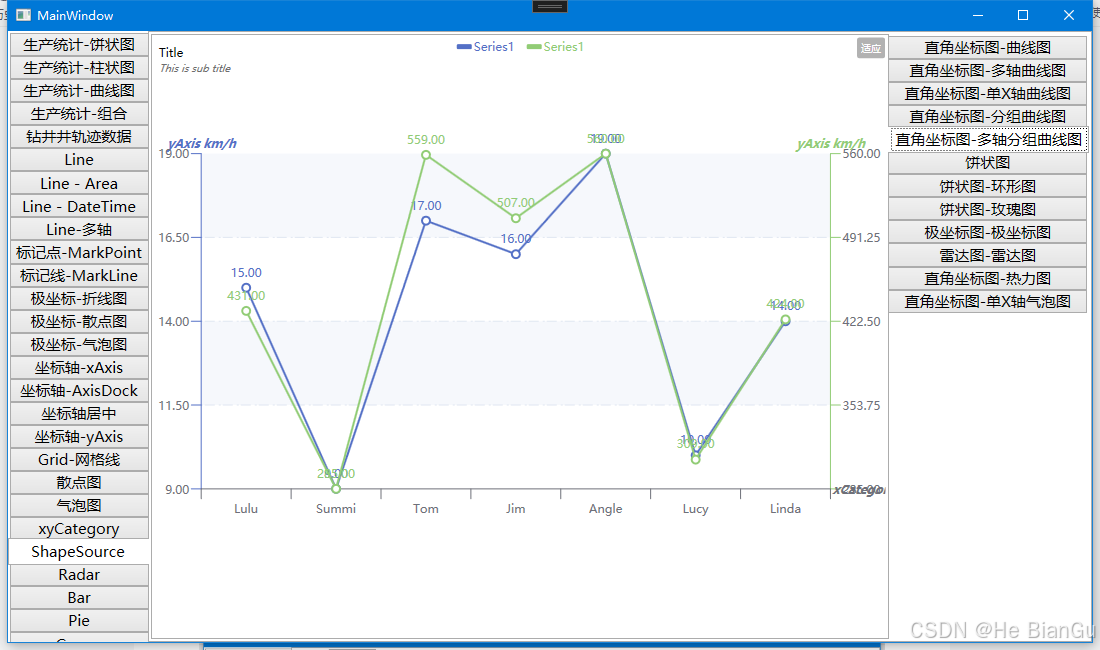
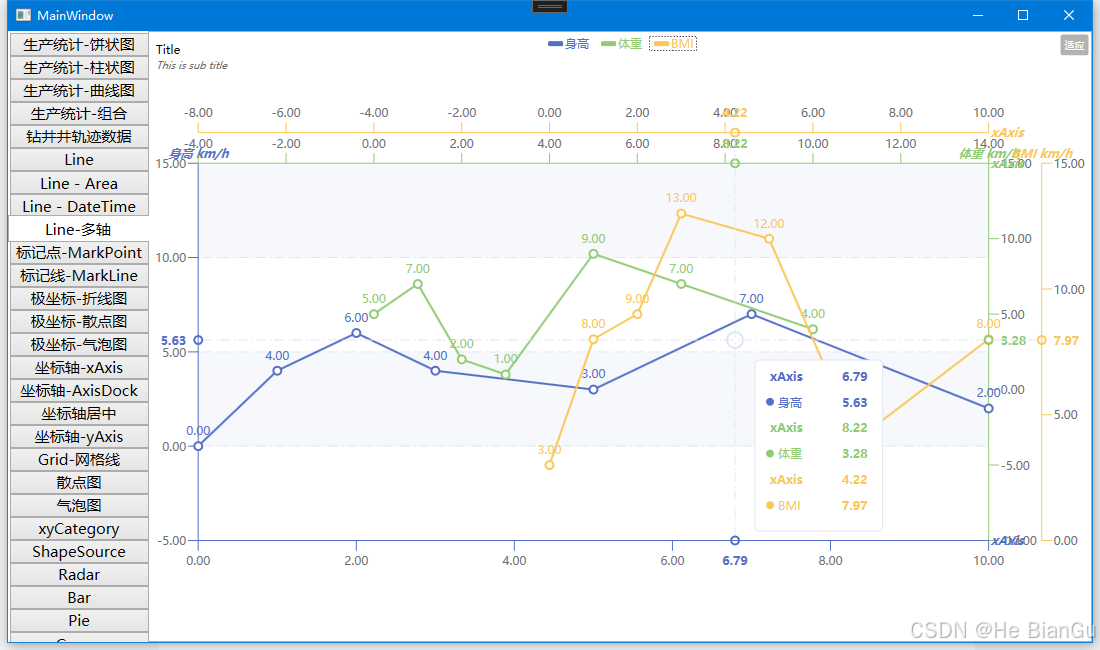
多轴显示效果
柱状图(支持显示文本,显示点,显示折线等设置)
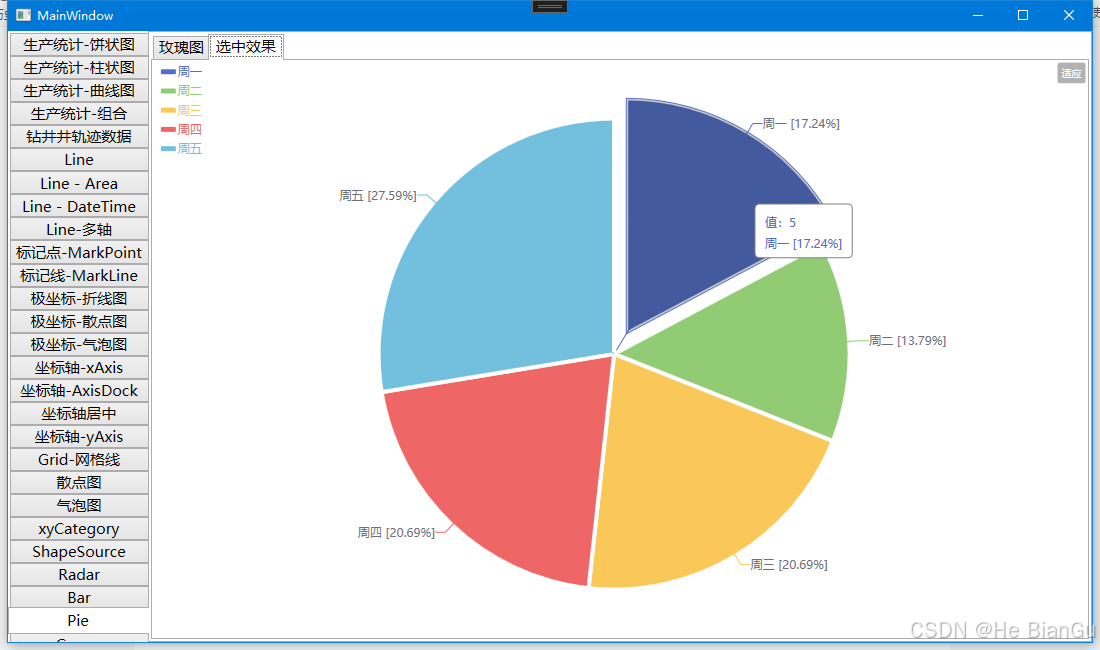
饼状图
环形图样式
 玫瑰图样式
玫瑰图样式
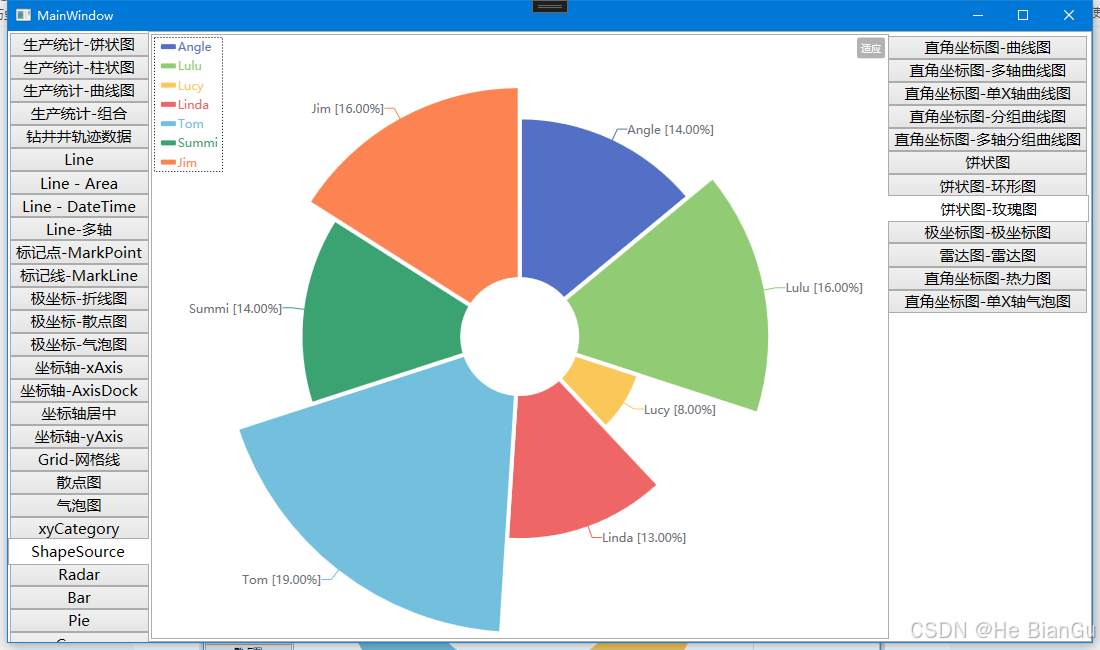
选中位移效果
雷达图

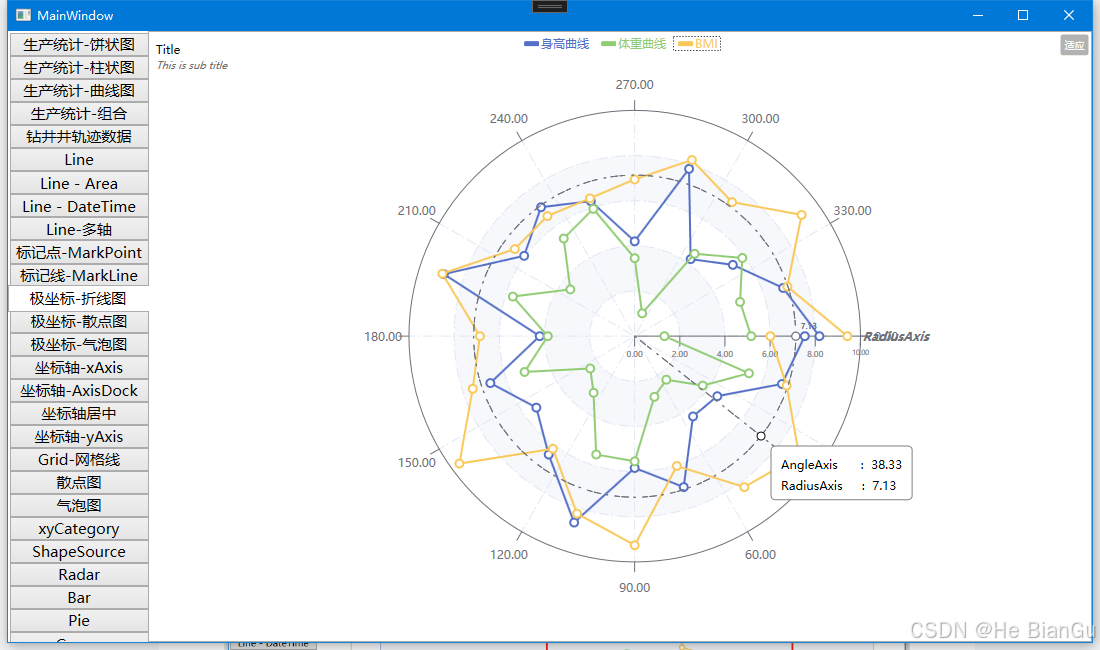
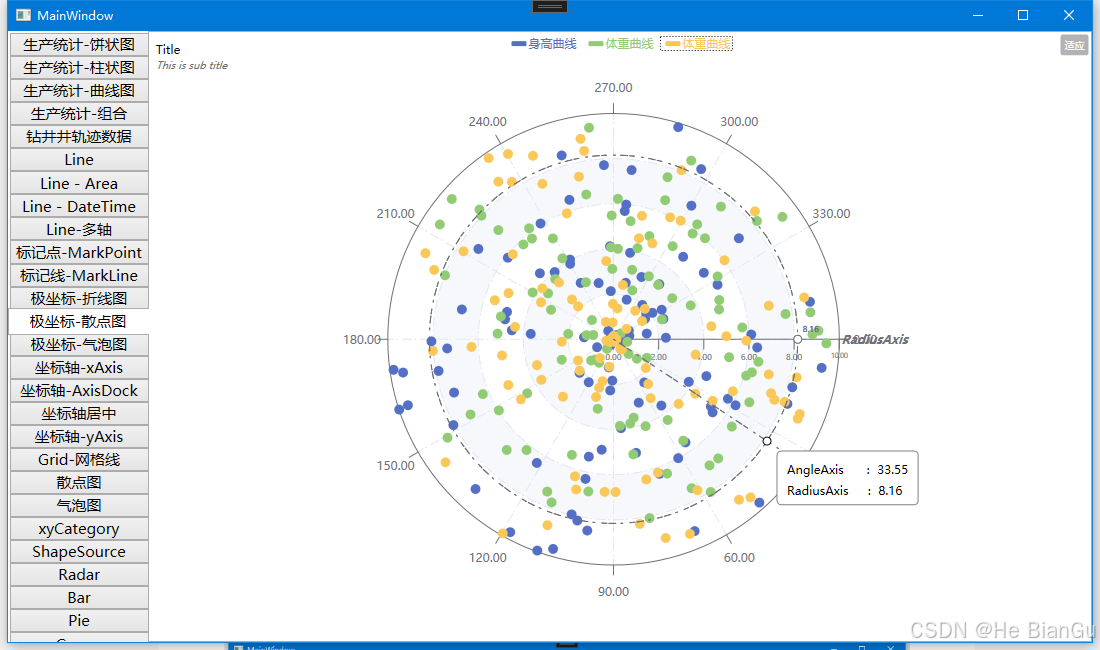
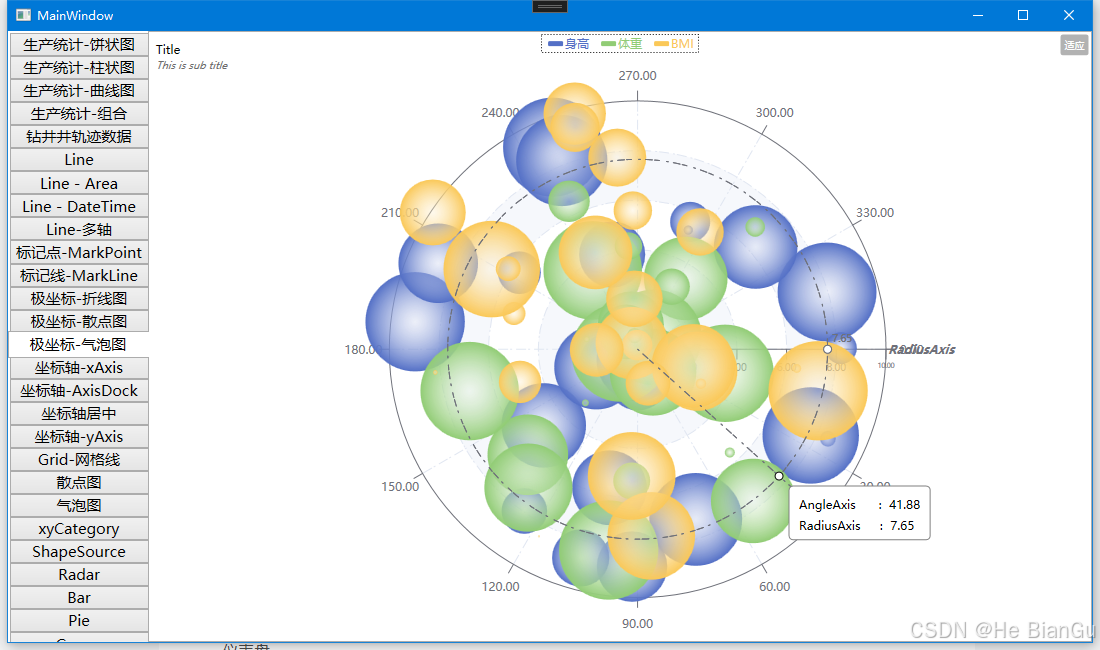
极坐标图
折线数据示例
散点数据示例
气泡数据示例
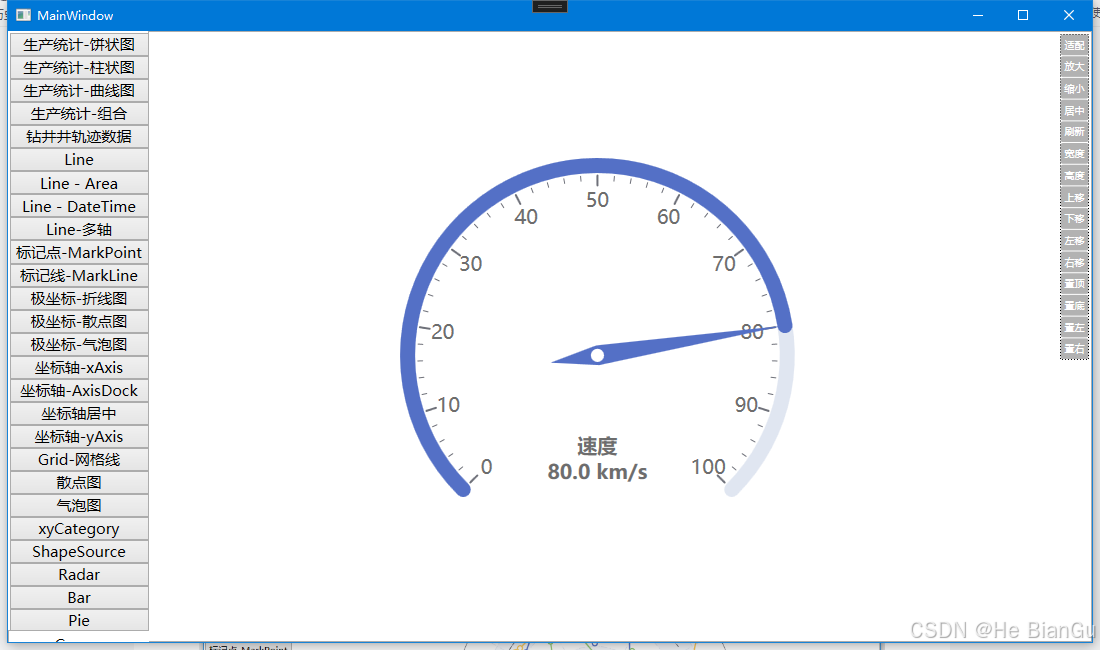
仪表盘
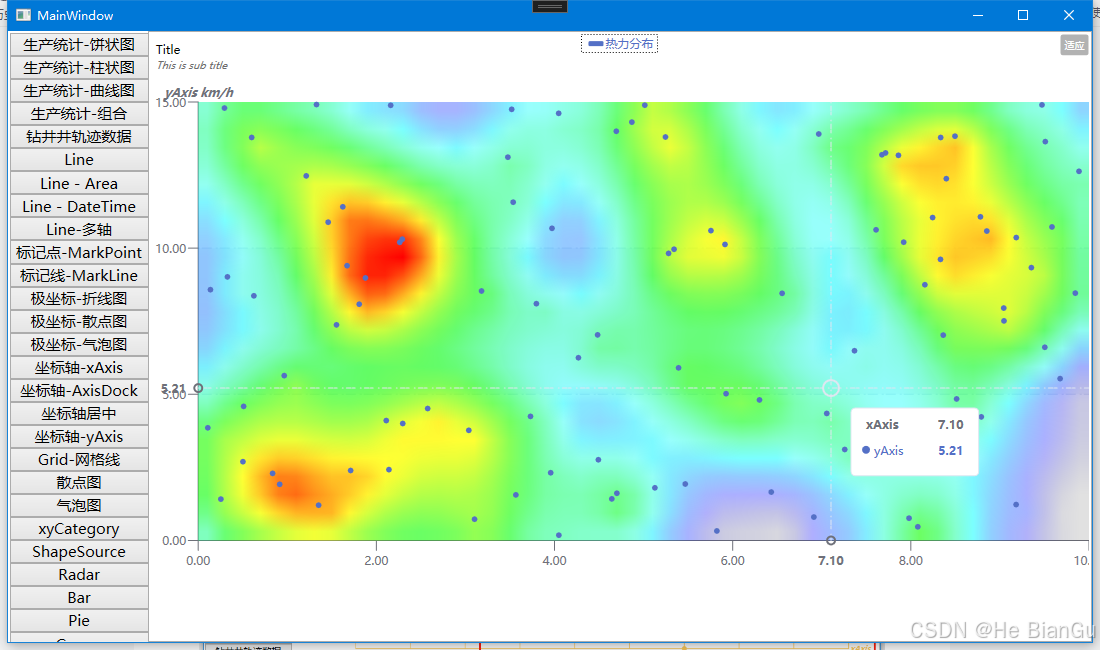
热力图
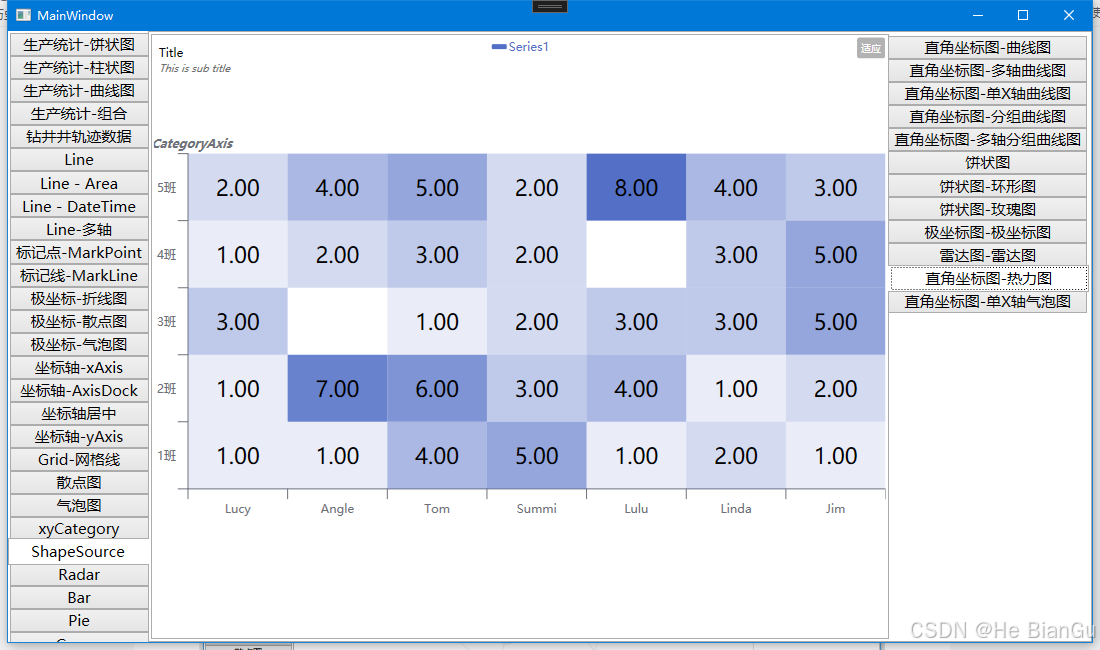
网格热力图
组合饼状图
 组合曲线图
组合曲线图
组合组合图
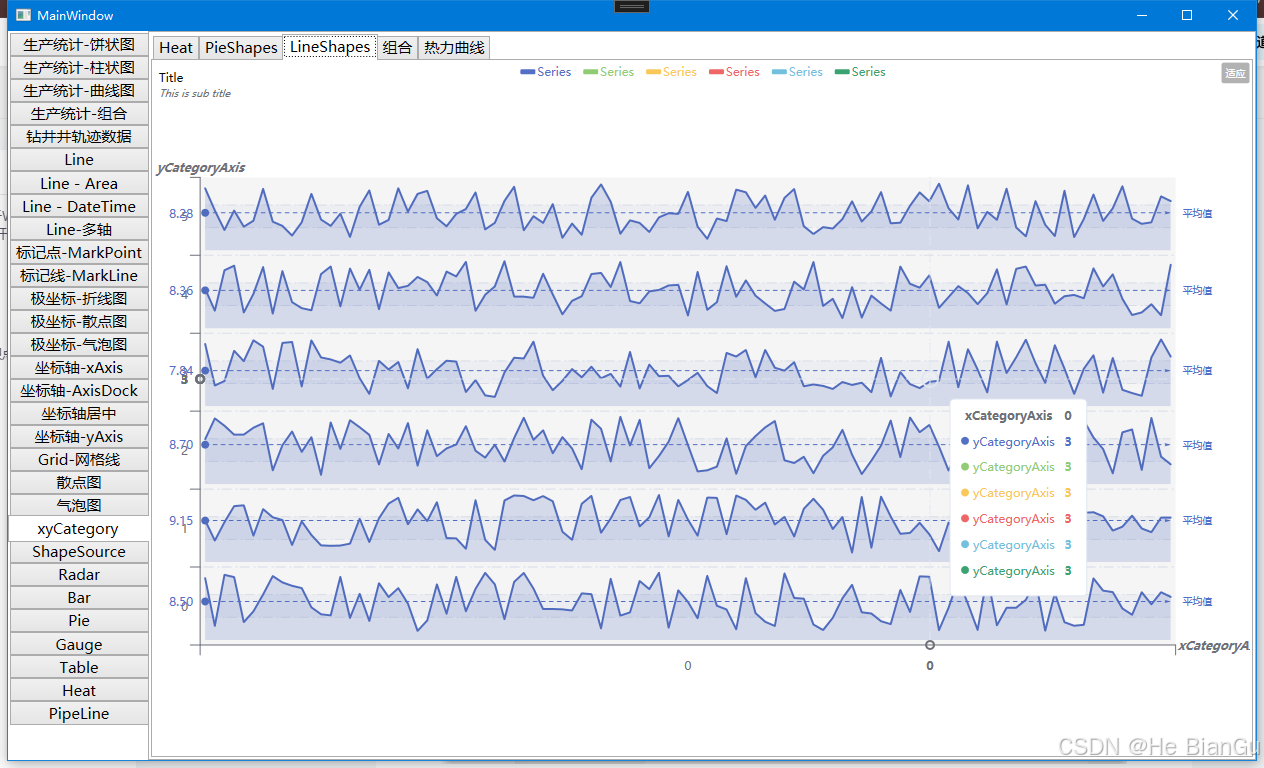
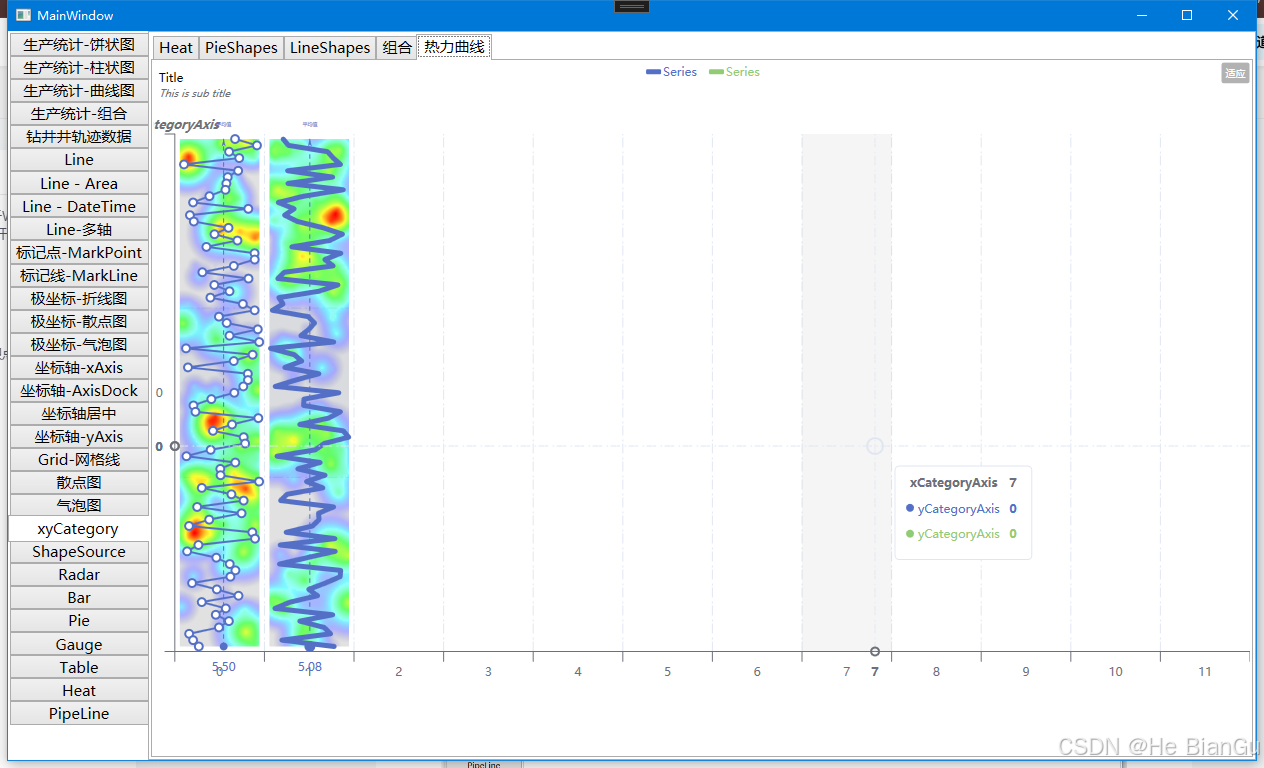
组合热力曲线
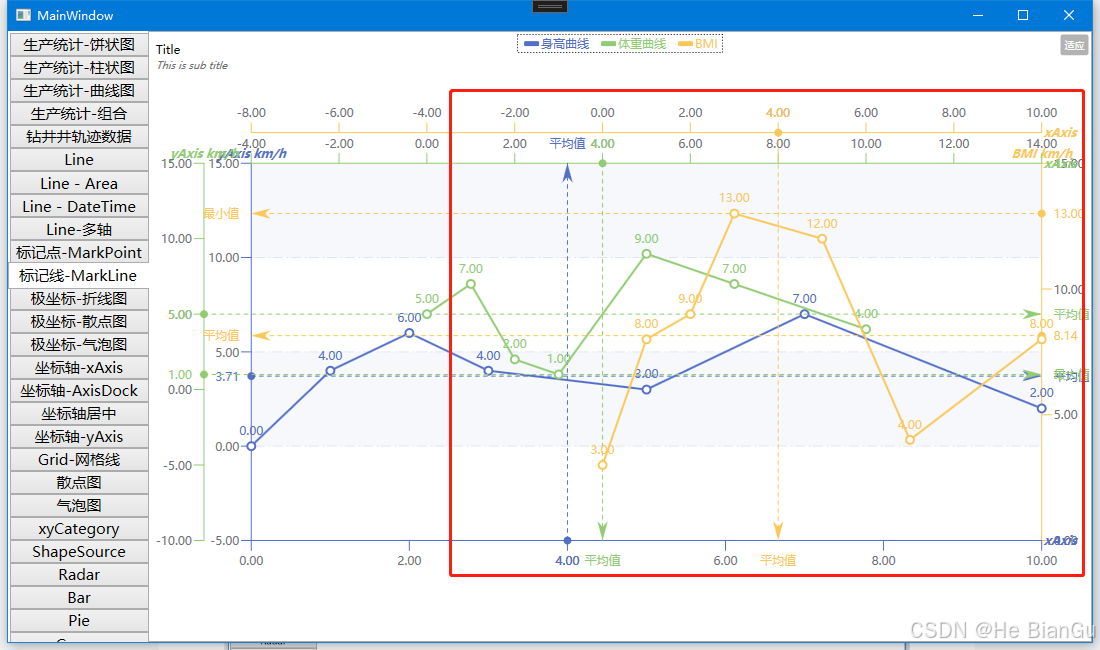
标记线(最大值,最小值,平均值,按X轴显示,按Y轴显示等)
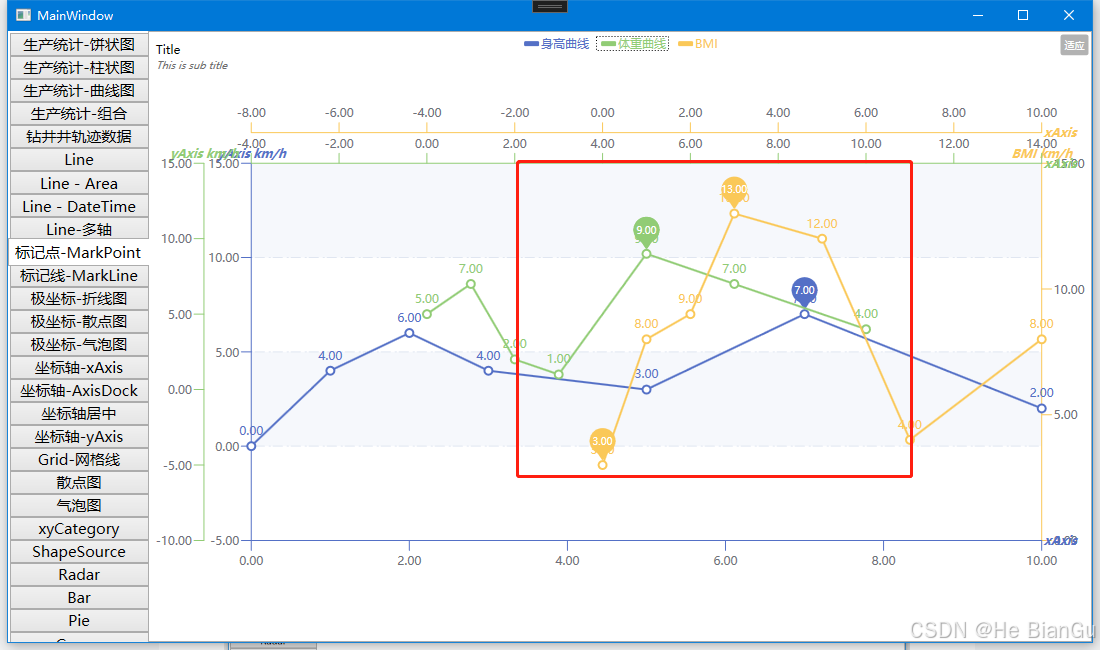
标记点(最大值,最小值等)
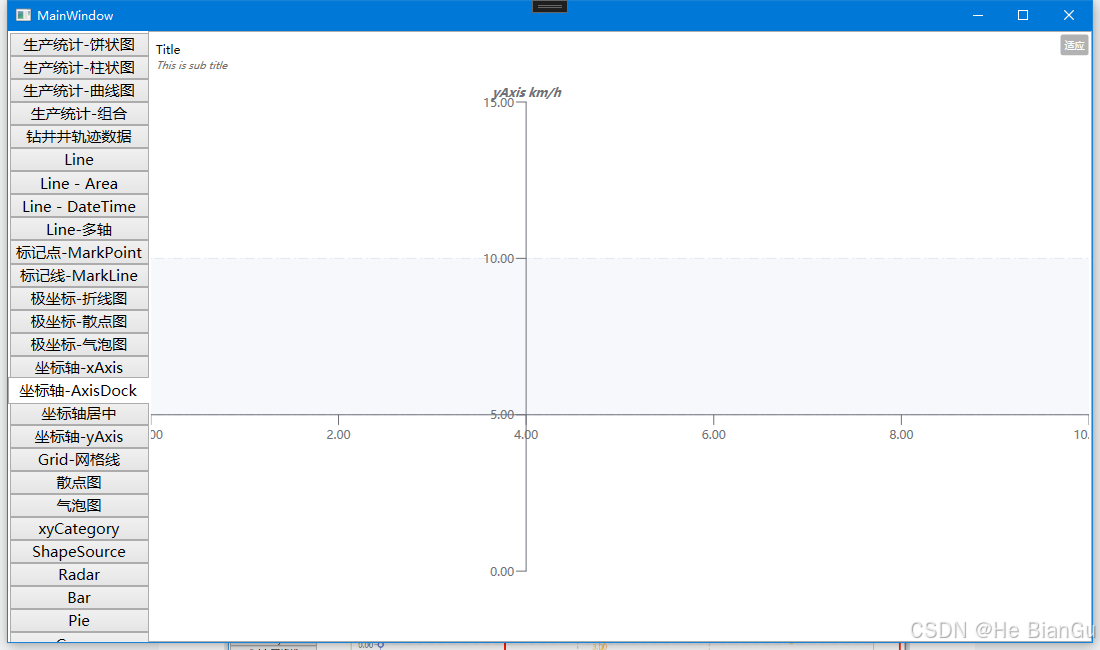
多坐标轴(按坐标轴停靠方向自动布局)
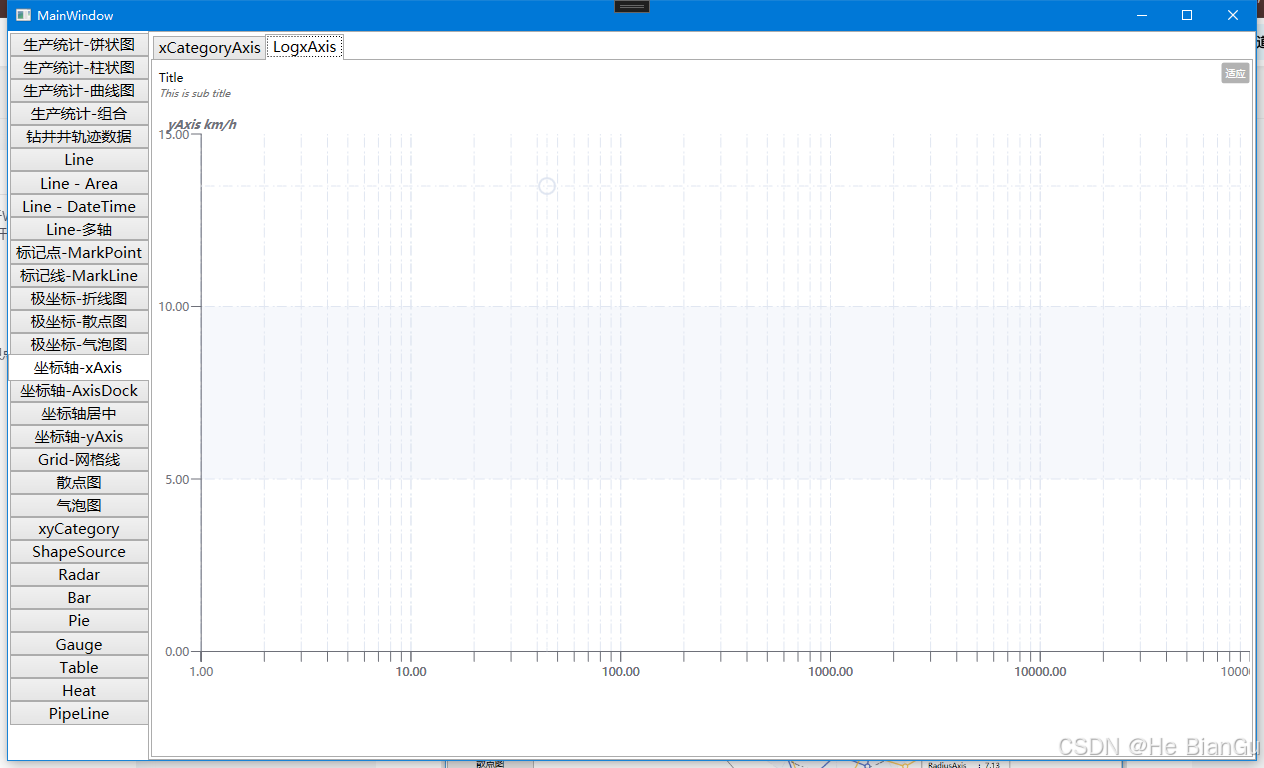
指数坐标轴
自定义坐标轴位置(设置停靠方向或自定义偏移值)
自定义偏移值效果
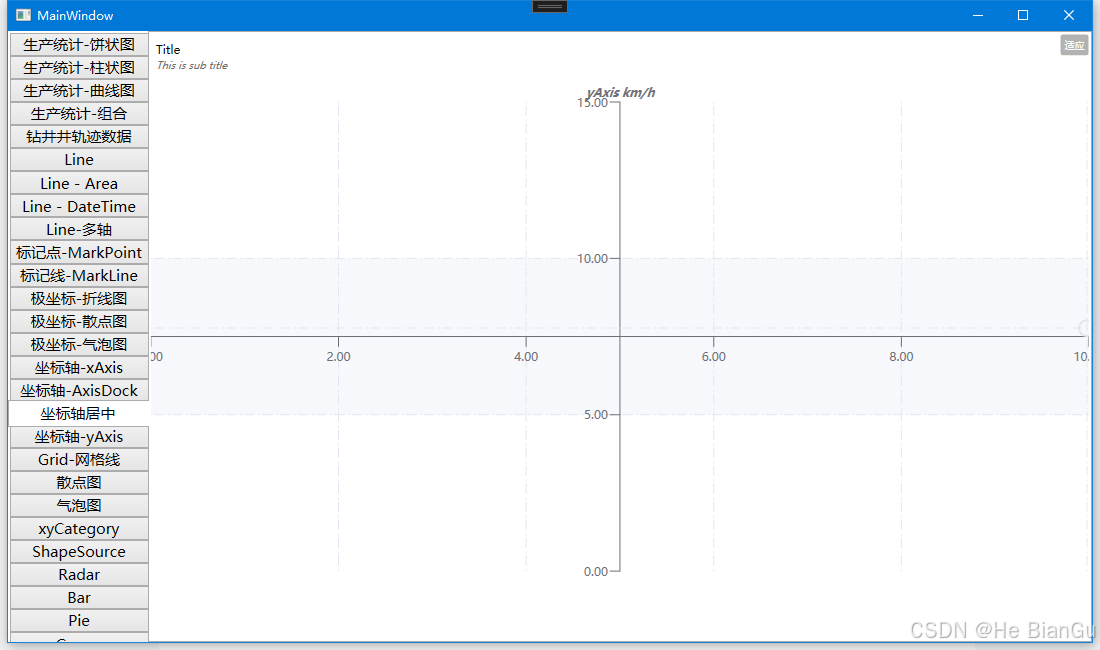
停靠居中效果
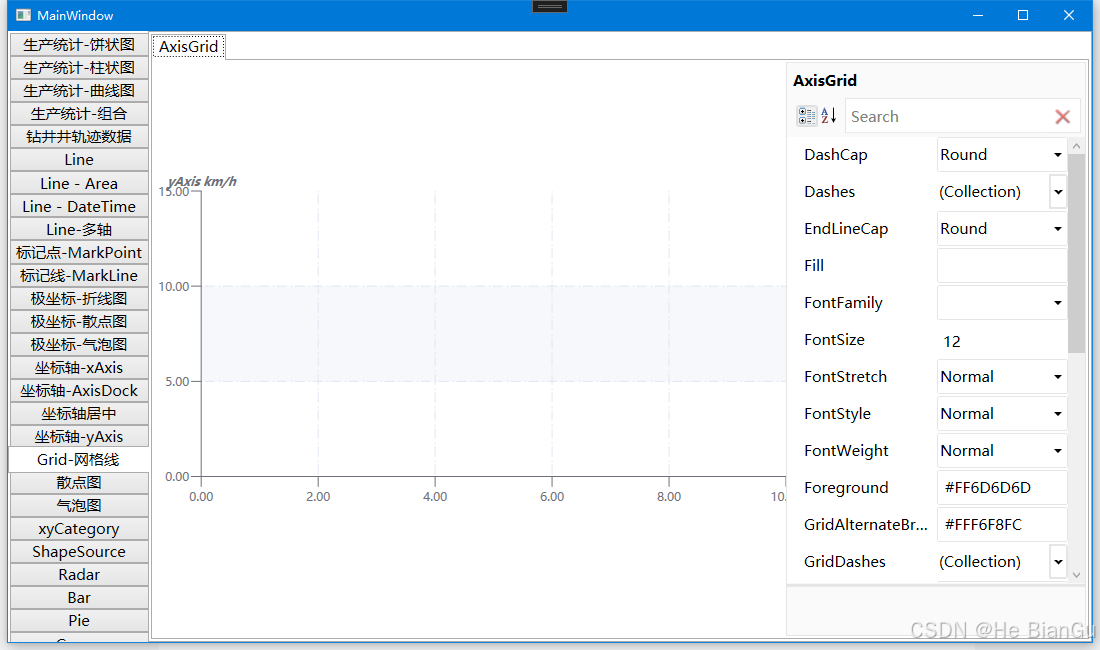
网格线(根据XY坐标轴自动绘制,可以自定义蒙版显示)
悬停提示(支持显示当前鼠标横纵参考线,坐标轴当前值,Tooltip提示显示当前值)
图例控制(勾选显示隐藏绘图元素)
直角坐标系效果
饼状图效果
雷达图效果
极坐标图效果

管道图(显示折线为轨道样式,支持模拟流体滚动效果和流速)
模拟钻井流体和流速
平移缩放等操作
表格组合(可以通过布局Table来放置Chart图表)
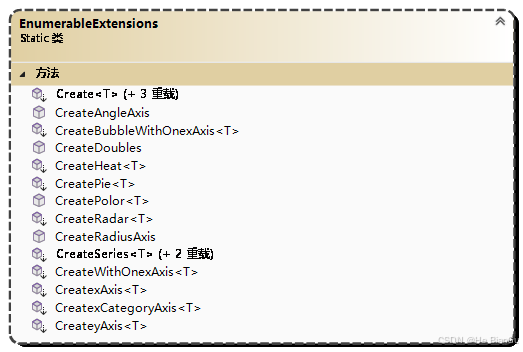
支持Linq To Chart模式(通过表达式树Expression<Func<T, Point>> selector的方式快速生成图表)
cs
           var students = Student.Randoms(100);
           var groupAge = students.GroupBy(x => x.Age).OrderBy(x => x.Key);

           {
               var shape = groupAge.Create(x => new Point(x.Key, x.Sum(l => l.Score)));
               shape.Name = $"{shape.Name}-曲线图";
               this.Shapes.Add(shape);
           }


           {
               var shape = groupAge.Create(x =>
               {
                   x.UseText = false;
               },
                   x => new Point(x.Key, x.Count()),
                   x => new Point(x.Key, x.Sum(l => l.Score)),
                   x => new Point(x.Key, x.Key));
               shape.Name = $"{shape.Name}-多轴曲线图";
               this.Shapes.Add(shape);
           }


           {
               var shape = groupAge.CreateWithOnexAxis(x => x.UseText = false,
                   x => x.Key,
                   x => x.Sum(l => l.Score),
                   x => x.Count());
               shape.Name = $"{shape.Name}-单X轴曲线图";
               this.Shapes.Add(shape);
           }

           var groupName = students.GroupBy(x => x.Name);
           {
               var shape = groupName.Create(x => new ValueCategory(x.Key, x.Sum(l => l.Age)), s =>
               {
                   s.UseLine = false;
                   s.UseText = true;
                   s.UseBar = true;
               });
               shape.Name = $"{shape.Name}-分组曲线图";
               this.Shapes.Add(shape);
           }

           {
               var shape = groupName.Create(s =>
               {
                   s.UseLine = true;
                   s.UseText = true;
                   s.UseBar = false;
               },
               x => new ValueCategory(x.Key, x.Count()),
               x => new ValueCategory(x.Key, x.Sum(l => l.Age)));
               shape.Name = $"{shape.Name}-多轴分组曲线图";
               this.Shapes.Add(shape);
           }

           {
               var shape = groupName.CreatePie(x => new PieCategory()
               {
                   Name = x.Key,
                   Value = x.Max(l => l.Score)
               });
               shape.Name = $"{shape.Name}";
               this.Shapes.Add(shape);
           }

           {
               var shape = groupName.CreatePie(x => new PieCategory()
               {
                   Name = x.Key,
                   Value = x.Sum(l => l.Score)
               }, x =>
               {
                   x.RingRadius = 0.6;
               });
               shape.Name = $"{shape.Name}-环形图";
               this.Shapes.Add(shape);
           }

           {
               var shape = groupName.CreatePie(x => new PieCategory()
               {
                   Name = x.Key,
                   Value = x.Count()
               }, x =>
               {
                   x.RingRadius = 0.2;
                   x.RoseType = RoseType.Radius;
               });
               shape.Name = $"{shape.Name}-玫瑰图";
               this.Shapes.Add(shape);
           }

           {
               var shape = groupAge.CreatePolor(x =>
               {
                   x.UseText = false;
               },
               12.CreateDoubles(0, groupAge.Max(l => l.Key)),
               x => new Point(x.Key, x.Sum(l => l.Score)),
               x => new Point(x.Key, x.Sum(l => l.Age)));
               shape.Name = $"{shape.Name}-极坐标图";
               this.Shapes.Add(shape);
           }

           {
               var shape = groupName.CreateRadar(s =>
               {
                   s.UseLine = true;
                   s.UseText = true;
                   s.UseArea = true;
               },
               x => new ValueCategory(x.Key, x.Count()),
               x => new ValueCategory(x.Key, x.Min(l => l.Age)));
               shape.Name = $"{shape.Name}-雷达图";
               this.Shapes.Add(shape);
           }


           {
               var shape = students.ToList().OrderBy(x => x.Class).CreateHeat(x => new xyCategoryValue()
               {
                   X = new Category(x.Name),
                   Y = new Category(x.Class),
                   Value = 1.0
                   //Value = x.Score
               });
               shape.Name = $"{shape.Name}-热力图";
               this.Shapes.Add(shape);
           }

           {
               var shape = groupAge.CreateBubbleWithOnexAxis(x => x.UseText = false,
                   x => x.Key,

                   x => new ValuePoint2D(Random.Shared.Next(groupAge.Min(l => l.Key), groupAge.Max(l => l.Key)),
                   Random.Shared.NextDouble() * x.Count(),
                   x.Sum(l => l.Score)),

                   x => new ValuePoint2D(Random.Shared.Next(groupAge.Min(l => l.Key), groupAge.Max(l => l.Key)),
                   Random.Shared.NextDouble() * x.Count(),
                   x.Min(l => l.Score)),

                   x => new ValuePoint2D(Random.Shared.Next(groupAge.Min(l => l.Key), groupAge.Max(l => l.Key)),
                   Random.Shared.NextDouble() * x.Count(),
                   x.Max(l => l.Score)),

                   x => new ValuePoint2D(x.Key,
                   x.Count(),
                   x.Average(l => l.Score)));
               shape.Name = $"{shape.Name}-单X轴气泡图";
               this.Shapes.Add(shape);
           }
五、演示视频
【WPF-Chart2D】基于DrawingVisual的图表和表格绘图_哔哩哔哩_bilibili
需要了解的知识点
System.Windows.Controls 命名空间 | Microsoft Learn
控件库 - WPF .NET Framework | Microsoft Learn
XAML概述 - WPF .NET | Microsoft Learn
Windows Presentation Foundation 简介 - WPF .NET | Microsoft Learn
使用 Visual Studio 创建新应用教程 - WPF .NET | Microsoft Learn
了解更多
适用于 .NET 8 的 WPF 的新增功能 - WPF .NET | Microsoft Learn
适用于 .NET 7 的 WPF 的新增功能 - WPF .NET | Microsoft Learn
System.Windows.Controls 命名空间 | Microsoft Learn
Sysinternals - Sysinternals | Microsoft Learn
Windows app development documentation - Windows apps | Microsoft Learn
欢迎使用 Expression Blend | Microsoft Learn
https://learn.microsoft.com/zh-cn/dotnet/desktop/wpf/?view=netdesktop-7.0&WT.mc_id=MVP_380318