导入 keras中的数据集。
properties
datasets是数据集,用来加载tensorflow的一些数据集
layers:kersa中的核心模块,用来构建神经网络模型的各种层
models:用来管理模型的模块。
这边数据集的导出花了好长的时间。中间断了一下,后来无法找到文件,去了数据集下面的文件,将文件给删除了。
数据集的介绍:

将图片像素进行归一化处理。
properties
train_images, test_images = train_images / 255.0, test_images / 255.0

train_images.shape,test_images.shape,train_labels.shape,test_labels.shape
一文读懂图像数据的标准化与归一化_图像归一化处理后有什么区别-CSDN博客
对于后序的神经网络或者卷积神网络处理有很大的好处。

构建CNN神经网络
这是对应的模型结构,中间有卷积层、池化层、Flatten层、全连接层等。
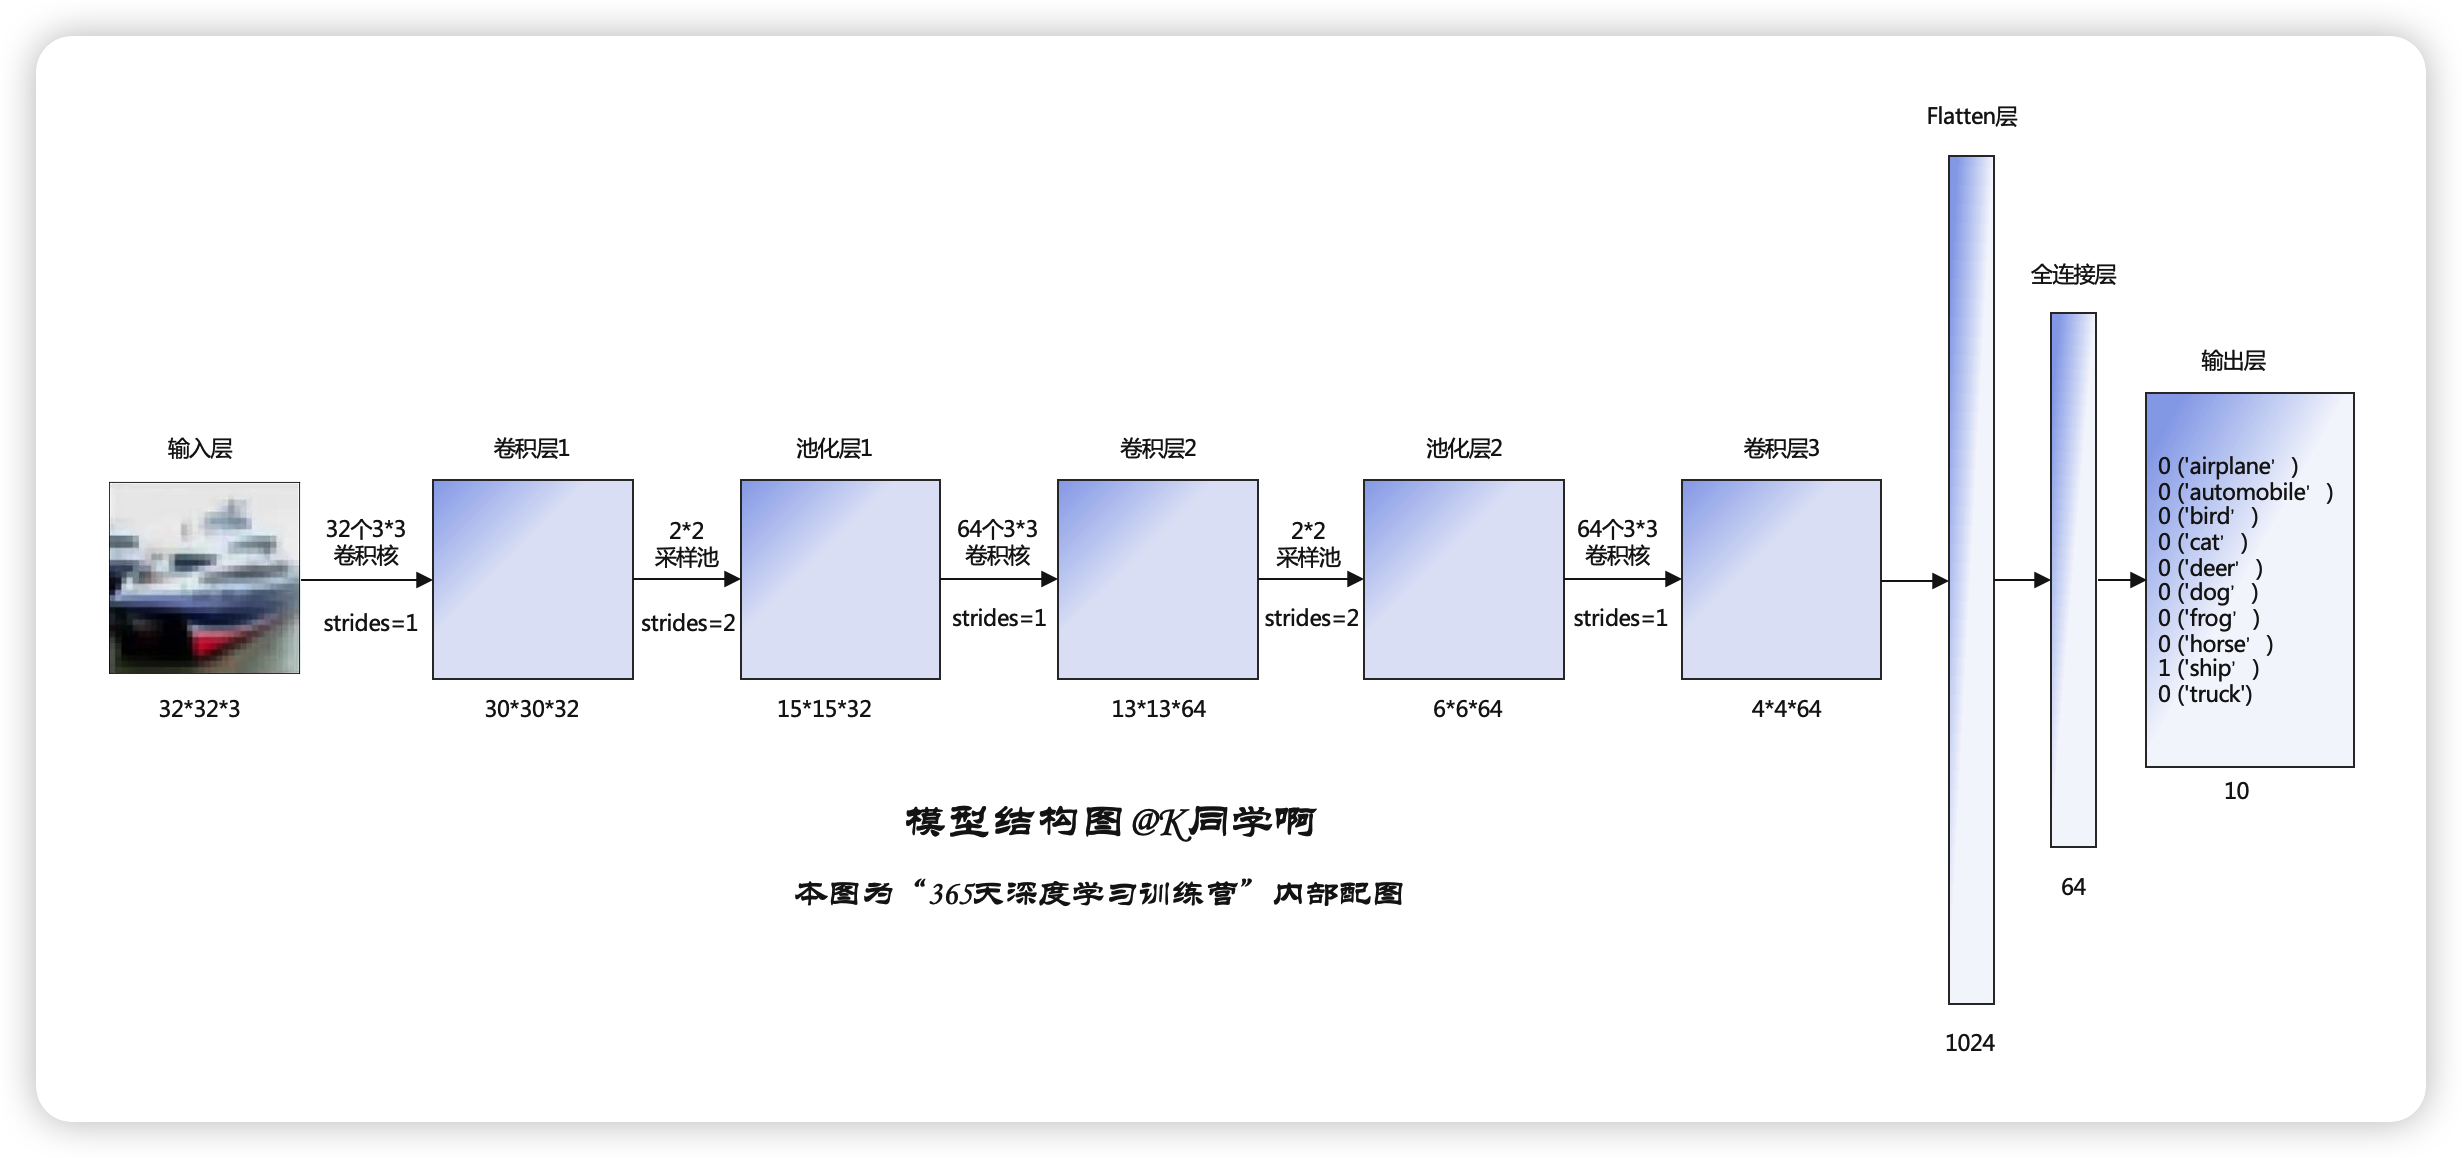
构建网络模型:
properties
model = models.Sequential([
    layers.Conv2D(32, (3, 3), activation='relu', input_shape=(32, 32, 3)), #卷积层1,卷积核3*3
    layers.MaxPooling2D((2, 2)),                   #池化层1,2*2采样
    layers.Conv2D(64, (3, 3), activation='relu'),  #卷积层2,卷积核3*3
    layers.MaxPooling2D((2, 2)),                   #池化层2,2*2采样
    layers.Conv2D(64, (3, 3), activation='relu'),  #卷积层3,卷积核3*3

    layers.Flatten(),                      #Flatten层,连接卷积层与全连接层
    layers.Dense(64, activation='relu'),   #全连接层,特征进一步提取
    layers.Dense(10)                       #输出层,输出预期结果
])

model.summary()  # 打印网络结构
学习CNN的一些概念
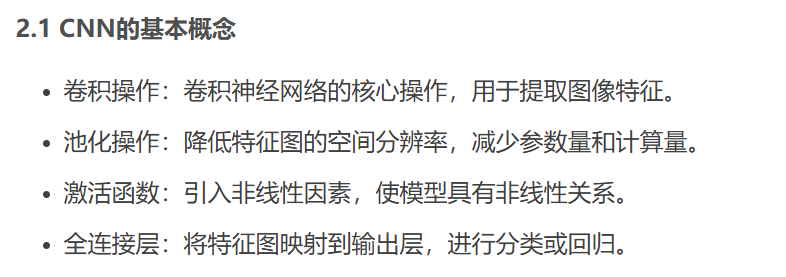
卷积层 用来提取图像的特征
卷积神经网络的实现框架:TensorFlow与PyTorch_卷积神经网络用什么开源深度学习框架-CSDN博客
编译
```properties
model.compile(optimizer='adam',
loss=tf.keras.losses.SparseCategoricalCrossentropy(from_logits=True),
metrics=['accuracy'])
<h2 id="VPBjs">训练</h2>
```properties
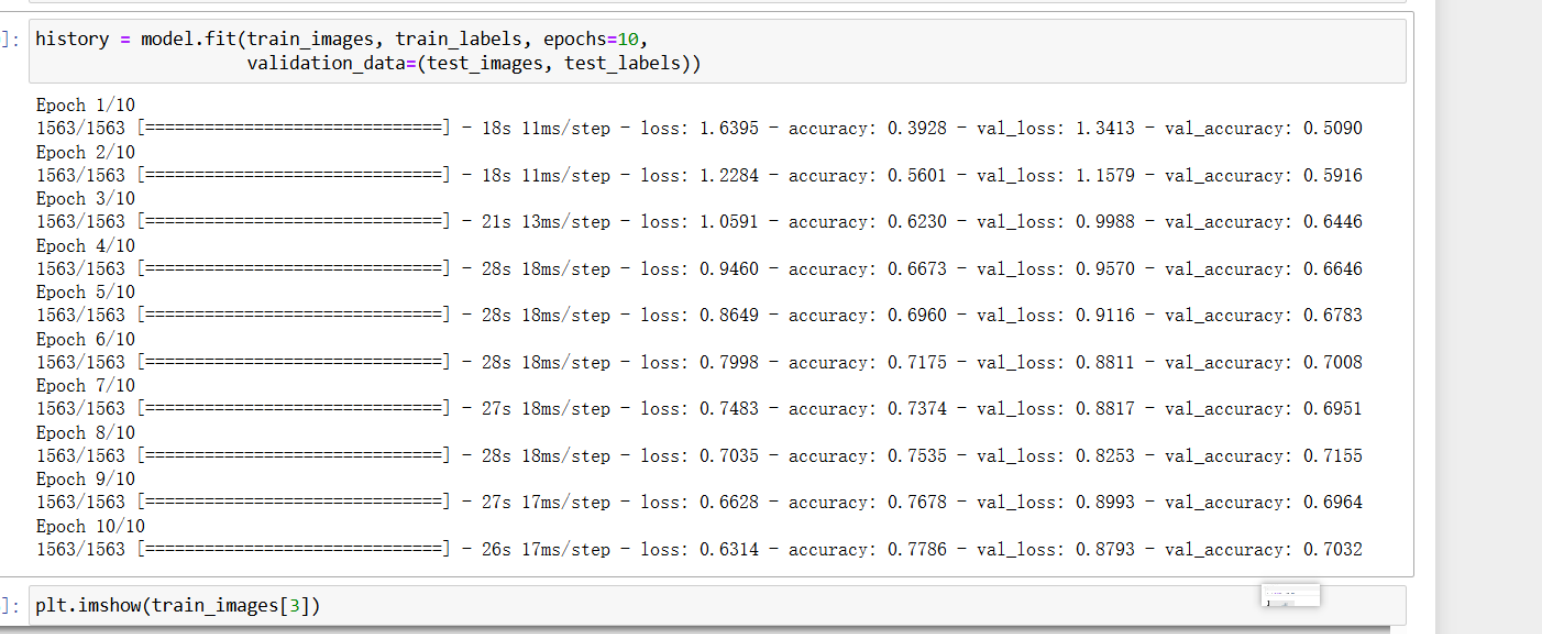
history = model.fit(train_images, train_labels, epochs=10,
                    validation_data=(test_images, test_labels))
properties
//epochs等于10表示需要训练10轮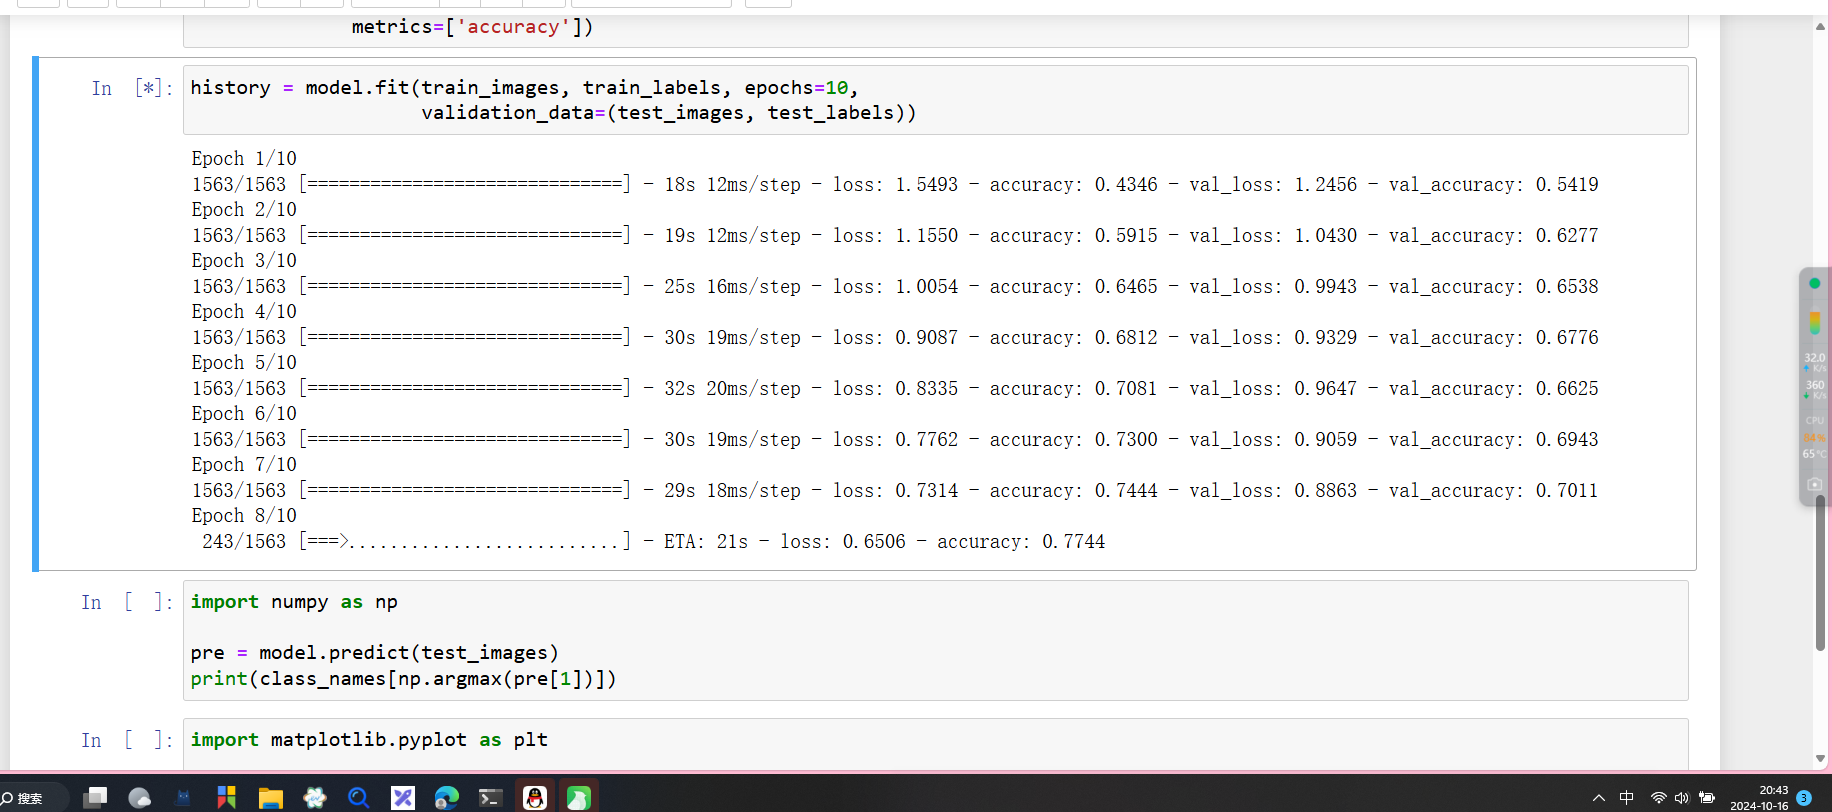
模型的丢失精度越来越低,准确率越来越高。
模型的预测
```properties import numpy as np
pre = model.predict(test_images)
print(class_names[np.argmax(pre[1])])
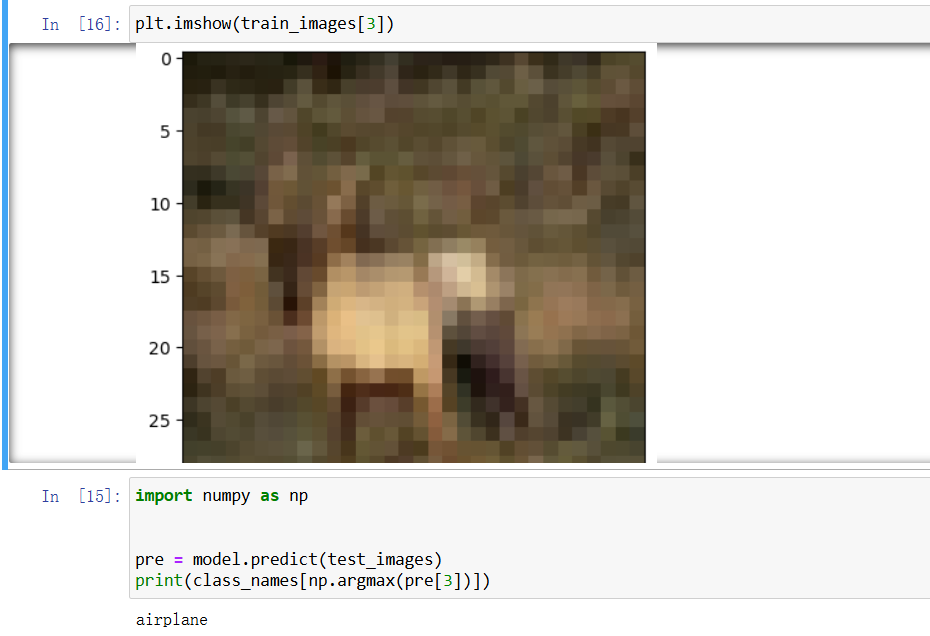
<h2 id="g16I3">模型评估</h2>
```properties
import matplotlib.pyplot as plt
plt.plot(history.history['accuracy'], label='accuracy')
plt.plot(history.history['val_accuracy'], label = 'val_accuracy')
plt.xlabel('Epoch')
plt.ylabel('Accuracy')
plt.ylim([0.5, 1])
plt.legend(loc='lower right')
plt.show()
test_loss, test_acc = model.evaluate(test_images, test_labels, verbose=2)
history.history: history 是模型训练时返回的对象,它记录了每个epoch的训练过程,包括训练准确率和验证准确率等指标。history.history['accuracy'] 包含了每个epoch的训练准确率,而 history.history['val_accuracy'] 包含了每个epoch的验证准确率。
plt.plot(): plt.plot() 用来绘制折线图。在这里,plt.plot(history.history['accuracy'], label='accuracy') 绘制了训练准确率的折线图,而 plt.plot(history.history['val_accuracy'], label = 'val_accuracy') 绘制了验证准确率的折线图。两个曲线反映了模型在训练集和验证集上的表现随训练过程的变化情况。
plt.xlabel('Epoch') 和 plt.ylabel('Accuracy'): 分别为x轴和y轴设置标签。x轴是epoch(训练的轮数),y轴是accuracy(准确率),表示模型在每轮训练中的准确性变化。
plt.ylim([0.5, 1]): 设置y轴的取值范围为0.5到1之间。这样可以避免曲线拉得过高或过低,便于更好地观察模型的准确率变化。如果不设置,默认的y轴范围会根据数据自动调整。
plt.legend(loc='lower right'): 显示图例,并将其放在图表的右下角。图例区分了训练准确率(accuracy)和验证准确率(val_accuracy)两条曲线。
plt.show(): 显示图表。思考的问题1
为什么就能知道这个图片是什么呢?看了几遍知道了,每一个训练集都有一个label标签,这是已经固定的。
加一层卷积层网络 发现效率下降了1%。所有中间有多层网络处理的效果不一定很好。
