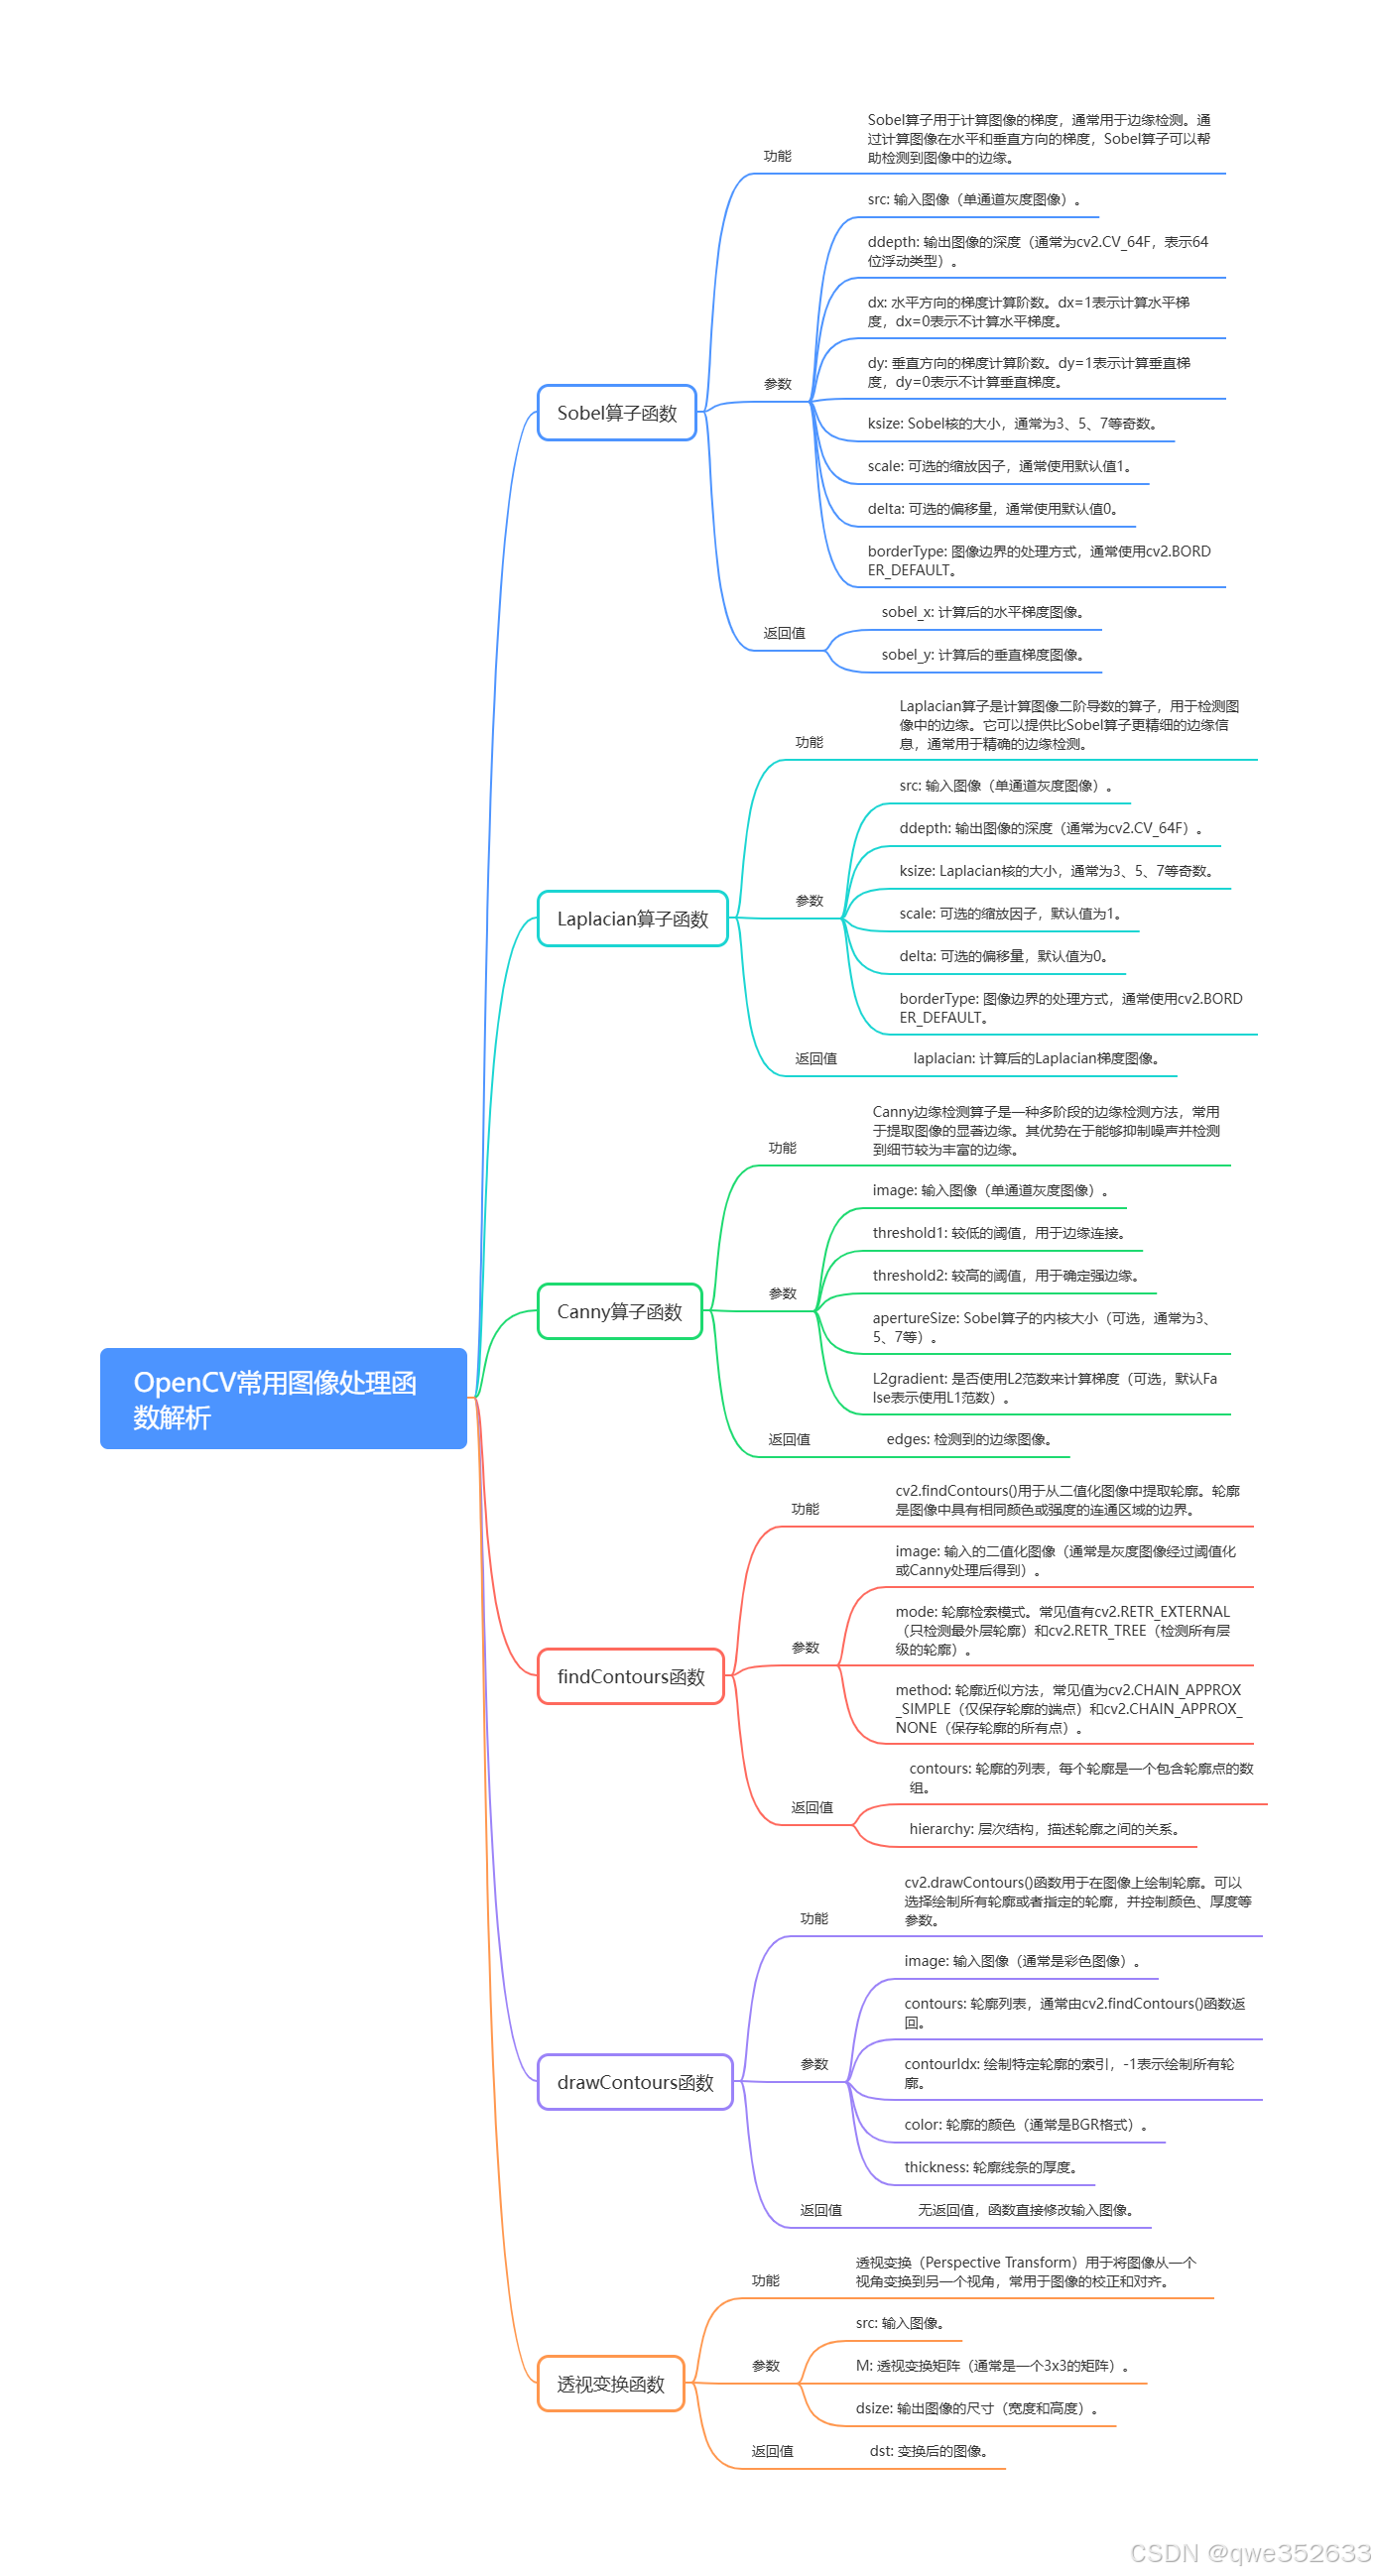
梯度处理的sobel算子函数
python
import cv2
import numpy as np

# 读取名为 '5.png' 的图像文件,返回的 img 是一个numpy数组,存储了图像的像素数据
img = cv2.imread('5.png')

# 使用 Sobel 边缘检测算法对图像进行处理。这里 dx=0, dy=1 说明计算的是 y 方向上的梯度(即竖直边缘),
# ksize=5 说明使用的 Sobel 算子的大小是 5x5,-1 表示输出图像与原图像深度保持一致。
img_sobel = cv2.Sobel(img, -1, dx=0, dy=1, ksize=5)

# 同样是 Sobel 边缘检测,这里 dx=1, dy=0 说明计算的是 x 方向上的梯度(即水平边缘),
# ksize=3 说明使用的 Sobel 算子的大小是 3x3。
img_sobel1 = cv2.Sobel(img, -1, dx=1, dy=0, ksize=3)

# 使用 cv2.imshow 来展示原图像、竖直边缘图像和水平边缘图像。这将会弹出窗口并在窗口中显示图像。
cv2.imshow('img', img)
cv2.imshow('img_sobel', img_sobel)
cv2.imshow('img_sobel1', img_sobel1)

# cv2.waitKey(0) 会等待用户关闭 'img'、'img_sobel' 和 'img_sobel1' 这三个窗口中的任一个。
# 如果参数为 0,则表示无限期等待键入。当用户关闭窗口时,此函数将返回被按下的键的 ASCII 码值。
cv2.waitKey(0)
梯度处理Laplacian算子函数
python
import cv2
import numpy as np

# 读取名为 '5.png' 的图像文件,返回的 img 是一个numpy数组,存储了图像的像素数据
img = cv2.imread('5.png')

# 使用 Laplacian 边缘检测算法对图像进行处理。这种算法基于图像的二阶导数(拉普拉斯算子)进行边缘检测。
# 参数-1表示输出图像与原图像同深度,ksize=5 代表拉普拉斯算子的大小为5x5。
img_lap = cv2.Laplacian(img, -1, ksize=5)

# 使用 cv2.imshow 来展示Laplacian边缘检测后的图像。这将会弹出窗口并在窗口中显示图像。
cv2.imshow('img', img_lap)

# cv2.waitKey(0) 会等待用户关闭 'img'窗口。如果参数为 0,则表示无限期等待键入。当用户关闭窗口时,此函数将返回被按下的键的 ASCII 码值。
cv2.waitKey(0)
Canny算子函数
python
import cv2

# 读取名为 '6.png' 的图像文件,返回的 img 是一个numpy数组,存储了图像的像素数据
img = cv2.imread('6.png')

# 使用 cv2.cvtColor 函数将原始的彩色图像(BGR 格式)转换为灰度图像
img_gray = cv2.cvtColor(img, cv2.COLOR_BGR2GRAY)

# 使用阈值函数 cv2.threshold 对灰度图像进行二值化处理
# 使用大津阈值法 (cv2.THRESH_OTSU) 自动确定最佳阈值,127 是初始阈值,255 是二值化后的最大值
_, img_binary = cv2.threshold(img_gray, 127, 255, cv2.THRESH_BINARY + cv2.THRESH_OTSU)

# 使用 cv2.GaussianBlur 对二值化后的图像进行高斯模糊处理,(3, 3) 是卷积核的大小,3 是标准差
img_blur = cv2.GaussianBlur(img_binary, (3, 3), 3)

# 使用 cv2.Canny 函数对模糊后的图像进行 Canny 边缘检测,30 和 70 是双阈值
img_canny = cv2.Canny(img_blur, 30, 70)

# 使用 cv2.imshow 显示二值化后和 Canny 边缘检测后的图像
cv2.imshow('img_binary', img_binary)
cv2.imshow('img_canny', img_canny)

# cv2.waitKey(0) 会等待用户关闭 'img_binary' 和 'img_canny' 窗口,参数为 0 表示无限期等待
cv2.waitKey(0)
findContours函数,drawContours函数
python
import cv2

# 读取名为 '12.png'的图片文件,这里的路径是相对于当前运行的脚本所在的路径的
img = cv2.imread('../day3/12.png')

# 将原图像从 BGR (Blue Green Red) 颜色空间转换到灰度空间
img_gray = cv2.cvtColor(img, cv2.COLOR_BGR2GRAY)

# 使用高斯滤波器进行模糊处理,以消除噪声。其中,(5, 5) 是高斯核的大小,1 是高斯核的标准差
img_blur = cv2.GaussianBlur(img_gray, (5, 5), 1)

# 对模糊后的图像进行 Canny 边缘检测,这一步是确定图像中边缘的重要步骤
img_canny = cv2.Canny(img_blur, 50, 150)

# 通过传入已经进行了边缘检测的图像 `img_canny` 寻找轮廓,然后在二值化图像中,找到白色部分的轮廓
# `cv2.RETR_EXTERNAL` 是检测方式,只寻找最外围的轮廓
# `cv2.CHAIN_APPROX_SIMPLE` 是轮廓近似方法,这里表示只提取轮廓的端点
img_contours, _ = cv2.findContours(img_canny, cv2.RETR_EXTERNAL, cv2.CHAIN_APPROX_SIMPLE)

# 在原图上绘制找到的轮廓。-1 表示绘制所有轮廓,(0,0,255) 是 BGR 颜色,表示用红色进行绘制, 2 是线条的粗细
img_draw = cv2.drawContours(img, img_contours, -1, (0, 0, 255), 2)

# 显示处理后的图像
cv2.imshow('img', img)

# 暂停程序,等待用户关闭窗口
cv2.waitKey(0)
透视变换函数
python
import cv2
import matplotlib.pyplot as plt
import numpy as np

# 读取图片
img = cv2.imread('../day3/6.png')

# 对图片进行高斯模糊
img_blur = cv2.GaussianBlur(img, (3, 3), 1)

# 将模糊后的彩色图片转为灰度图片
img_gray = cv2.cvtColor(img_blur, cv2.COLOR_BGR2GRAY)

# 对灰度图片通过阈值法进行二值化,但颠倒了黑白(即阈值以下的点为白色,以上的为黑色)
_, img_binary = cv2.threshold(img_gray, 127, 255, cv2.THRESH_BINARY_INV + cv2.THRESH_OTSU)

# 查找二值化图片的外轮廓
contours, _ = cv2.findContours(img_binary, cv2.RETR_EXTERNAL, cv2.CHAIN_APPROX_SIMPLE)

# 复制一份原图片
img_copy = img.copy()

# 对找到的每一个轮廓:
for i in contours:
    # 计算轮廓的矩
    m = cv2.moments(i)

    # 如果矩中的面积为0,跳过此轮廓
    if int(m['m00']) == 0:
        continue

    # 计算轮廓长度
    arc_len = cv2.arcLength(i, True)

    # 使用余弦定理进行点筛选,减少不必要的计算量
    approx = cv2.approxPolyDP(i, float(0.04) * arc_len, True)

# 在复制的图片上绘制黑色轮廓
cv2.drawContours(img_copy, contours, -1, (0, 0, 0), 2)

# 在复制的图片上绘制绿色轮廓
cv2.drawContours(img_copy, contours, -1, (0, 255, 0), 2)

print(approx)

# 构造透视变换所需的点集,这部分可能需要自行调整以达到最好的效果
points1 = np.array([approx[0][0] - (-2, 14), approx[3][0] - (-10, 5), approx[1][0] - (12, -5),
                    approx[2][0] - (-5, -13)], dtype=np.float32)
points2 = np.array([[0, 0], [img.shape[1], 0], [0, img.shape[0]], [img.shape[1], img.shape[0]]], dtype=np.float32)

# 获取透视变换矩阵
M = cv2.getPerspectiveTransform(points1, points2)

# 进行透视变换
img_warp = cv2.warpPerspective(img, M, (img.shape[1], img.shape[0]))

# 展示处理后的图片
cv2.imshow('img',img)
cv2.imshow('img_warp', img_warp)
cv2.waitKey(0)
轮廓的外接边界框
python
# 引入cv2和matplotlib.pyplot模块
import cv2
import matplotlib.pyplot as plt

# 使用cv2读取图像
img = cv2.imread('4.png')

# 对图像进行高斯模糊操作,使用3*3的核,标准差为1
img_blur = cv2.GaussianBlur(img, (3, 3), 1)

# 把模糊后的图像从BGR变为灰度图
img_gray = cv2.cvtColor(img_blur, cv2.COLOR_BGR2GRAY)

# 使用OSTU进行图像二值化,阈值设为127,二值化后小于阈值的部分设为255,大于设为0,反向输出
_, img_binary = cv2.threshold(img_gray, 127, 255, cv2.THRESH_BINARY_INV + cv2.THRESH_OTSU)

# 使用cv2找到二值化图像中的所有轮廓
contours, _ = cv2.findContours(img_binary, cv2.RETR_EXTERNAL, cv2.CHAIN_APPROX_SIMPLE)
# 创建一个原图的副本
img_copy = img.copy()

# 遍历所有找到的轮廓
for i in contours:
    # 计算轮廓的矩
    m = cv2.moments(i)

    # 如果轮廓的面积(零阶矩)等于0,则继续下一轮循环
    if int(m['m00']) == 0:
        continue

    # 计算轮廓的周长
    arc_len = cv2.arcLength(i, True)

    # 使用Ramer-Douglas-Peucker算法找到轮廓的近似多边形
    approx = cv2.approxPolyDP(i, float(0.04) * arc_len, True)

    # 画出轮廓
    cv2.drawContours(img_copy, contours, -1, (0, 0, 0), 2)

    # 计算轮廓的重心
    cx = int(m['m10'] / m['m00'])
    cy = int(m['m01'] / m['m00'])

    # 判断多边形的形状
    if len(approx) == 3:
        square = 'triangle'
    elif len(approx) == 4:
        x, y, w, h = cv2.boundingRect(approx)
        ratio = w / h
        if ratio > 0.95 and ratio < 1.05:
            square = 'square'
        else:
            square = 'rectangle'
    elif len(approx) == 5:
        square = 'pentagon'
    else:
        square = 'circle'

    # 用文本标记出各个形状
    cv2.putText(img_copy, str(square), (cx, cy), cv2.FONT_HERSHEY_SIMPLEX, 0.5, (0, 0, 255), 2)

# 画出所有的轮廓
cv2.drawContours(img_copy, contours, -1, (0, 255, 0), 2)

# 显示处理后的图像
cv2.imshow('img', img_copy)
cv2.waitKey(0)
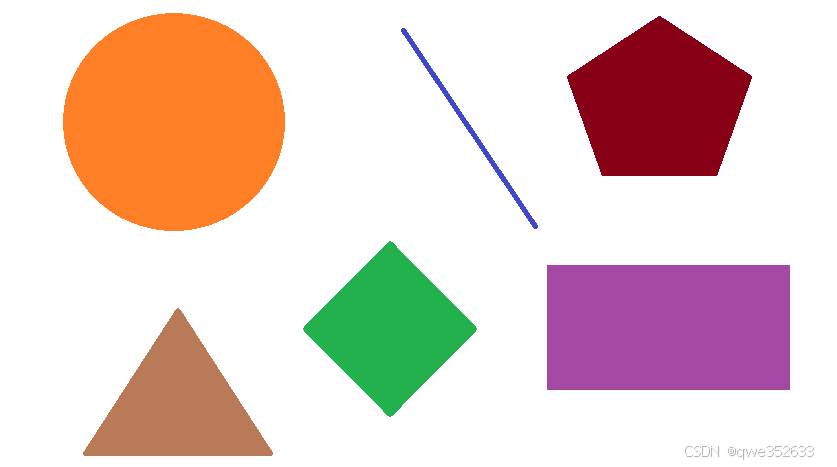
原图 :

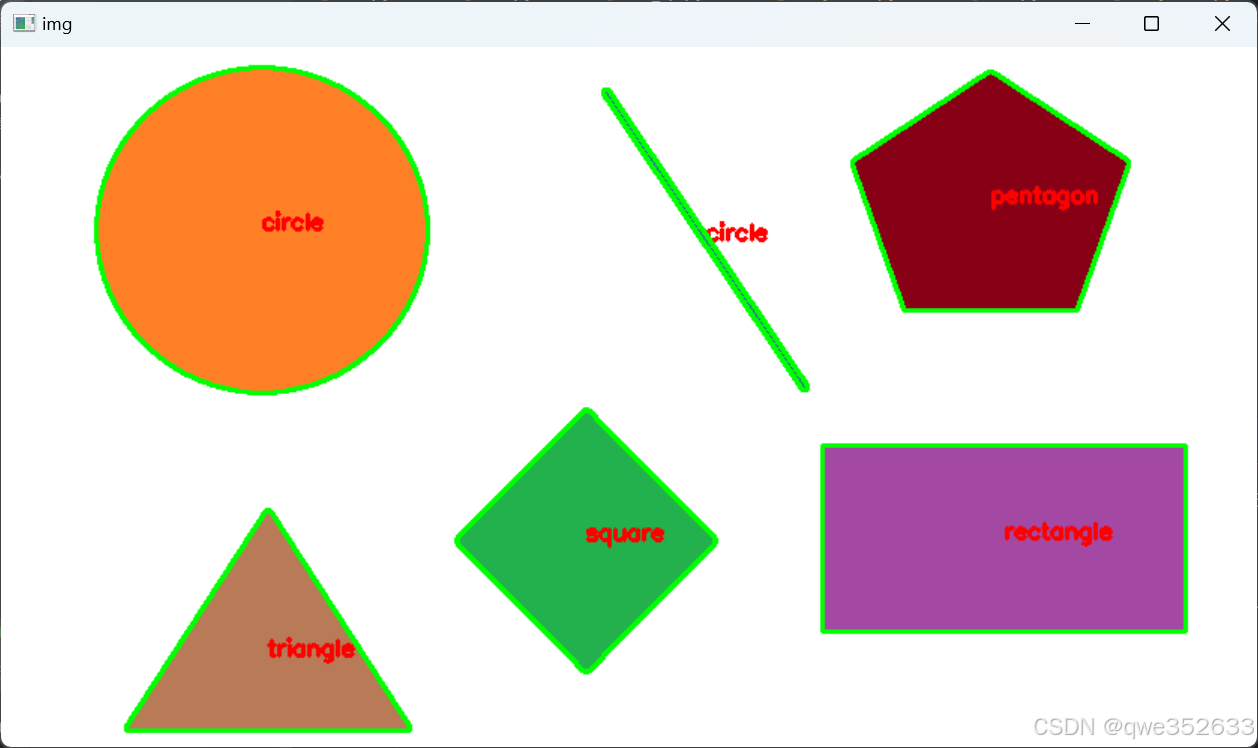
运行结果:


