在现代 web 应用开发中,地图显示和数据可视化已经成为许多应用的核心功能。OpenLayers 是一个强大的开源 JavaScript 库,它为开发者提供了丰富的地图绘制功能。今天,我们将介绍如何在 Vue 3 中使用 OpenLayers,并实现一个非常实用的功能:将地图导出为 PDF 文件。
背景
OpenLayers 允许我们创建互动式地图,并支持多种地图服务,如瓦片地图(TileLayer)、矢量地图(VectorTileLayer)等。Vue 3 引入的 Composition API 提供了更灵活和清晰的方式来管理组件的状态和行为。我们将在 Vue 3 中使用 OpenLayers,并结合 jsPDF 库来实现导出地图为 PDF 的功能。
技术栈
- Vue 3:构建应用的框架,采用 Composition API。
- OpenLayers:用于展示地图和加载不同类型的地图数据。
- jsPDF:用于将地图导出为 PDF 文件。
实现步骤
1. 安装依赖
首先,我们需要安装 openlayers 和 jspdf 两个依赖。可以使用 npm 或 yarn 来安装:
javascript
npm install ol jspdf2. 配置 Vue 组件
在我们的 Vue 组件中,我们将创建一个地图,允许用户点击按钮将当前地图导出为 PDF。
完整代码
javascript
<!--
 * @Author: 彭麒
 * @Date: 2024/12/20
 * @Email: 1062470959@qq.com
 * @Description: 此源码版权归吉檀迦俐所有,可供学习和借鉴或商用。
 -->
<template>
  <button class="back-button" @click="goBack">返回</button>
  <div class="container">
    <h3>vue+openlayers: 导出地图(pdf)</h3>
    <h4>
      <el-button type="primary" @click="exportPDF" size="small">导出 pdf 地图</el-button>
    </h4>
    <div id="vue-openlayers"></div>
  </div>
</template>

<script setup>
import { ref, onMounted } from 'vue'; // 引入 Vue 3 的 ref 和 onMounted 钩子
import 'ol/ol.css'; // 引入 OpenLayers 样式
import Map from 'ol/Map'; // 引入 OpenLayers 的 Map 类
import View from 'ol/View'; // 引入 OpenLayers 的 View 类
import TileLayer from 'ol/layer/Tile'; // 引入 OpenLayers 的 TileLayer 类
import OSM from 'ol/source/OSM'; // 引入 OpenLayers 的 OSM 数据源类
import WMTSTileGrid from 'ol/tilegrid/WMTS'; // 引入 OpenLayers 的 WMTSTileGrid 类
import VectorTileLayer from 'ol/layer/VectorTile'; // 引入 OpenLayers 的 VectorTileLayer 类
import VectorTile from 'ol/source/VectorTile'; // 引入 OpenLayers 的 VectorTile 类
import MVT from 'ol/format/MVT'; // 引入 OpenLayers 的 MVT 格式类
import Fill from 'ol/style/Fill'; // 引入 OpenLayers 的 Fill 样式类
import Style from 'ol/style/Style'; // 引入 OpenLayers 的 Style 类
import Circle from 'ol/style/Circle'; // 引入 OpenLayers 的 Circle 样式类
import { jsPDF } from 'jspdf'; // 引入 jsPDF 库
import router from "@/router"; // 引入 Vue Router

const goBack = () => {
  router.push('/OpenLayers'); // 返回到 OpenLayers 页面
};

const map = ref(null); // 定义地图的响应式引用

// 初始化地图
const initMap = () => {
  map.value = new Map({
    layers: [
      new TileLayer({
        source: new OSM(), // 使用 OSM 数据源
      }),
    ],
    target: 'vue-openlayers', // 目标容器 ID
    view: new View({
      center: [0, 0], // 地图中心点
      projection: 'EPSG:4326', // 投影为 EPSG:4326
      zoom: 4, // 初始缩放级别
    }),
  });
};

// 设置样式
const style = () => {
  return new Style({
    image: new Circle({
      radius: 5, // 圆形半径为 5
      fill: new Fill({
        color: 'LawnGreen', // 填充颜色为草绿色
      }),
    }),
  });
};

// 加载 MVT 数据
const readMVT = () => {
  const myLayer = new VectorTileLayer({
    style: style(), // 设置图层样式
    source: new VectorTile({
      visible: true, // 图层可见
      url: 'https://gibs-{a-c}.earthdata.nasa.gov/wmts/epsg4326/best/wmts.cgi?TIME=2020-03-18T00:00:00Z&layer=GRanD_Dams&tilematrixset=2km&Service=WMTS&Request=GetTile&Version=1.0.0&FORMAT=application%2Fvnd.mapbox-vector-tile&TileMatrix={z}&TileCol={x}&TileRow={y}', // 数据源 URL
      format: new MVT(), // 数据格式为 MVT
      projection: 'EPSG:4326', // 投影为 EPSG:4326
      tileGrid: new WMTSTileGrid({
        extent: [-180, -90, 180, 90], // 瓦片网格范围
        resolutions: [0.5625, 0.28125, 0.140625, 0.0703125, 0.03515625, 0.017578125], // 分辨率数组
        tileSize: [512, 512], // 瓦片大小
      }),
    }),
  });
  map.value.addLayer(myLayer); // 将图层添加到地图
};

// 导出地图为 PDF
const exportPDF = () => {
  map.value.once('rendercomplete', () => {
    const mapCanvas = document.createElement('canvas'); // 创建 canvas 元素
    const size = map.value.getSize(); // 获取地图大小

    // 设置尺寸为 A4(297*210),分辨率为 150dpi
    const width = Math.round((297 * 150) / 25.4);
    const height = Math.round((210 * 150) / 25.4);

    mapCanvas.width = width; // 设置 canvas 宽度
    mapCanvas.height = height; // 设置 canvas 高度

    const mapContext = mapCanvas.getContext('2d'); // 获取 canvas 上下文
    Array.prototype.forEach.call(
      map.value.getViewport().querySelectorAll('.ol-layer canvas, canvas.ol-layer'),
      (canvas) => {
        if (canvas.width > 0) {
          const opacity = canvas.parentNode.style.opacity || canvas.style.opacity; // 获取透明度
          mapContext.globalAlpha = opacity === '' ? 1 : Number(opacity); // 设置全局透明度

          const backgroundColor = canvas.parentNode.style.backgroundColor; // 获取背景颜色
          if (backgroundColor) {
            mapContext.fillStyle = backgroundColor; // 设置填充样式
            mapContext.fillRect(0, 0, canvas.width, canvas.height); // 填充背景颜色
          }

          let matrix;
          const transform = canvas.style.transform; // 获取变换样式
          if (transform) {
            matrix = transform
              .match(/^matrix\(([^\(]*)\)$/)[1]
              .split(',')
              .map(Number); // 解析变换矩阵
          } else {
            matrix = [
              parseFloat(canvas.style.width) / canvas.width,
              0,
              0,
              parseFloat(canvas.style.height) / canvas.height,
              0,
              0,
            ]; // 默认变换矩阵
          }

          CanvasRenderingContext2D.prototype.setTransform.apply(mapContext, matrix); // 应用变换矩阵
          mapContext.drawImage(canvas, 0, 0); // 绘制图像
        }
      }
    );
    mapContext.globalAlpha = 1; // 重置全局透明度

    // 导出地图为 PDF
    const pdf = new jsPDF('landscape', undefined, [width, height]);
    pdf.addImage(mapCanvas.toDataURL('image/jpeg'), 'JPEG', 0, 0, width, height);
    pdf.save('map.pdf'); // 保存 PDF 文件
  });
  map.value.renderSync(); // 同步渲染地图
};

// 挂载地图
onMounted(() => {
  initMap(); // 初始化地图
  readMVT(); // 加载 MVT 数据
});
</script>

<style scoped>
.container {
  width: 840px;
  height: 590px;
  margin: 50px auto;
  border: 1px solid #42B983;
}

#vue-openlayers {
  width: 800px;
  height: 400px;
  margin: 0 auto;
  border: 1px solid #42B983;
  position: relative;
}
</style>
3. 代码解析
3.1 初始化地图
在 setup 函数中,我们使用 ref 声明了 map 变量,后续会用它来保存 OpenLayers 的地图实例。然后,initMap 函数负责初始化地图,并将其显示在页面上的 #vue-openlayers 容器中。
3.2 加载地图图层
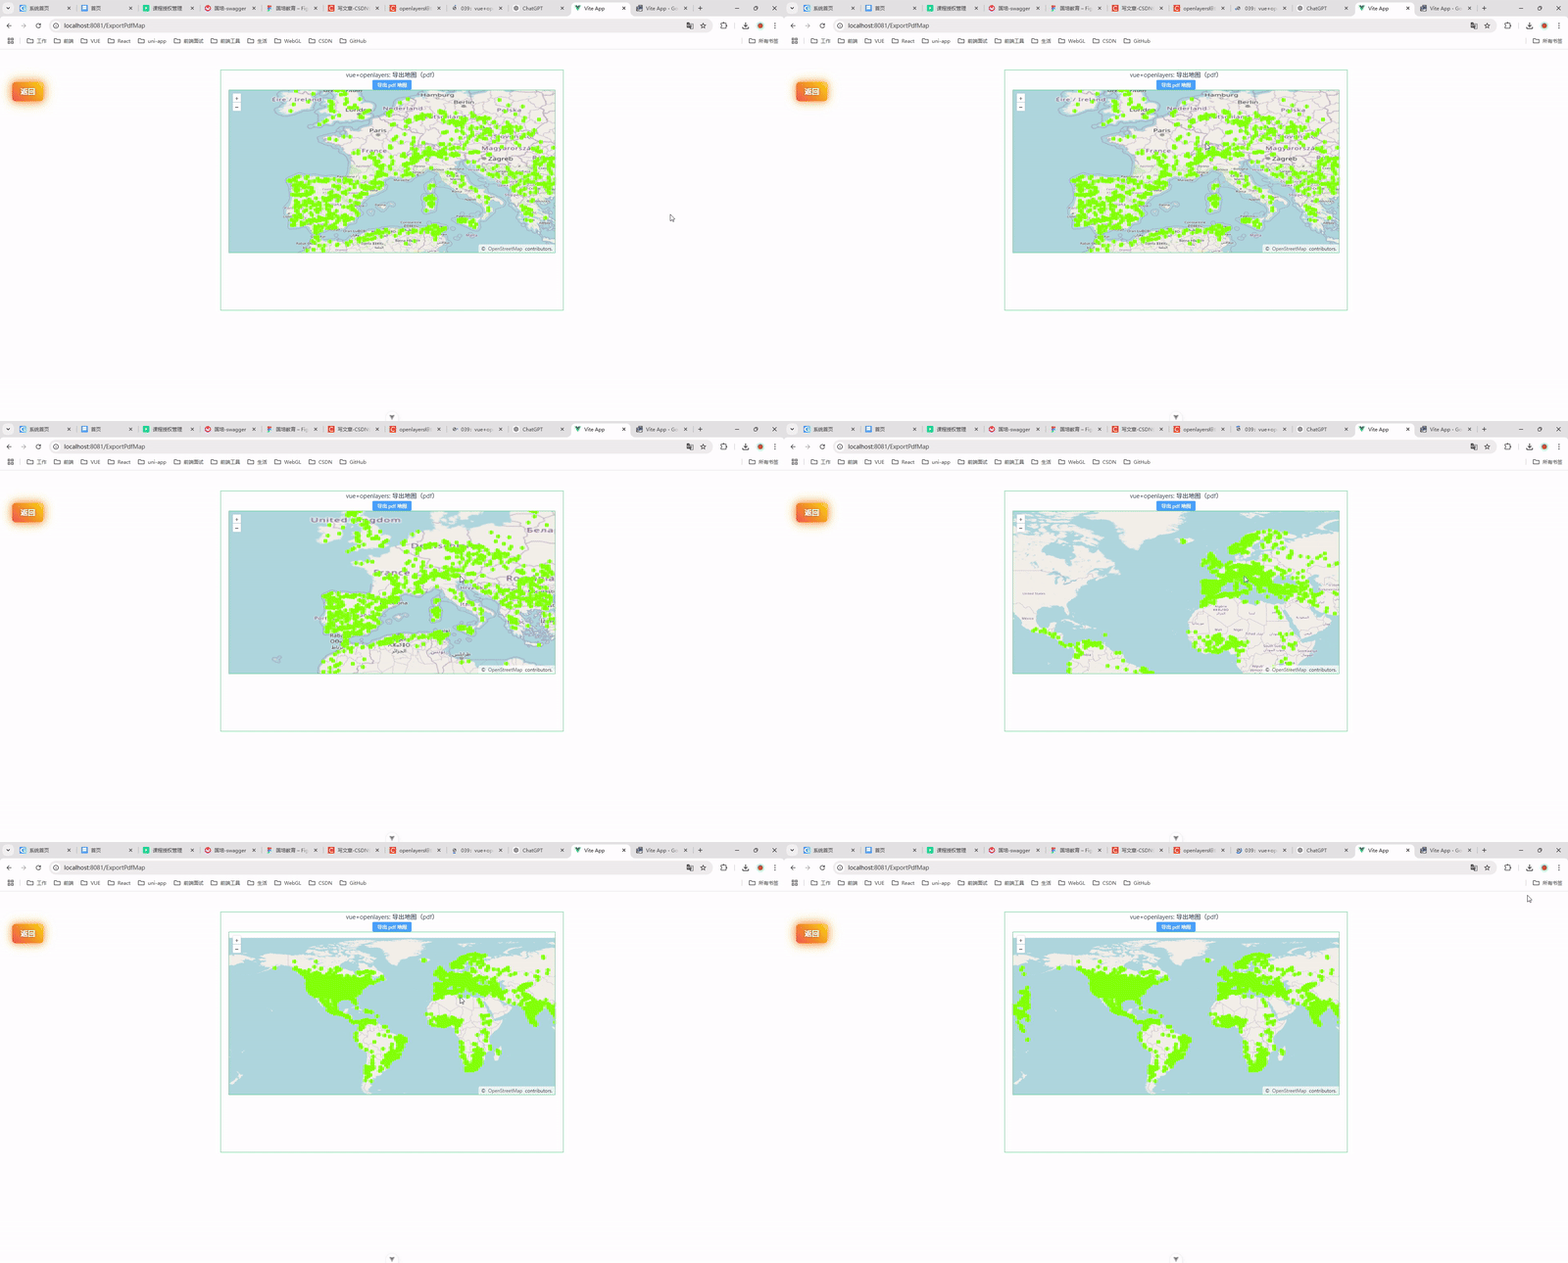
我们使用 VectorTileLayer 来加载一个 WMTS 图层(世界大坝数据)。通过配置 OpenLayers 的 VectorTile 来源和瓦片网格,地图会加载来自 NASA Earth Data 的地理信息数据。
3.3 导出地图为 PDF
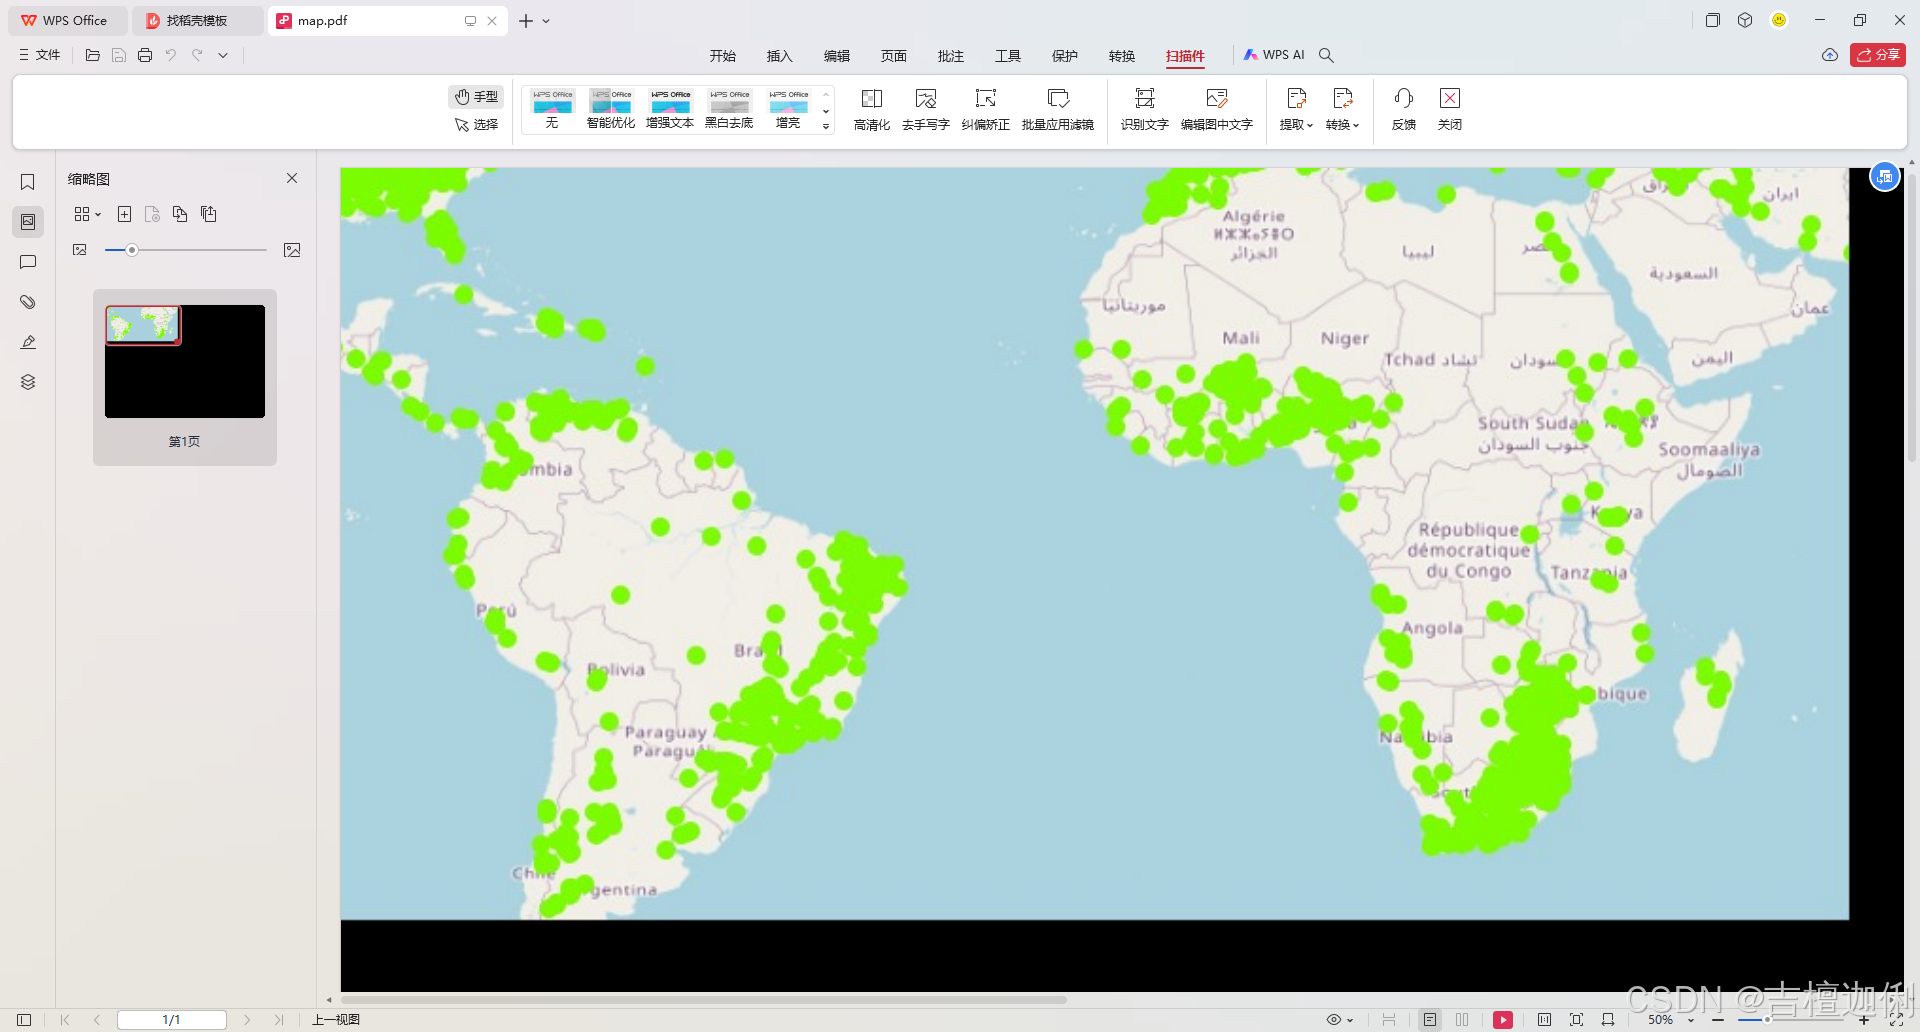
exportPDF 函数是实现导出功能的核心。在地图渲染完成后,我们通过 rendercomplete 事件来触发导出操作。具体步骤如下:
- 创建一个新的
canvas元素,将地图内容渲染到该 canvas 上。 - 使用
jsPDF将该 canvas 转换为 PDF 并下载。
3.4 样式与布局
我们使用了 scoped 样式,确保样式仅应用于当前组件。在容器 #vue-openlayers 上设置了地图的显示区域,并定义了容器的宽度和高度。
导出后
4. 总结
通过以上步骤,我们成功实现了在 Vue 3 中使用 OpenLayers 加载地图,并通过 jsPDF 库将地图导出为 PDF 文件。这个功能非常适合需要地图展示和分享功能的应用。你可以根据需求调整地图的样式和导出的尺寸,以满足不同的需求。
希望这篇文章能帮助你理解如何在 Vue 3 中使用 OpenLayers 和 jsPDF 实现导出地图为 PDF 的功能!