文章目录
- 项目介绍
- 1、导入相应算法
- 2、加载数据
- 3、定义绘制模型学习曲线函数
- 4、多元线性回归建模预测
- 5、随机森林建模预测
- 6、SVR支持向量机
- 7、GBDT梯度提升树
- 8、lightGBM
- 9、Xgboost
- 10、结论
项目介绍
在工业环境中,蒸汽是一种非常常见的能源形式,被广泛应用于各种加热过程、发电以及其它工艺过程中。准确地预测蒸汽的需求量可以帮助企业优化其生产计划,提高能效,减少能源浪费,并降低运营成本。
通常,这样的项目会包含以下几个方面:
- 数据收集:从工业现场的传感器和其他数据源收集历史数据,包括但不限于温度、压力、流量等与蒸汽生成和消耗相关的参数。
- 数据分析:对收集到的数据进行清洗、预处理,并通过统计分析或可视化工具来理解数据的特性。
- 模型建立:使用机器学习算法或者深度学习技术构建预测模型,这些模型能够基于输入的历史数据预测未来的蒸汽需求量。常用的模型可能包括线性回归、随机森林、支持向量机(SVM)、神经网络等。
- 模型评估:通过交叉验证或其他评估方法测试模型的性能,确保模型具有良好的泛化能力,能够在未见过的数据上做出准确的预测。
- 解决方案部署:将训练好的模型部署到实际的工业环境中,实时接收新数据并输出预测结果,帮助工厂实现更高效的能源管理。
- 持续优化:根据模型在真实环境中的表现不断调整和优化,以适应变化的工作条件和技术进步。
火力发电的基本原理是:燃料在燃烧时加热水生成蒸汽,蒸汽压力推动汽轮机旋转,然后汽轮机带动发电机旋转,产生电能。在这一系列的能量转化中,影响发电效率的核心是锅炉的燃烧效率,即燃料燃烧加热水产生高温高压蒸汽。锅炉的燃烧效率的影响因素很多,包括锅炉的可调参数,如燃烧给量,一二次风,引风,返料风,给水水量;以及锅炉的工况,比如锅炉床温、床压,炉膛温度、压力,过热器的温度等。
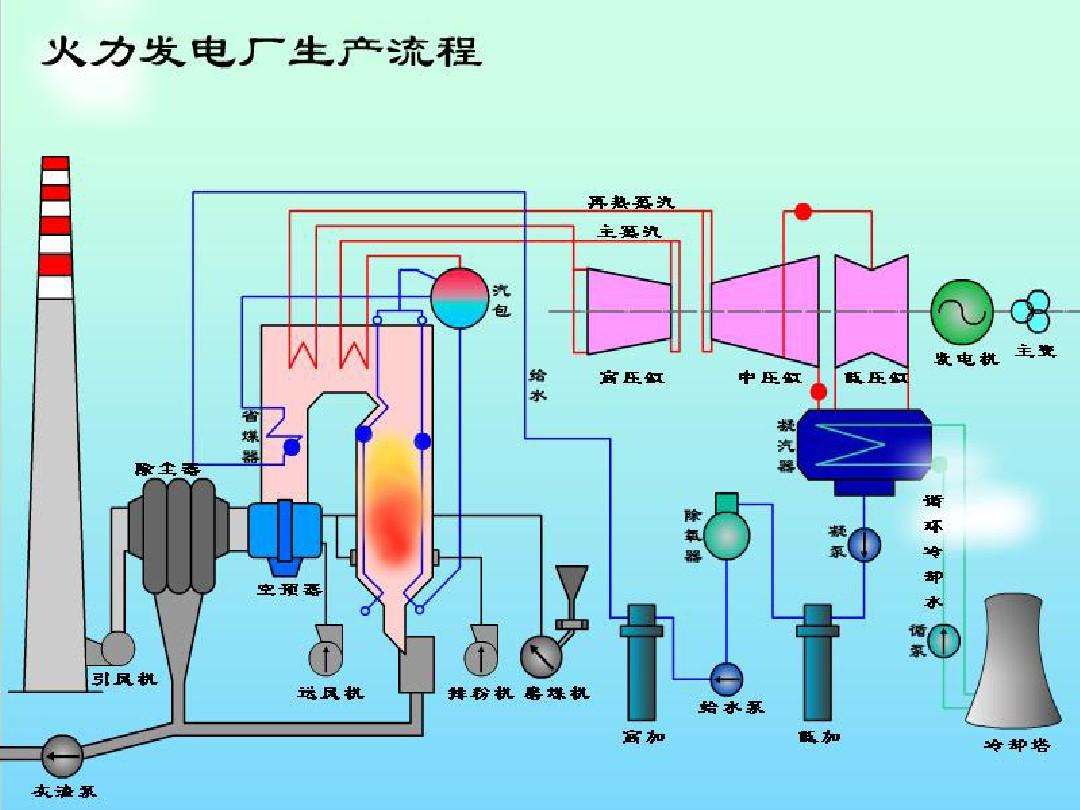
经脱敏后的锅炉传感器采集的数据(采集频率是分钟级别),根据锅炉的工况,预测产生的蒸汽量。
1、导入相应算法
python
import numpy as np
import pandas as pd
import matplotlib.pyplot as plt
from sklearn.linear_model import LinearRegression  #线性回归
from sklearn.ensemble import RandomForestRegressor #随机森林回归
from sklearn.ensemble import GradientBoostingRegressor
from sklearn.svm import SVR  #支持向量回归
import lightgbm as lgb #lightGbm模型
from xgboost import XGBRFRegressor

from sklearn.model_selection import train_test_split # 切分数据
from sklearn.metrics import mean_squared_error #评价指标

from sklearn.model_selection import learning_curve
from sklearn.model_selection import ShuffleSplit
import warnings
warnings.filterwarnings('ignore')
2、加载数据
2.1、未降维数据
python
all_data = pd.read_csv('./processed_zhengqi_data2.csv')

# 训练数据
cond = all_data['label'] == 'train'
train_data = all_data[cond]
train_data.drop(labels = 'label',axis = 1,inplace = True)
# 切分数据 训练数据80% 验证数据20%
X_train,X_valid,y_train,y_valid=train_test_split(train_data.drop(labels='target',axis = 1),
                                                 train_data['target'],
                                                 test_size=0.2)
# 测试数据
cond2 = all_data['label'] == 'test'
test_data = all_data[cond2]
test_data.drop(labels = ['label','target'],axis = 1,inplace = True)
2.2、降维数据
python
#采用 pca 保留特征的数据
train_data_pca = np.load('./train_data_pca.npz')['X_train']
target_data_pca = np.load('./train_data_pca.npz')['y_train']

# 切分数据 训练数据80% 验证数据20%
X_train_pca,X_valid_pca,y_train_pca,y_valid_pca=train_test_split(train_data_pca,target_data_pca,
                                                               test_size=0.2)
test_data_pca = np.load('./test_data_pca.npz')['X_test']
3、定义绘制模型学习曲线函数
python
def plot_learning_curve(model,title,X,y,cv=None):

    # 学习曲线计算
    train_sizes, train_scores, test_scores = learning_curve(model, X, y, cv=cv)

    # 训练数据得分和测试数据得分平均值与方差计算
    train_scores_mean = np.mean(train_scores, axis=1)
    train_scores_std = np.std(train_scores, axis=1)
    test_scores_mean = np.mean(test_scores, axis=1)
    test_scores_std = np.std(test_scores, axis=1)


    # 训练数据得分可视化
    plt.plot(train_sizes, train_scores_mean, 'o-', color="r",
             label="Training score")
    plt.fill_between(train_sizes, train_scores_mean - train_scores_std,
                     train_scores_mean + train_scores_std, alpha=0.1,color="r")
    # 测试数据得分可视化
    plt.plot(train_sizes, test_scores_mean, 'o-', color="g",
             label="Cross-validation score")
    plt.fill_between(train_sizes, test_scores_mean - test_scores_std,
                     test_scores_mean + test_scores_std, alpha=0.1, color="g")
    # 画图设置
    plt.grid() # 网格线设置
    plt.legend(loc="best") # 图例设置
    # 标题标签设置
    plt.title(title)
    plt.xlabel("Training examples")
    plt.ylabel("Score")
4、多元线性回归建模预测
4.1、模型训练
降维数据建模验证
python
clf = LinearRegression()
clf.fit(X_train_pca, y_train_pca)
score = mean_squared_error(y_valid_pca, clf.predict(X_valid_pca))
print("LinearRegression:   ", score)
未降维数据建模验证
python
clf = LinearRegression()
clf.fit(X_train, y_train)
score = mean_squared_error(y_valid, clf.predict(X_valid))
print("LinearRegression:   ", score)
4.2、绘制学习曲线
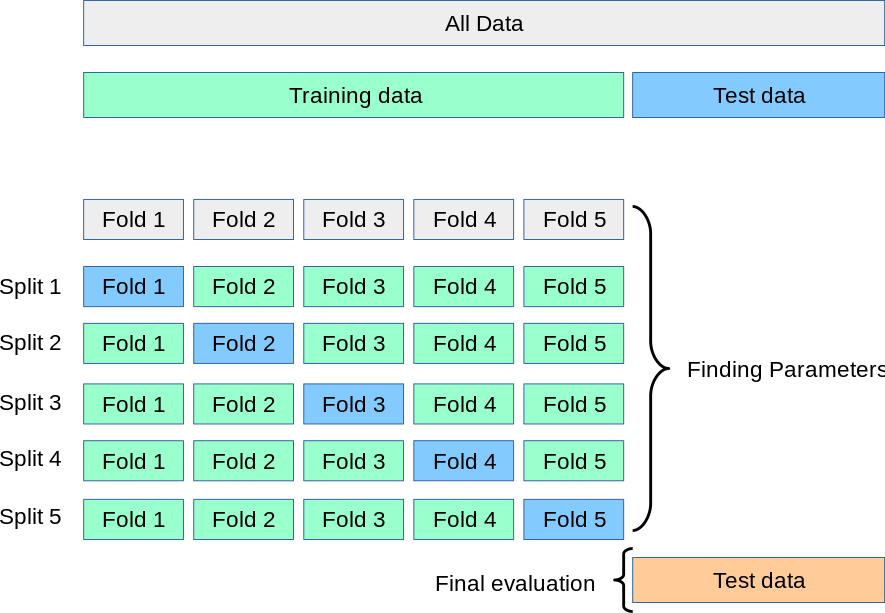
学习曲线是不同训练集大小,模型在训练集和验证集上的得分变化曲线。也就是以样本数为横坐标,训练和交叉验证集上的得分(如准确率)为纵坐标。
learning curve可以帮助我们判断模型现在所处的状态:
- 过拟合(overfiting / high variance 高方差) 说明模型能够很好的拟合已知数据,但是泛化能力很差,属于高方差
- 欠拟合(underfitting / high bias 高偏差)这说明模拟对已知数据和未知都不能进行准确的预测,属于高偏差
降维数据学习曲线
python
X = X_train_pca
y = y_train_pca
# 多元线性回归模型学习曲线图
title = "LinearRegression"
cv = ShuffleSplit(n_splits=100, test_size=0.5)
estimator = LinearRegression()    #建模
plot_learning_curve(estimator, title, X, y, cv = cv)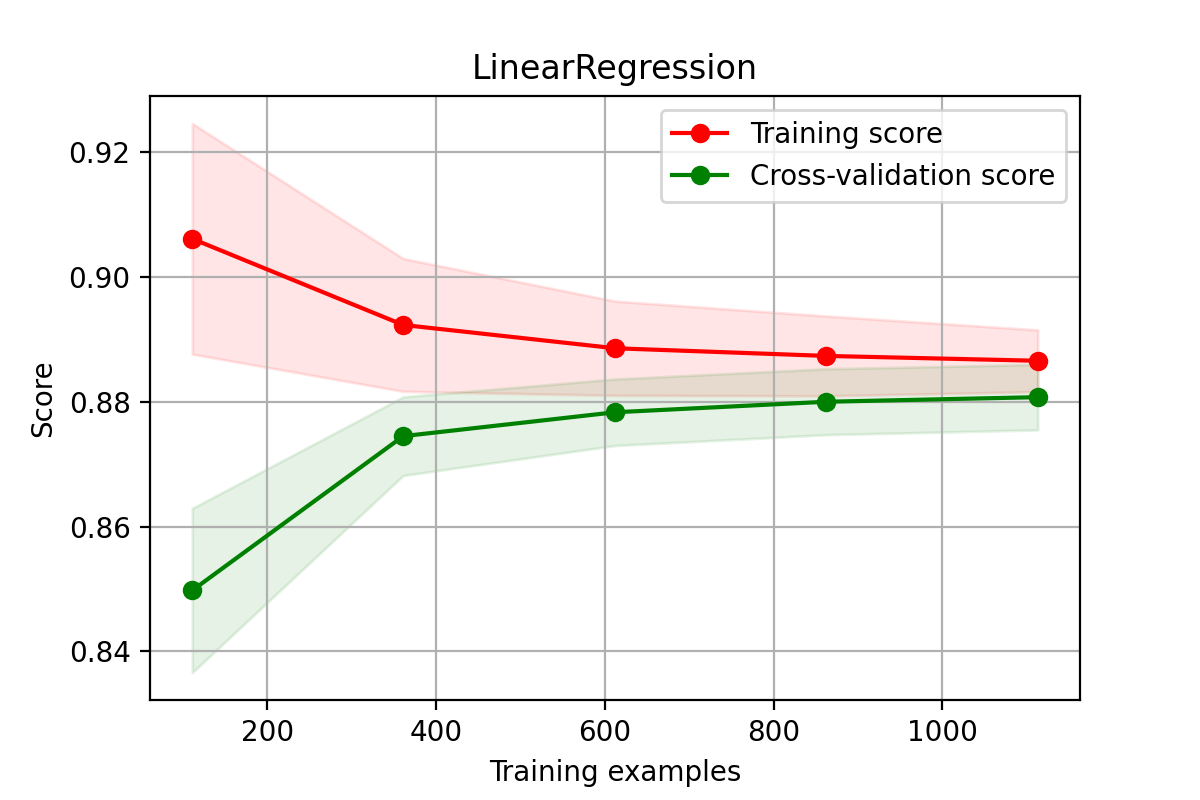
非降维数据学习曲线
python
X = X_train
y = y_train
# 多元线性回归模型学习曲线图
title = "LinearRegression"
cv = ShuffleSplit(n_splits=100, test_size=0.5)
estimator = LinearRegression()    #建模
plot_learning_curve(estimator, title, X, y, cv = cv)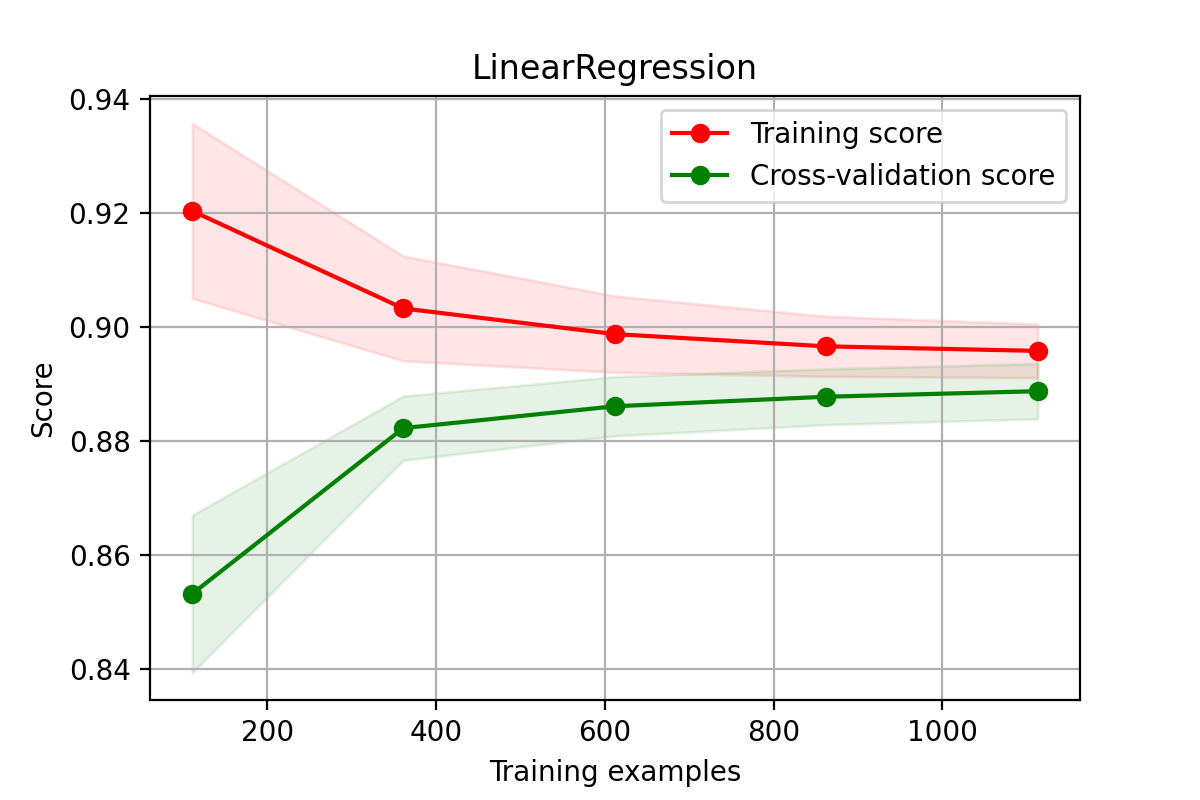
4.3、模型预测
降维数据建模预测提交
python
# 得分是:0.1598
model = LinearRegression()
model.fit(train_data_pca,target_data_pca)
y_ = model.predict(test_data_pca)
display(y_)
np.savetxt('./多元线性回归模型预测(降维数据).txt',y_)
非降维数据建模预测提交
python
# 得分是:0.1620
model = LinearRegression()
model.fit(train_data.drop('target',axis = 1),train_data['target'])
y_ = model.predict(test_data)
display(y_)
np.savetxt('./多元线性回归模型预测(非降维数据).txt',y_)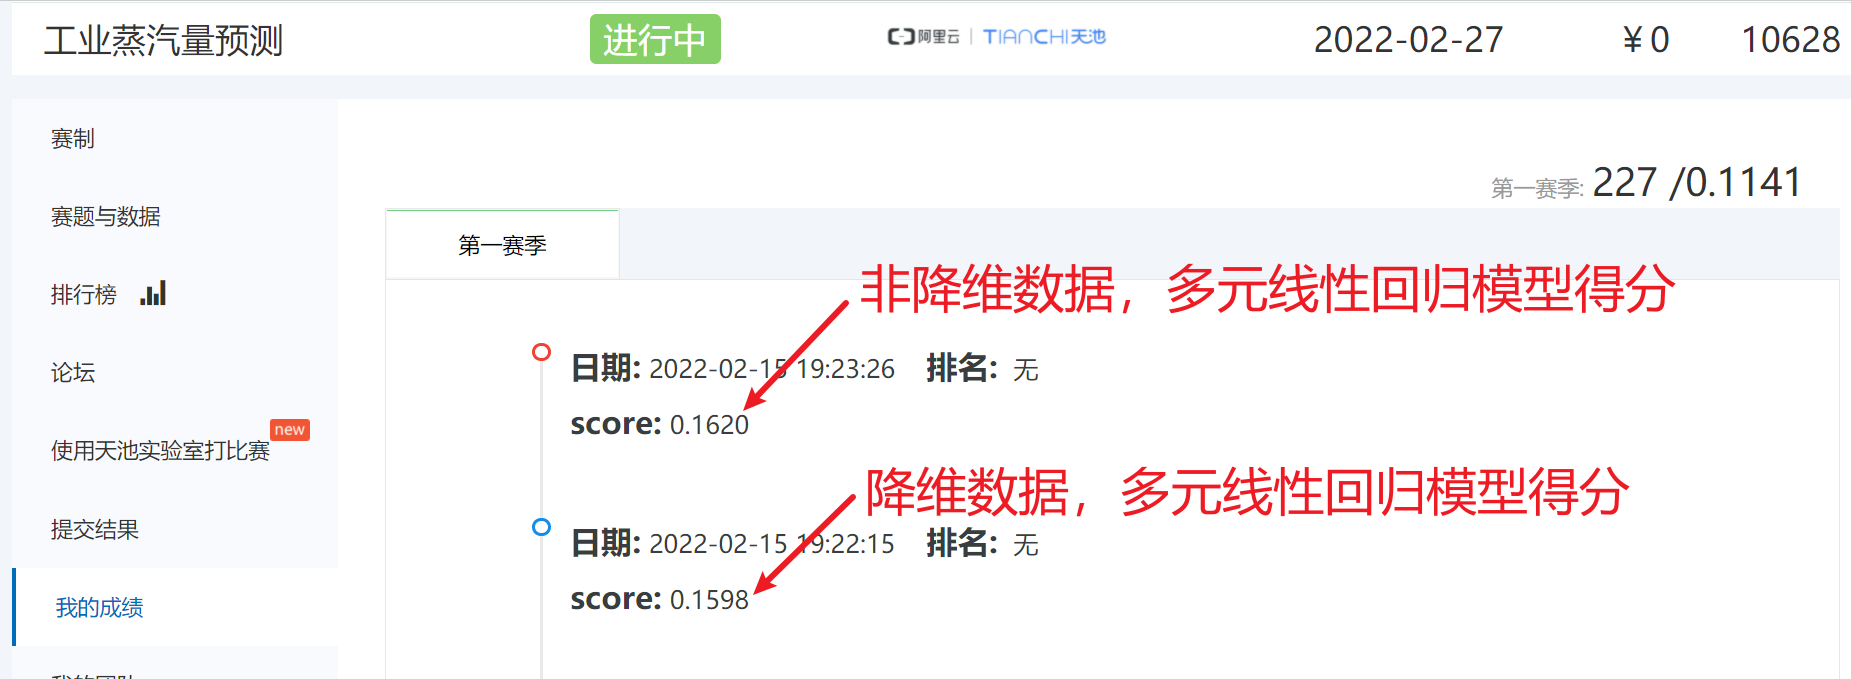
5、随机森林建模预测
5.1、模型训练
降维数据建模验证
python
model = RandomForestRegressor(n_estimators=200, # 200棵树模型
                            max_depth= 10,
                            max_features = 'auto',# 构建树时,特征筛选量
                            min_samples_leaf=10,# 是叶节点所需的最小样本数
                            min_samples_split=40,# 是分割所需的最小样本数
                            criterion='squared_error')
model.fit(X_train_pca, y_train_pca)
score = mean_squared_error(y_valid_pca, model.predict(X_valid_pca))
print("随机森林:   ", score)
非降维数据建模验证
python
model = RandomForestRegressor(n_estimators=200, # 200棵树模型
                            max_depth= 10,
                            max_features = 'auto',# 构建树时,特征筛选量
                            min_samples_leaf=10,# 是叶节点所需的最小样本数
                            min_samples_split=40,# 是分割所需的最小样本数
                            criterion='squared_error')
model.fit(X_train, y_train)
score = mean_squared_error(y_valid, model.predict(X_valid))
print("LinearRegression:   ", score)
5.2、绘制学习曲线
绘制学习曲线比较耗时间,这里绘制非降维数据的学习曲线
python
%%time
# 比较耗时:5min 14s
X = X_train
y = y_train
# 随机森林模型学习曲线图
title = "RandomForestRegressor"
cv = ShuffleSplit(n_splits=100, test_size=0.5)
model = RandomForestRegressor(n_estimators=200, # 200棵树模型
                            max_depth= 10,
                            max_features = 'auto',# 构建树时,特征筛选量
                            min_samples_leaf=10,# 是叶节点所需的最小样本数
                            min_samples_split=40,# 是分割所需的最小样本数
                            criterion='squared_error')
plot_learning_curve(model, title, X, y, cv = cv)
plt.savefig('./12-随机森林非降维数据学习曲线.png',dpi = 200)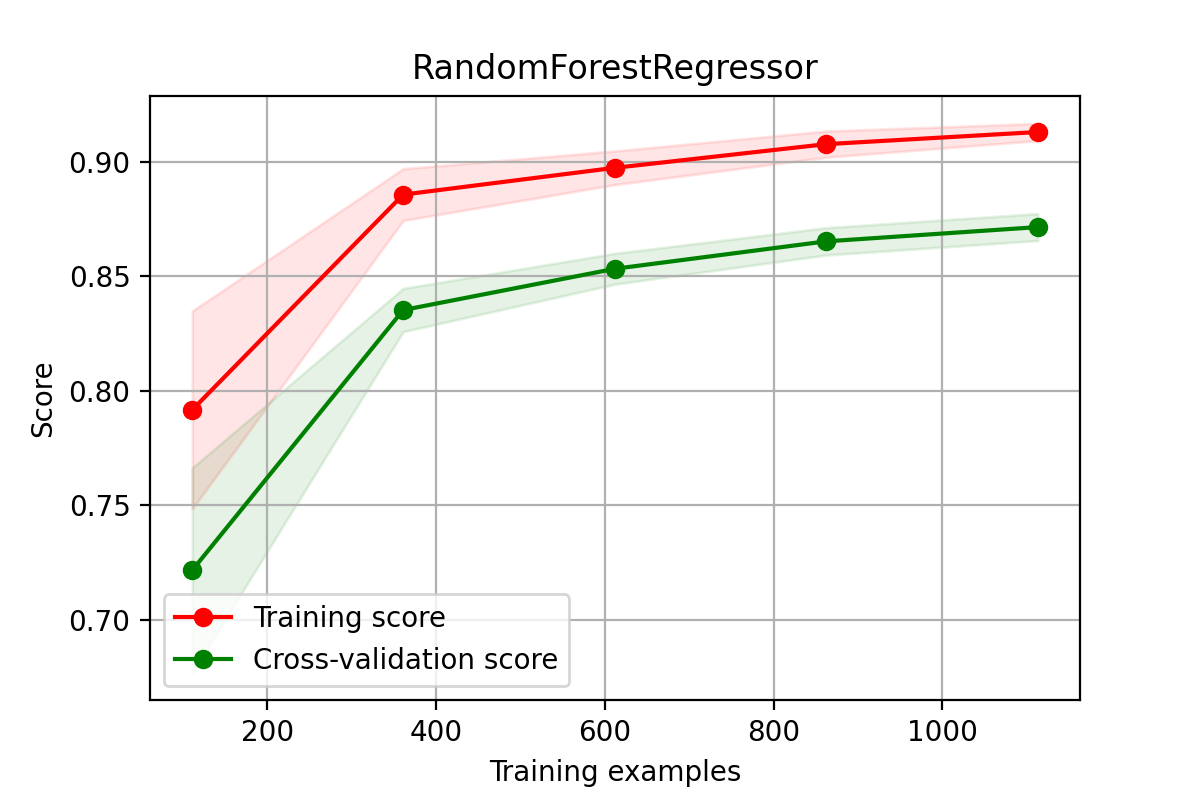
5.3、模型预测
降维数据建模预测提交
python
# 得分是:1.0579
model =  RandomForestRegressor(n_estimators=200, # 200棵树模型
                            max_depth= 10,
                            max_features = 'auto',# 构建树时,特征筛选量
                            min_samples_leaf=10,# 是叶节点所需的最小样本数
                            min_samples_split=40,# 是分割所需的最小样本数
                            criterion='squared_error')
model.fit(train_data_pca,target_data_pca)
y_ = model.predict(test_data_pca)
display(y_)
np.savetxt('./随机森林模型预测(降维数据).txt',y_)
非降维数据建模预测提交
python
# 得分是:0.1461
model = RandomForestRegressor(n_estimators=200, # 200棵树模型
                            max_depth= 10,
                            max_features = 'auto',# 构建树时,特征筛选量
                            min_samples_leaf=10,# 是叶节点所需的最小样本数
                            min_samples_split=40,# 是分割所需的最小样本数
                            criterion='squared_error')
model.fit(train_data.drop('target',axis = 1),train_data['target'])
y_ = model.predict(test_data)
display(y_)
np.savetxt('./随机森林模型预测(非降维数据).txt',y_)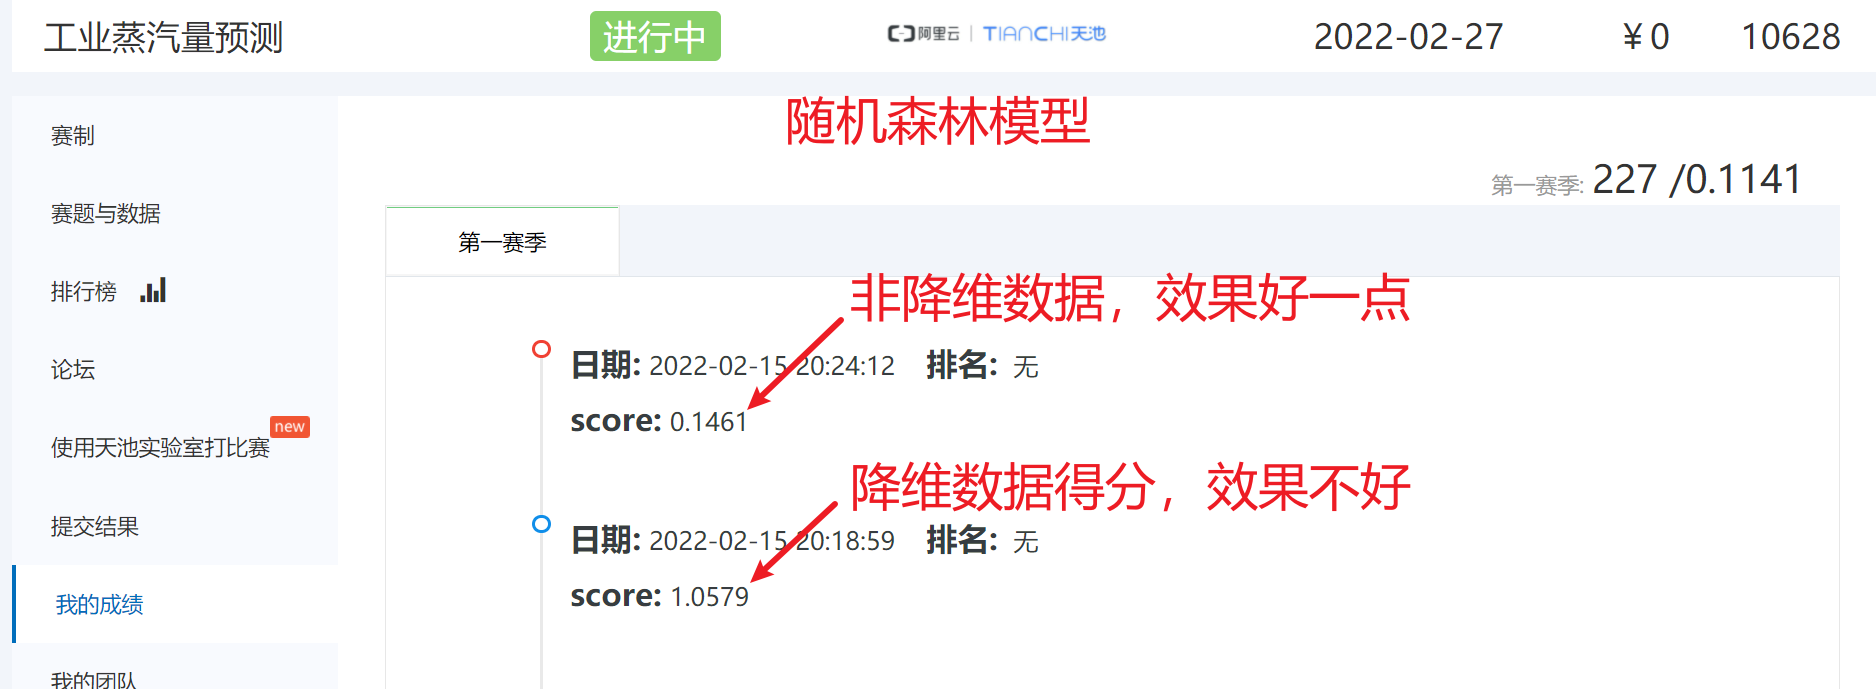
6、SVR支持向量机
6.1、模型训练
降维数据
python
model = SVR(kernel='rbf',C = 1,gamma=0.01,tol = 0.0001,epsilon=0.3)
model.fit(X_train_pca, y_train_pca)
score = mean_squared_error(y_valid_pca, model.predict(X_valid_pca))
print("SVR得分:   ", score)
非降维数据
python
model = SVR(kernel='rbf')
model.fit(X_train, y_train)
score = mean_squared_error(y_valid, model.predict(X_valid))
print("SVR得分:   ", score)
6.2、绘制学习曲线
降维数据
python
%%time
X = X_train_pca
y = y_train_pca
# 随机森林模型学习曲线图
title = "RandomForestRegressor"
cv = ShuffleSplit(n_splits=100, test_size=0.5)
model = SVR(kernel='rbf',C = 1,gamma=0.01,tol = 0.0001,epsilon=0.3)
plot_learning_curve(model, title, X, y, cv = cv)
plt.savefig('./15-SVR降维数据学习曲线.png',dpi = 200)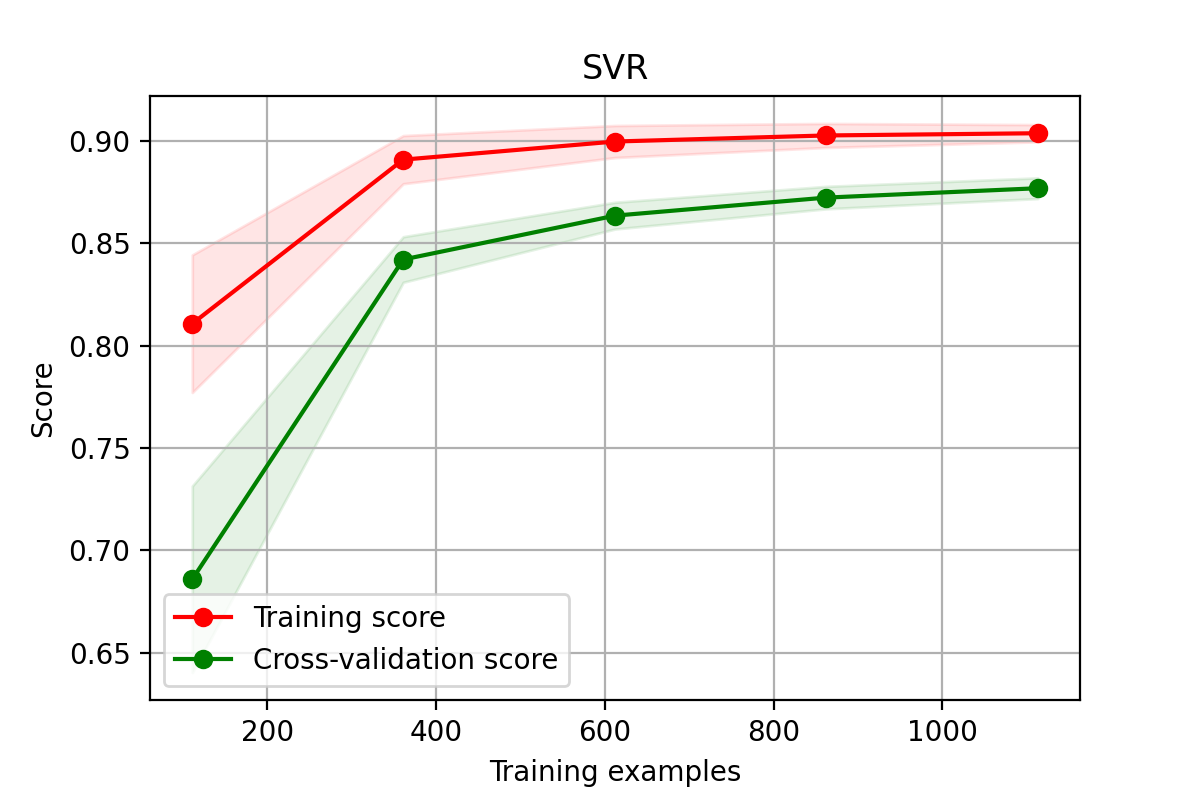
非降维数据
python
%%time
X = X_train
y = y_train
# 随机森林模型学习曲线图
title = "RandomForestRegressor"
cv = ShuffleSplit(n_splits=100, test_size=0.5)
model = SVR(kernel='rbf')
plot_learning_curve(model, title, X, y, cv = cv)
plt.savefig('./16-SVR非降维数据学习曲线.png',dpi = 200)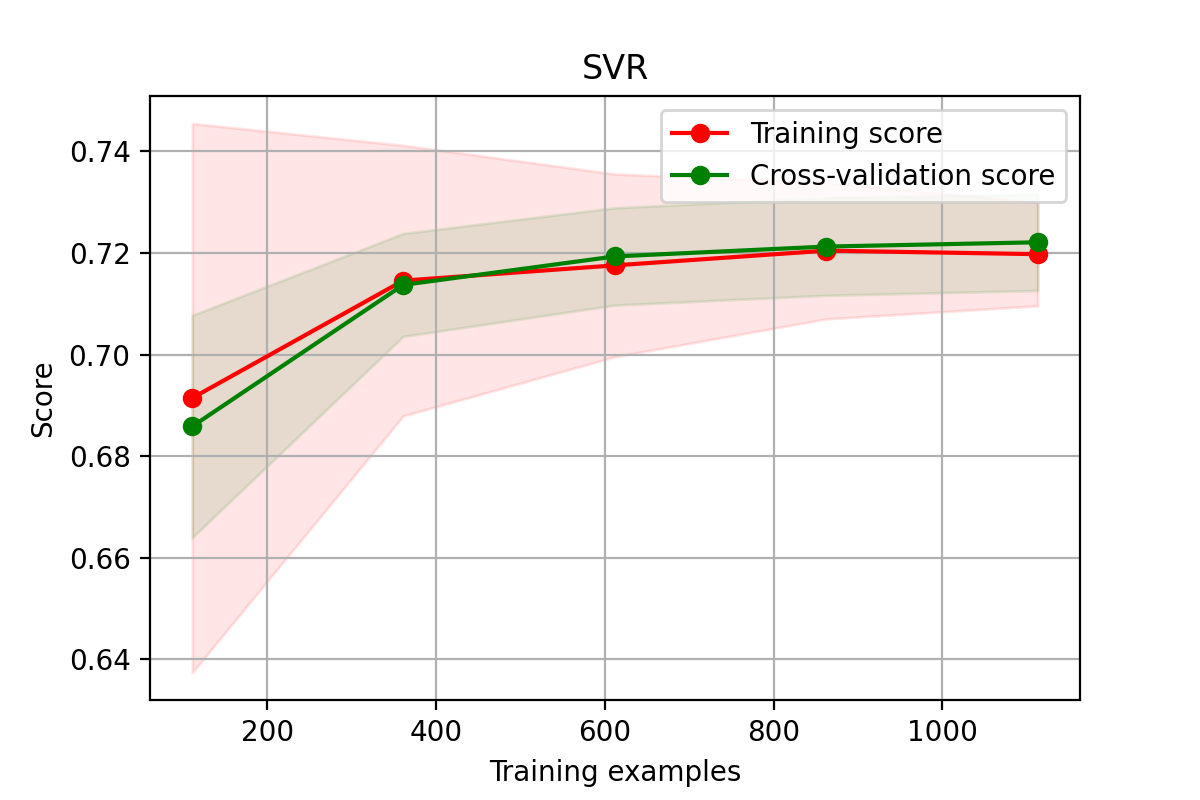
6.3、模型预测
降维数据
python
# 得分是:0.2654
model =  SVR(kernel='rbf',C = 1,gamma=0.01,tol = 0.0001,epsilon=0.3)
model.fit(train_data_pca,target_data_pca)
y_ = model.predict(test_data_pca)
display(y_)
np.savetxt('./SVR模型预测(降维数据).txt',y_)
非降维数据
python
# 得分是:1.9934
model =SVR(kernel='rbf')
model.fit(train_data.drop('target',axis = 1),train_data['target'])
y_ = model.predict(test_data)
display(y_)
np.savetxt('./SVR模型预测(非降维数据).txt',y_)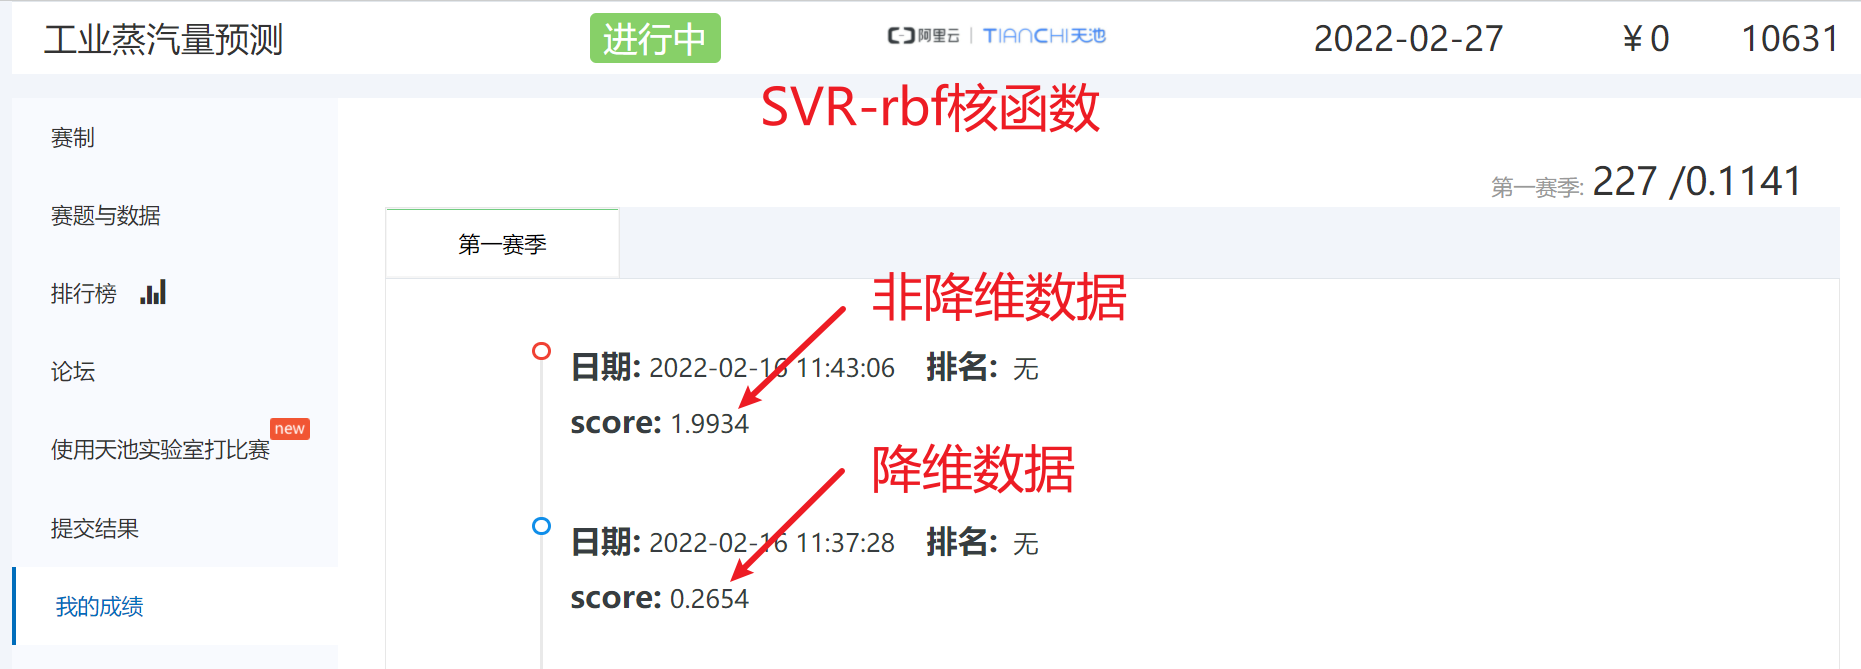
poly多项式核函数建模预测--降维数据
python
# 得分是:4.7068
model =  SVR(kernel='poly')
model.fit(train_data_pca,target_data_pca)
y_ = model.predict(test_data_pca)
display(y_)
np.savetxt('./SVR-poly模型预测(降维数据).txt',y_)
poly多项式核函数建模预测--非降维数据
python
# 得分是:0.7423
model =SVR(kernel='poly')
model.fit(train_data.drop('target',axis = 1),train_data['target'])
y_ = model.predict(test_data)
display(y_)
np.savetxt('./SVR--poly模型预测(非降维数据).txt',y_)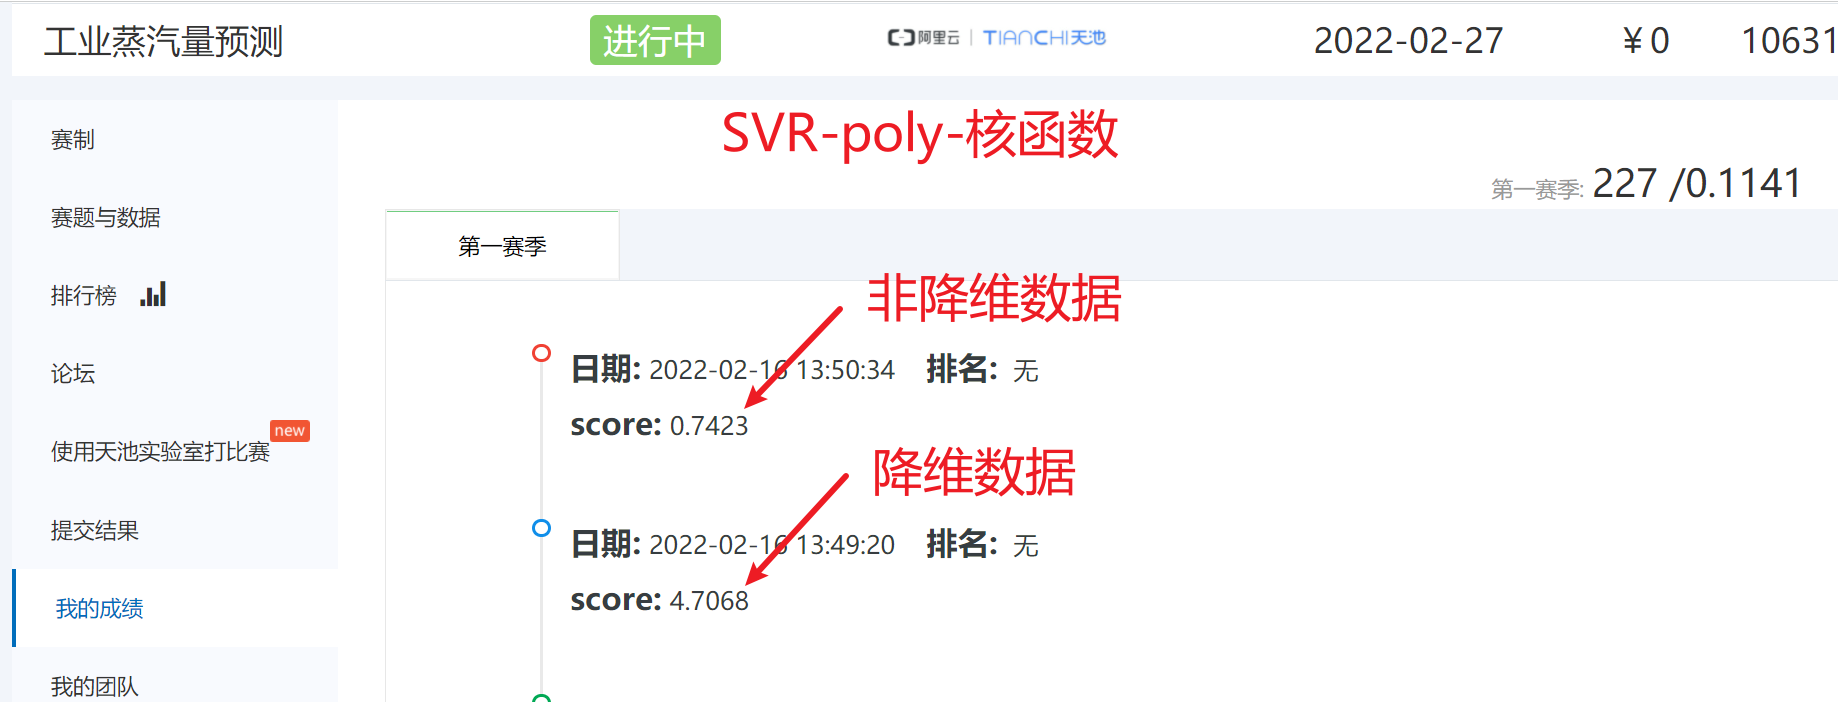
7、GBDT梯度提升树
7.1、模型训练
降维数据
python
model = GradientBoostingRegressor(learning_rate=0.03, # 学习率
                                loss='huber',  # 损失函数
                                max_depth=14, # 决策树深度
                                max_features='sqrt',# 节点分裂时参与判断的最大特征数
                                min_samples_leaf=10,# 是叶节点所需的最小样本数
                                min_samples_split=40,# 是分割所需的最小样本数
                                n_estimators=300,# 集成树数量
                                subsample=0.8)# 抽样比例
model.fit(X_train_pca, y_train_pca)
score = mean_squared_error(y_valid_pca, model.predict(X_valid_pca))
print("GBDT得分:   ", score)
非降维数据
python
model = GradientBoostingRegressor(learning_rate=0.03, # 学习率
                                loss='huber',  # 损失函数
                                max_depth=14, # 决策树深度
                                max_features='sqrt',# 节点分裂时参与判断的最大特征数
                                min_samples_leaf=10,# 是叶节点所需的最小样本数
                                min_samples_split=40,# 是分割所需的最小样本数
                                n_estimators=300,# 集成树数量
                                subsample=0.8)# 抽样比例
model.fit(X_train, y_train)
score = mean_squared_error(y_valid, model.predict(X_valid))
print("GBDT得分:   ", score)
7.2、绘制学习曲线
降维数据学习曲线
python
%%time
X = X_train_pca
y = y_train_pca
# 随机森林模型学习曲线图
title = "GBDT"
cv = ShuffleSplit(n_splits=100, test_size=0.5)
model = SVR(kernel='rbf',C = 1,gamma=0.01,tol = 0.0001,epsilon=0.3)
plot_learning_curve(model, title, X, y, cv = cv)
plt.savefig('./17-GBDT降维数据学习曲线.png',dpi = 200)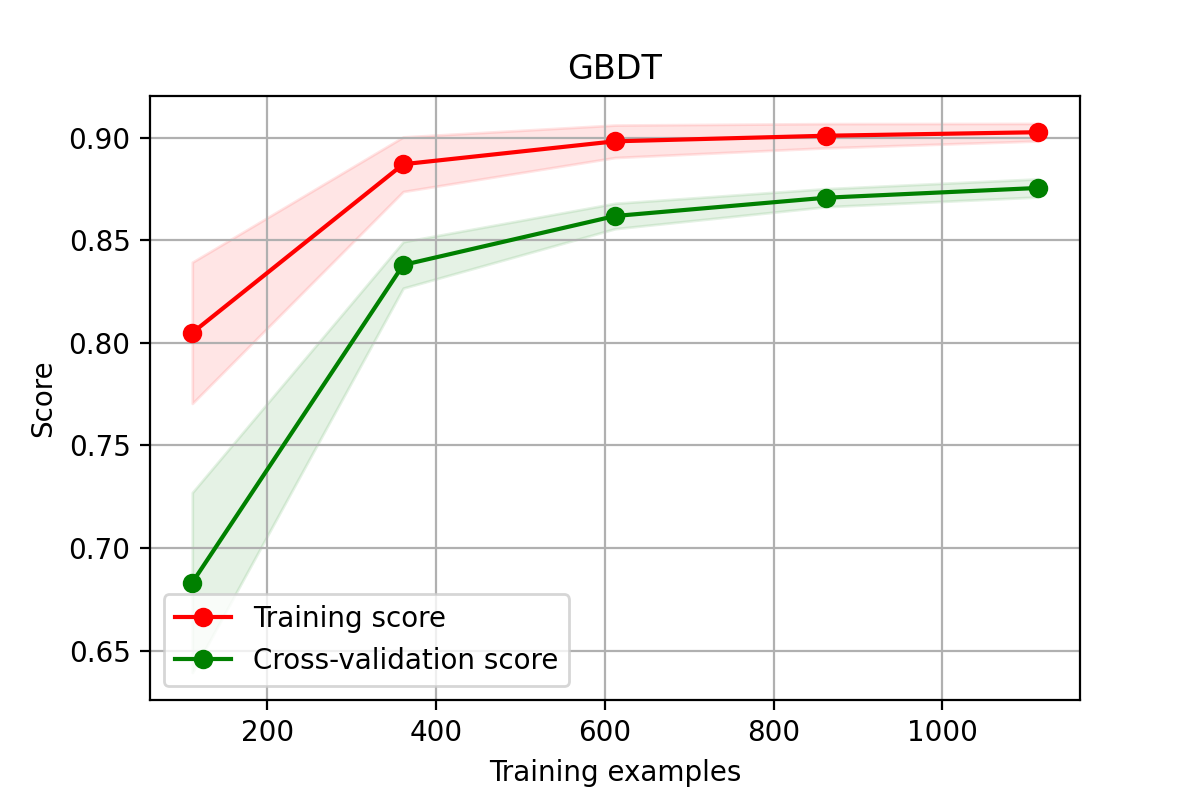
7.3、模型预测
降维数据
python
# 得分是:0.3765
model =  GradientBoostingRegressor(learning_rate=0.03, # 学习率
                                loss='huber',  # 损失函数
                                max_depth=14, # 决策树深度
                                max_features='sqrt',# 节点分裂时参与判断的最大特征数
                                min_samples_leaf=10,# 是叶节点所需的最小样本数
                                min_samples_split=40,# 是分割所需的最小样本数
                                n_estimators=300,# 集成树数量
                                subsample=0.8)# 抽样比例
model.fit(train_data_pca,target_data_pca)
y_ = model.predict(test_data_pca)
display(y_)
np.savetxt('./GBDT模型预测(降维数据).txt',y_)
非降维数据
python
# 得分是:0.1392
model = GradientBoostingRegressor(learning_rate=0.03, # 学习率
                                loss='huber',  # 损失函数
                                max_depth=14, # 决策树深度
                                max_features='sqrt',# 节点分裂时参与判断的最大特征数
                                min_samples_leaf=10,# 是叶节点所需的最小样本数
                                min_samples_split=40,# 是分割所需的最小样本数
                                n_estimators=300,# 集成树数量
                                subsample=0.8)# 抽样比例
model.fit(train_data.drop('target',axis = 1),train_data['target'])
y_ = model.predict(test_data)
display(y_)
np.savetxt('./GBDT模型预测(非降维数据).txt',y_)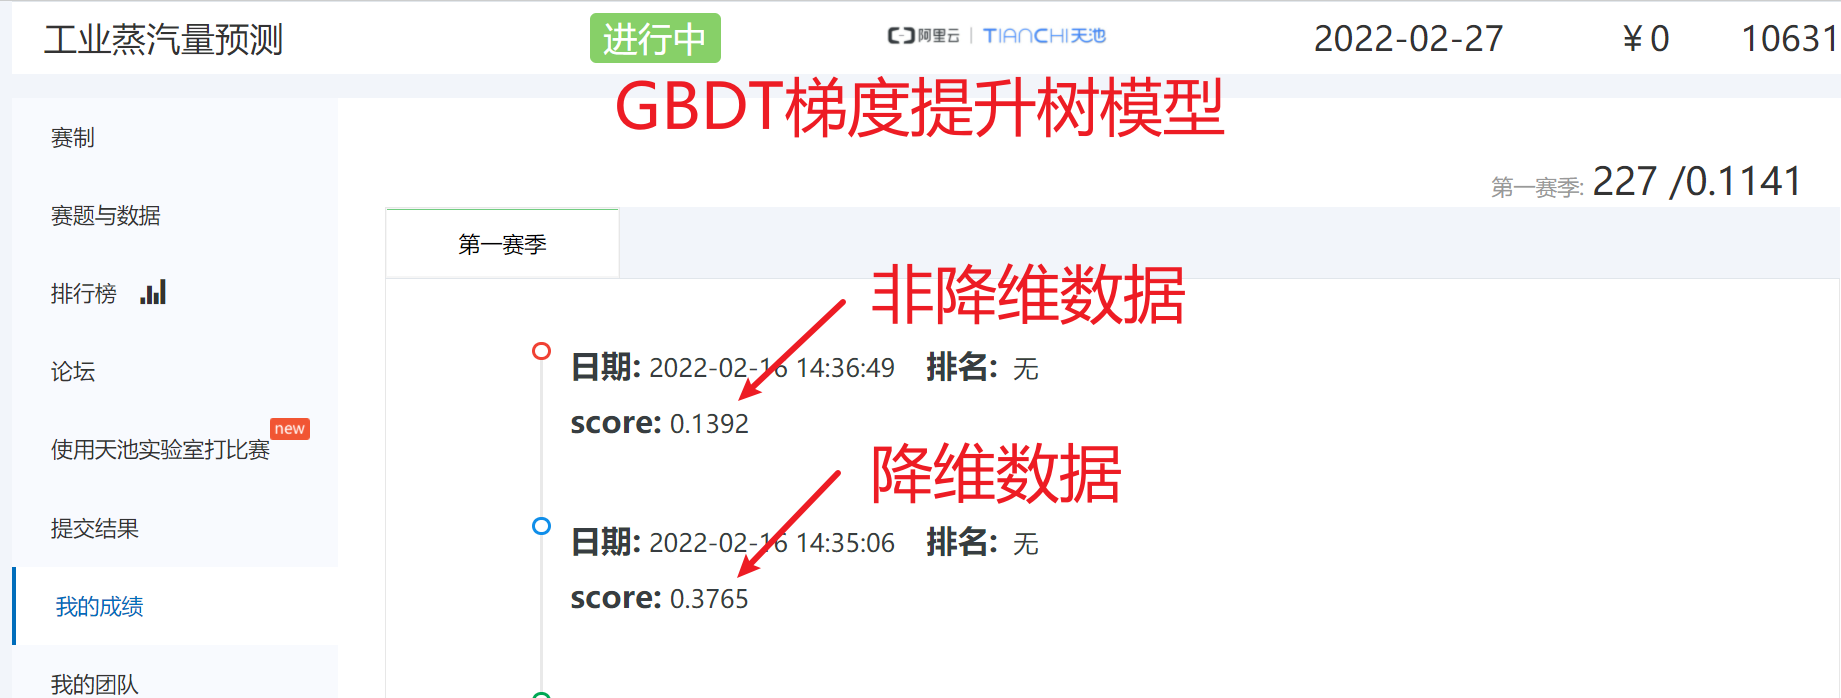
8、lightGBM
8.1、模型训练
降维数据
python
model = lgb.LGBMRegressor(learning_rate=0.05, # 学习率
                        n_estimators=300,# 集成树数量
                        min_child_samples=10,# 是叶节点所需的最小样本数
                        max_depth=5, # 决策树深度
                        num_leaves = 25,
                        colsample_bytree =0.8,#构建树时特征选择比例
                        subsample=0.8,# 抽样比例
                        reg_alpha = 0.5,
                        reg_lambda = 0.1 )
model.fit(X_train_pca, y_train_pca)
score = mean_squared_error(y_valid_pca, model.predict(X_valid_pca))
print("LGB得分:   ", score)
非降维数据
python
model = lgb.LGBMRegressor(learning_rate=0.05, # 学习率
                        n_estimators=300,# 集成树数量
                        min_child_samples=10,# 是叶节点所需的最小样本数
                        max_depth=5, # 决策树深度
                        num_leaves = 25,
                        colsample_bytree =0.8,#构建树时特征选择比例
                        subsample=0.8,# 抽样比例
                        reg_alpha = 0.5,
                        reg_lambda = 0.1 )
model.fit(X_train, y_train)
score = mean_squared_error(y_valid, model.predict(X_valid))
print("LGB得分:   ", score)
8.2、绘制学习曲线
降维数据
python
%%time
X = X_train
y = y_train
# lightGBM模型学习曲线图
title = "lightGBM"
cv = ShuffleSplit(n_splits=100, test_size=0.5)
model = lgb.LGBMRegressor(learning_rate=0.05, # 学习率
                        n_estimators=300,# 集成树数量
                        min_child_samples=10,# 是叶节点所需的最小样本数
                        max_depth=5, # 决策树深度
                        num_leaves = 25,
                        colsample_bytree =0.8,#构建树时特征选择比例
                        subsample=0.8,# 抽样比例
                        reg_alpha = 0.5,
                        reg_lambda = 0.1 )
plot_learning_curve(model, title, X, y, cv = cv)
plt.savefig('./22-lightGBM非降维数据学习曲线.png',dpi = 200)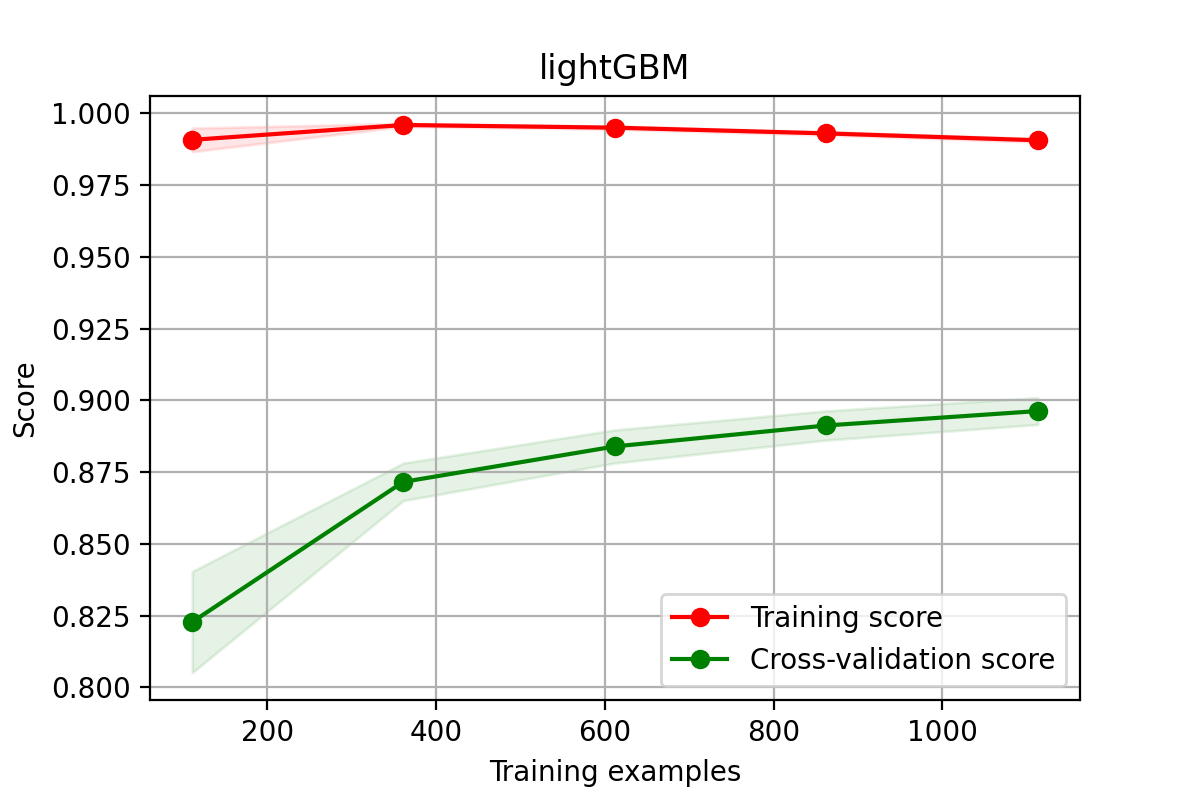
8.3、模型预测
降维数据
python
# 得分是:0.6383
model =  lgb.LGBMRegressor(learning_rate=0.05, # 学习率
                        n_estimators=100,# 集成树数量
                        min_child_samples=10,# 是叶节点所需的最小样本数
                        max_depth=5, # 决策树深度
                        num_leaves = 25,
                        colsample_bytree =0.8,#构建树时特征选择比例
                        subsample=0.8,# 抽样比例
                        reg_alpha = 0.5,
                        reg_lambda = 0.1 )
model.fit(train_data_pca,target_data_pca)
y_ = model.predict(test_data_pca)
display(y_)
np.savetxt('./lightGBM模型预测(降维数据).txt',y_)
非降维数据
python
# 得分是:0.1378
model = lgb.LGBMRegressor(learning_rate=0.05, # 学习率
                        n_estimators=100,# 集成树数量
                        min_child_samples=10,# 是叶节点所需的最小样本数
                        max_depth=5, # 决策树深度
                        num_leaves = 25,
                        colsample_bytree =0.8,#构建树时特征选择比例
                        subsample=0.8,# 抽样比例
                        reg_alpha = 0.5,
                        reg_lambda = 0.1 )
model.fit(train_data.drop('target',axis = 1),train_data['target'])
y_ = model.predict(test_data)
display(y_)
np.savetxt('./lightGBM模型预测(非降维数据).txt',y_)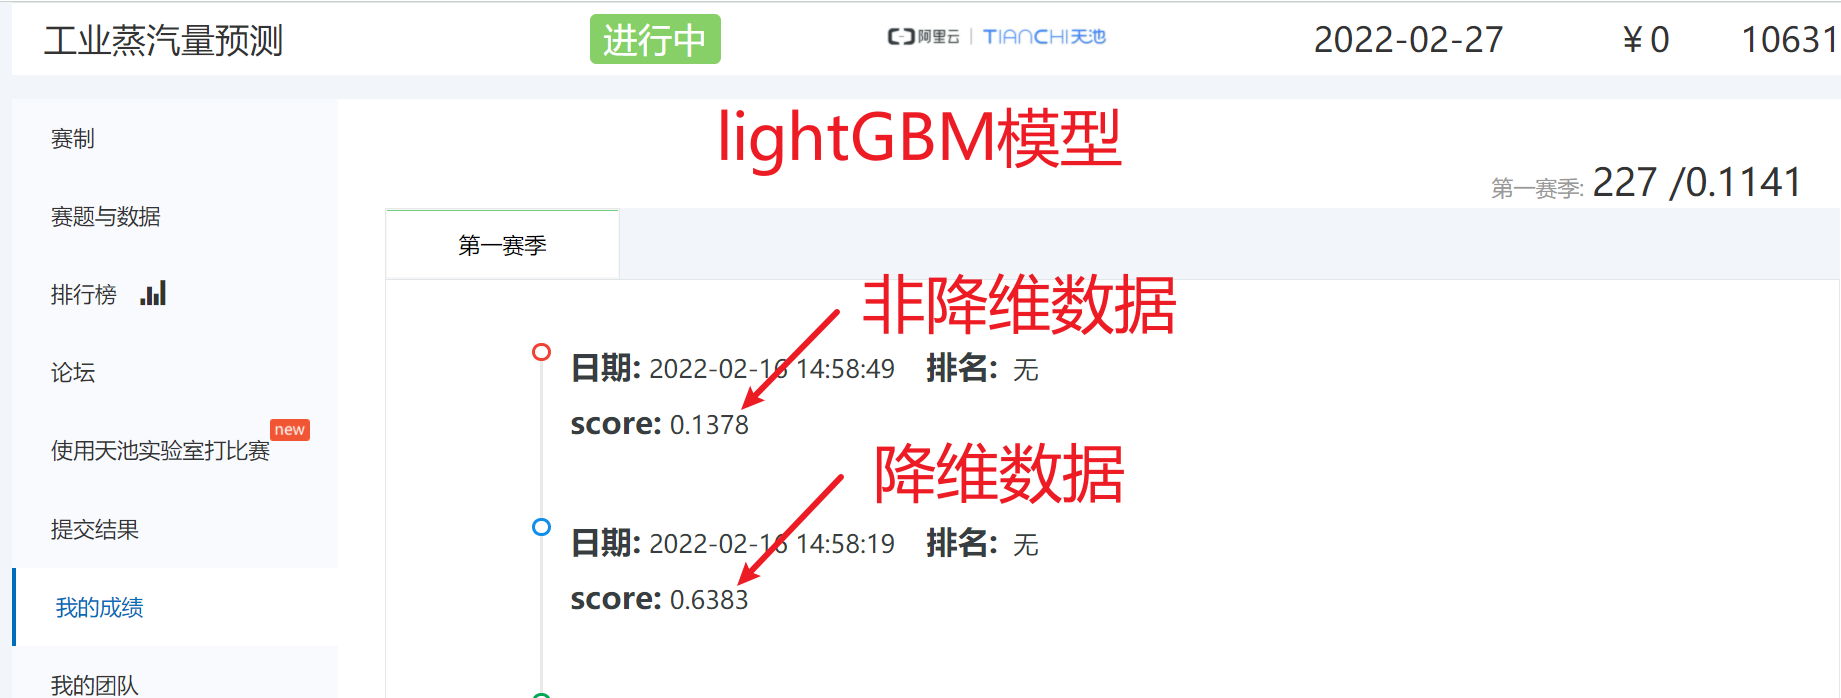
9、Xgboost
9.1、模型训练
降维数据
python
model = XGBRFRegressor(n_estimators = 300,
                       max_depth=15,
                       subsample = 0.8,
                       colsample_bytree = 0.8,
                       learning_rate =1,
                       gamma = 0,
                       reg_lambda= 0 ,# L2正则化
                       reg_alpha = 0,verbosity=1)# L1正则化
model.fit(X_train_pca, y_train_pca)
score = mean_squared_error(y_valid_pca, model.predict(X_valid_pca))
print("Xgboost得分:   ", score)
非降维数据
python
model = XGBRFRegressor(n_estimators = 300,
                       max_depth=15,
                       subsample = 0.8,
                       colsample_bytree = 0.8,
                       learning_rate =1,
                       gamma = 0,
                       reg_lambda= 0 ,# L2正则化
                       reg_alpha = 0,verbosity=1)# L1正则化
model.fit(X_train, y_train)
score = mean_squared_error(y_valid, model.predict(X_valid))
print("Xgboost得分:   ", score)
9.2、模型预测
降维数据
python
# 得分是:0.6798
model = XGBRFRegressor(n_estimators = 300,
                       max_depth=15,
                       subsample = 0.8,
                       colsample_bytree = 0.8,
                       learning_rate =1,
                       gamma = 0,
                       reg_lambda= 0 ,# L2正则化
                       reg_alpha = 0,verbosity=1)# L1正则化
model.fit(train_data_pca,target_data_pca)
y_ = model.predict(test_data_pca)
display(y_)
np.savetxt('./Xgboost模型预测(降维数据).txt',y_)
非降维数据
python
# 得分是:0.1329
model = XGBRFRegressor(n_estimators = 300,
                       max_depth=15,
                       subsample = 0.8,
                       colsample_bytree = 0.8,
                       learning_rate =1,
                       gamma = 0,
                       reg_lambda= 0 ,# L2正则化
                       reg_alpha = 0,verbosity=1)# L1正则化
model.fit(train_data.drop('target',axis = 1),train_data['target'])
y_ = model.predict(test_data)
display(y_)
np.savetxt('./Xgboost模型预测(非降维数据).txt',y_)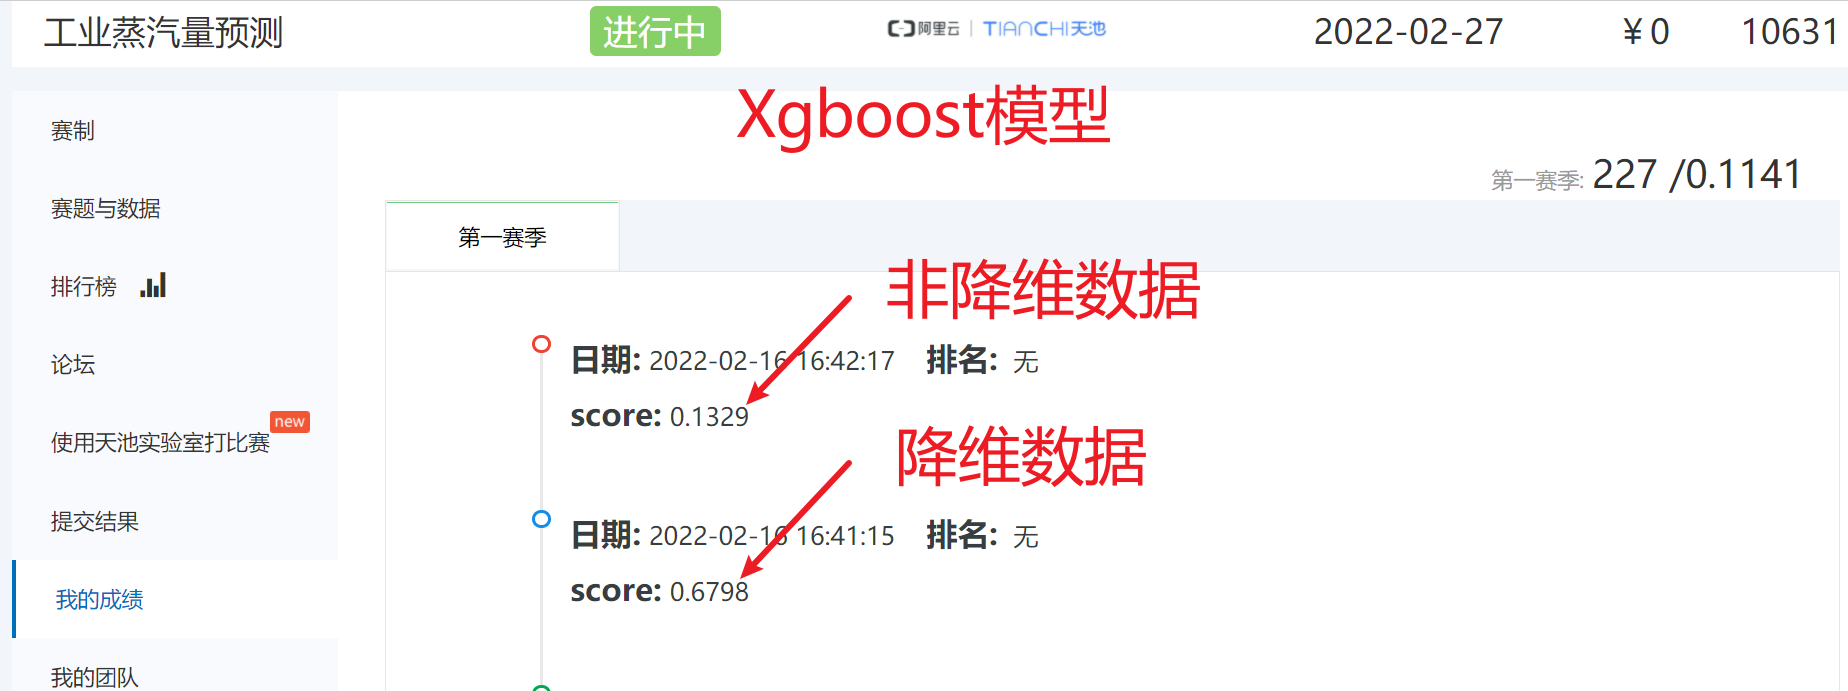
10、结论
- 集成算法对非降维数据,表现更好
- 多元线性回归、SVR对降维数据,表现更好
- 整体来说,集成算法效果更好
- 随机森林:0.1461
- GBDT:0.1392
- lightGBM:0.1378
- Xgboost:0.1329
还需要,继续对特征进行挖掘、对算法进行融合!