elk(都是6.2.4重点-版本2-收集 nginx 日志 并分析绘图 (单点es ,redis缓存 ) -无filebeat
如果对运维课程感兴趣,可以在b站上、A站或csdn上搜索我的账号: 运维实战课程,可以关注我,学习更多免费的运维实战技术视频
1 . 搭建 elk 6.2.4 环境(cent 7. 4 ),logstash收集 nginx 日志 写入es ( 用 redis解耦操作)
规划: 192.168.171.128: es
192.168.171.129: logstash1 和nginx (收集nginx日志) logstash1将日志数据写入redis
192.168.171.130: nginx+kibana(nginx使得kibana能用用户和密码认证登录)
192.168.171.131: redis 和logstash2 logstash2将日志数据从redis读出,写入es中
1 ) 在192.168.171.128上: 安装elasticsearch :
a)环境准备
root@bogon \~# vim /etc/security/limits.conf
* soft nofile 65536 #注意必须是65536以上,65535都不行
* hard nofile 65536
* soft nproc 4096
* hard nproc 4096
root@bogon \~# vim /etc/security/limits.d/20-nproc.conf
* soft nproc 4096 #至少是4096,若小于则需修改,也可大于4096
root@bogon \~# vim /etc/sysctl.conf
vm.max_map_count=262144 #添加,至少是262144
root@bogon \~# sysctl -p
root@bogon \~# reboot
root@bogon \~# systemctl stop firewalld.service
b)安装jdk1.8:
root@bogon \~# mkdir /usr/local/java
root@bogon \~# rz
上传jdk1.8包
root@bogon \~# ls
jdk-8u144-linux-x64.tar.gz
root@bogon \~# tar -zxf jdk-8u144-linux-x64.tar.gz
root@bogon \~# ls
jdk1.8.0_144 jdk-8u144-linux-x64.tar.gz
root@bogon \~# mv jdk1.8.0_144/ /usr/local/java/
root@bogon \~# ls /usr/local/java/
jdk1.8.0_144
root@bogon \~# vim /etc/profile
#最后面添加:
JAVA_HOME=/usr/local/java/jdk1.8.0_144
CLASSPATH=.:JAVA_HOME/jre/lib/rt.jar:JAVA_HOME/lib/dt.jar:$JAVA_HOME/lib/tools.jar
PATH=JAVA_HOME/bin:PATH
export JAVA_HOME CLASSPATH PATH
root@bogon \~# source /etc/profile
root@bogon \~# java -version
java version "1.8.0_144"
Java(TM) SE Runtime Environment (build 1.8.0_144-b01)
Java HotSpot(TM) 64-Bit Server VM (build 25.144-b01, mixed mode)
root@bogon \~# rz
上传elasticsearch包,并安装elasticsearch,(es启动需要普通用户,其他服务启动用root)
root@bogon \~# ls
elasticsearch-6.2.4.tar.gz jdk-8u144-linux-x64.tar.gz
root@bogon \~# tar -zxf elasticsearch-6.2.4.tar.gz
root@bogon \~# ls
elasticsearch-6.2.4 elasticsearch-6.2.4.tar.gz jdk-8u144-linux-x64.tar.gz
root@bogon \~# mv elasticsearch-6.2.4 /opt/
root@bogon \~# ls /opt/elasticsearch-6.2.4/
bin config lib LICENSE.txt logs modules NOTICE.txt plugins README.textile
root@bogon \~# groupadd eszu
root@bogon \~# useradd esyonghu -g eszu -p 123456
root@bogon \~# chown -R esyonghu:eszu /opt/elasticsearch-6.2.4/
root@bogon \~# su - esyonghu
esyonghu@bogon \~$ vim /opt/elasticsearch-6.2.4/config/elasticsearch.yml
network.host: 192.168.171.128 #修改,本机ip,或者0.0.0.0,监听本机所有ip
http.port: 9200 #释放
esyonghu@bogon \~$ cd /opt/elasticsearch-6.2.4/bin/
esyonghu@bogon bin$ ls elasticsearch
elasticsearch
esyonghu@bogon bin$ ./elasticsearch -d #后台启动es,或者先./ elasticsearch前台启动查看下是否能启动再后台启动
esyonghu@bogon bin$ tailf /opt/elasticsearch-6.2.4/logs/elasticsearch.log #查看启动日志,有时需要等会才能形成日志
.........
2019-10-12T21:27:15,635INFO o.e.c.s.ClusterApplierService koccs5f new_master {koccs5f}{koccs5fwSre801IprBSrzw}{A-z15PqtRByWA494KhVH_A}{192.168.171.128}{192.168.171.128:9300}, reason: apply cluster state (from master master {koccs5f}{koccs5fwSre801IprBSrzw}{A-z15PqtRByWA494KhVH_A}{192.168.171.128}{192.168.171.128:9300} committed version \[1 source zen-disco-elected-as-master (\[0 nodes joined)]])
2019-10-12T21:27:15,743INFO o.e.h.n.Netty4HttpServerTransport koccs5f publish_address {192.168.171.128:9200}, bound_addresses {192.168.171.128:9200}
2019-10-12T21:27:15,744INFO o.e.n.Node koccs5f started
2019-10-12T21:27:15,746INFO o.e.g.GatewayService koccs5f recovered 0 indices into cluster_state
esyonghu@bogon bin$ netstat -anput |grep 9200
有9200端口
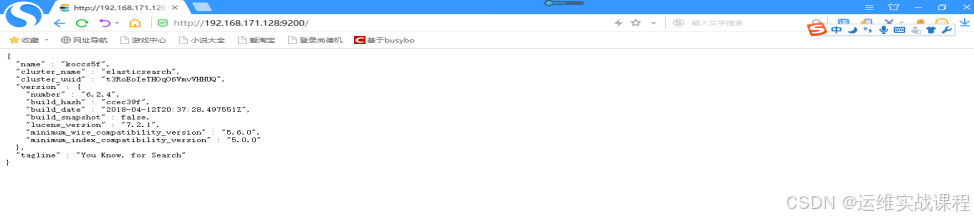
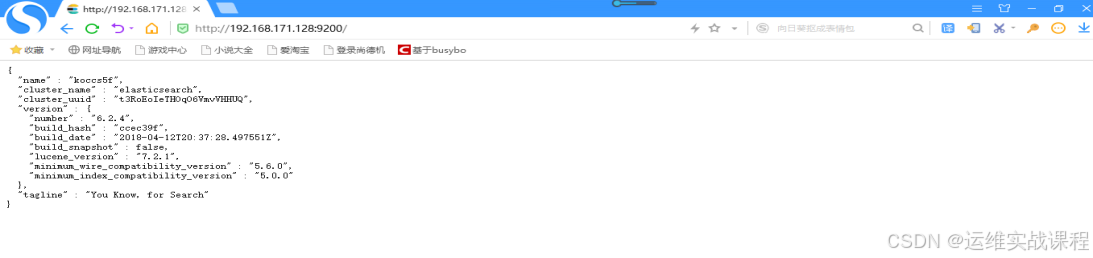
esyonghu@bogon bin$ curl http://192.168.171.128:9200
能访问es默认页面
客户端浏览器外网访问,如下:http://192.168.171.128:9200/
c)elasticsearch安装head插件:是es的一个客户端管理工具(es5.0版本后,head插件独立安装)
安装nodejs环境: (head插件会用到grunt,而grunt需要npm包管理器,所以需要安装nodejs环境)
另开一个窗口,用root用户,也可用其他用户
root@bogon \~# rz
上传nodejs包
root@bogon \~# ls
elasticsearch-6.2.4.tar.gz jdk-8u144-linux-x64.tar.gz node-v9.6.1-linux-x64.tar.xz
root@bogon \~# xz -d node-v9.6.1-linux-x64.tar.xz
root@bogon \~# ls
elasticsearch-6.2.4.tar.gz jdk-8u144-linux-x64.tar.gz node-v9.6.1-linux-x64.tar
root@bogon \~# tar -xf node-v9.6.1-linux-x64.tar
root@bogon \~# ls
elasticsearch-6.2.4.tar.gz jdk-8u144-linux-x64.tar.gz node-v9.6.1-linux-x64 node-v9.6.1-linux-x64.tar
root@bogon \~# mv node-v9.6.1-linux-x64 /opt/
root@bogon \~# ls /opt/node-v9.6.1-linux-x64/
bin CHANGELOG.md include lib LICENSE README.md share
root@bogon \~# export PATH=$PATH:/opt/node-v9.6.1-linux-x64/bin
root@bogon \~# echo "export PATH=$PATH:/opt/node-v9.6.1-linux-x64/bin" >> /etc/profile
root@bogon \~# tail -1 /etc/profile
export PATH=/usr/local/sbin:/usr/local/bin:/usr/sbin:/usr/bin:/root/bin:/opt/node-v9.6.1-linux-x64/bin:/opt/node-v9.6.1-linux-x64/bin
root@bogon \~# source /etc/profile
root@bogon \~# node -v
v9.6.1
root@bogon \~# npm -v
5.6.0
root@bogon \~# npm install -g grunt-cli #安装head插件依赖工具
root@bogon \~# grunt --version
grunt-cli v1.3.2
从github删下载head插件,也可先下载后,保留存起来
root@bogon \~# yum -y install git
root@bogon \~# git clone git://github.com/mobz/elasticsearch-head.git
root@bogon \~# ls
elasticsearch-6.2.4.tar.gz elasticsearch-head jdk-8u144-linux-x64.tar.gz node-v9.6.1-linux-x64.tar
root@bogon \~# mv elasticsearch-head/ /opt #移到/opt/elasticsearch-6.2.4/plugins/试验不行,新版可能不让在该目录下安装插件
root@bogon \~# ls /opt/
elasticsearch-6.2.4 elasticsearch-head node-v9.6.1-linux-x64
root@bogon \~# cd /opt/elasticsearch-head/
root@bogon elasticsearch-head# ls
Dockerfile Gruntfile.js LICENCE proxy src
Dockerfile-alpine grunt_fileSets.js package.json README.textile test
elasticsearch-head.sublime-project index.html plugin-descriptor.properties _site
更换npm源,安装cnpm命令,使用cnpm命令安装head插件
root@bogon elasticsearch-head# npm install -g cnpm --registry=https://registry.npm.taobao.org
root@bogon elasticsearch-head# cnpm install #使用cnpm安装
......下面有些报错,但是没影响
Error: post install error, please remove node_modules before retry!
Run "sh -c node install.js" error, exit code 1
at ChildProcess.proc.on.code (/opt/node-v9.6.1-linux-x64/lib/node_modules/cnpm/node_modules/runscript/index.js:74:21)
at ChildProcess.emit (events.js:127:13)
......
root@bogon elasticsearch-head# vim Gruntfile.js
......
connect: {
server: {
options: {
hostname: '*', #添加
port: 9100,
base: '.',
keepalive: true
}
}
}
root@bogon elasticsearch-head# vim _site/app.js
......
this.base_uri = this.config.base_uri || this.prefs.get("app-base_uri") || "http://192.168.171.128:9200"; #修改成本机ip
配置es允许跨域访问:(修改es的配置文件)
root@bogon elasticsearch-head# vim /opt/elasticsearch-6.2.4/config/elasticsearch.yml
#最后面添加两个下面的
http.cors.enabled: true #添加
http.cors.allow-origin: '*' #添加
wq
d)重新启动es服务: (可以在另一个普通用户的窗口)
esyonghu@bogon bin$ ps -ef |grep elasticsearch
查看进程号:1311
esyonghu@bogon bin$ kill -9 1311
esyonghu@bogon bin$ pwd
/opt/elasticsearch-6.2.4/bin
esyonghu@bogon bin$ ./elasticsearch -d
esyonghu@bogon bin$ tailf /opt/elasticsearch-6.2.4/logs/elasticsearch.log
esyonghu@bogon bin$ netstat -anput |grep 9200
有端口
e)启动es-head插件:(另一个终端,可以用root用户启动)
root@bogon elasticsearch-head# cd /opt/elasticsearch-head/node_modules/grunt/bin/
root@bogon bin# ls
grunt
root@bogon bin# ./grunt server & #启动head插件服务
.........
Running "connect:server" (connect) task
eWaiting forever...
Started connect web server on http://localhost:9100
root@bogon bin# netstat -anput |grep 9100
tcp6 0 0 :::9100 :::* LISTEN 2814/grunt
root@bogon bin# cd
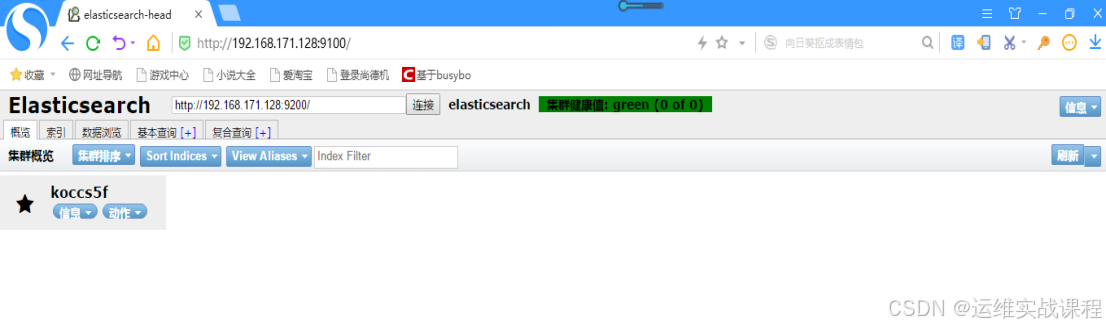
f)客户端浏览器访问:访问正常es和插件管理地址 http://192.168.171.128:9200/
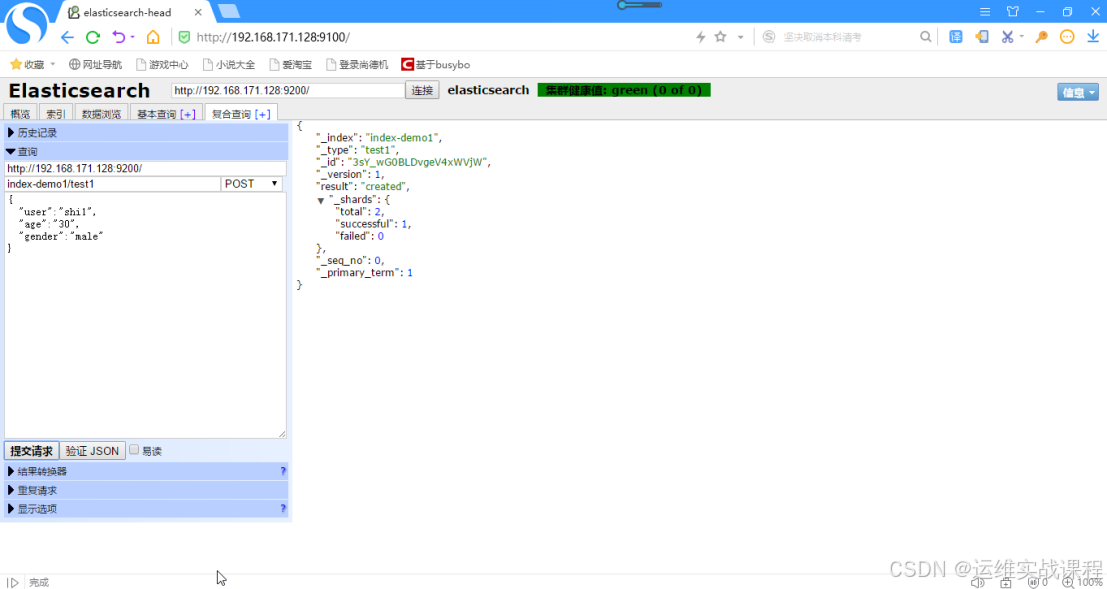
g)使用head插件管理工具,向elasticsearch服务里写些测试数据:
点击复合查询,如下:

删除默认的,写些测试数据,如下:
http://192.168.171.128:9200/ #默认的地址,注意:最后一个/不能去掉
index-demo1/test1 #这些都是手动自定义的,创建后,形成的索引名(数据库名)就是:index-demo1,类型(表)是:test1,注:index-...前面不能有/,
数据:
{
"user":"shi1",
"age":"30",
"gender":"male"
}
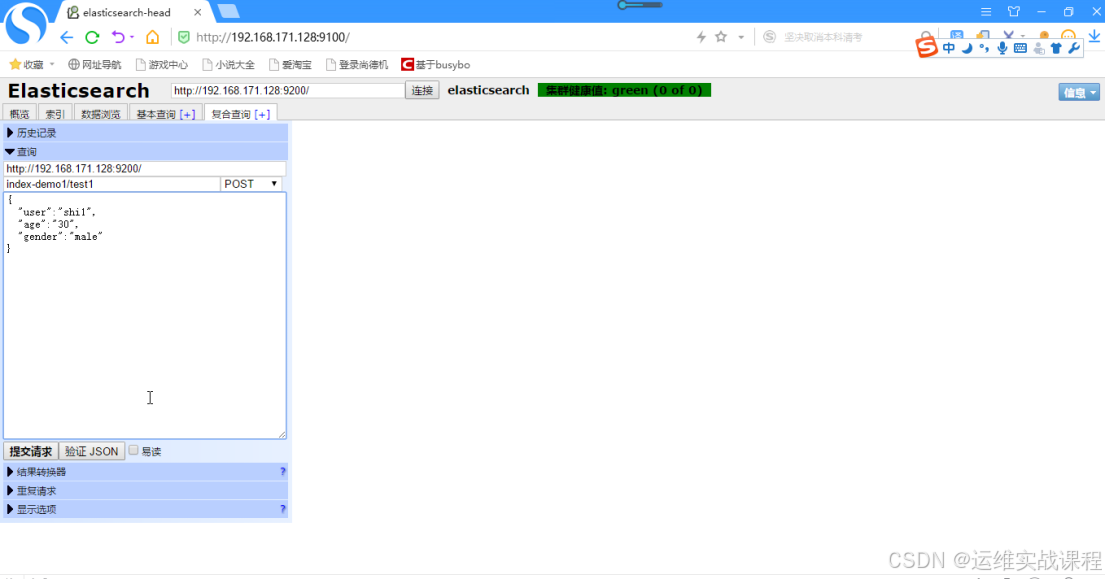
点击提交请求,如下
以此为例,再建立一些数据,点击数据浏览后,可查询数据,如下:
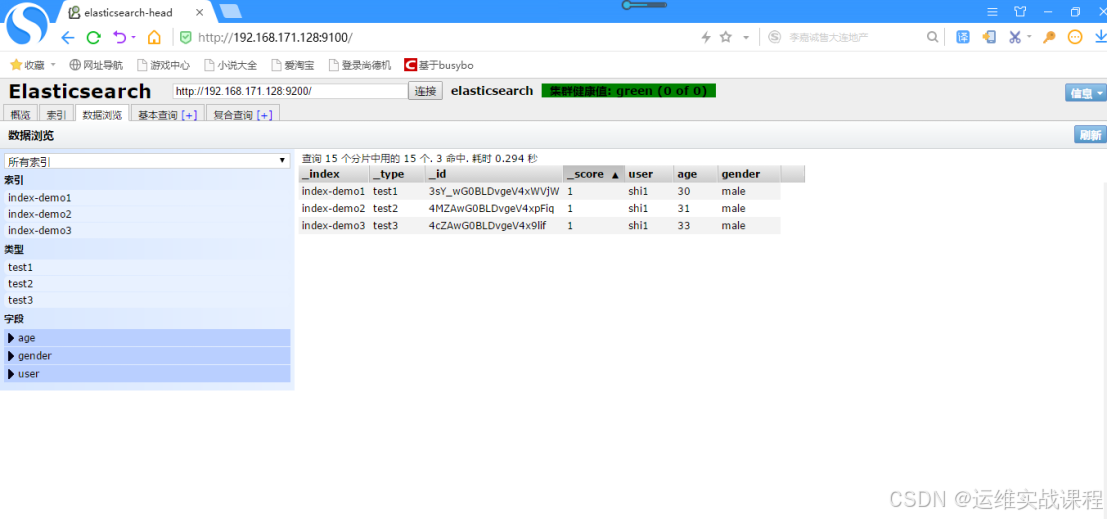
elasticsearch搭建完毕。
2 ) 在192.168.171.129上: 安装 logstash6.2.4 +准备准备的nginx日志文件 : ( 版本要和es版本相同,是日志搜集服务,搜集日志后可写入es )
a)安装logstash1 6.2.4(需要jdk环境)
root@bogon \~# mkdir /usr/local/java
root@bogon \~# rz
上传jdk1.8包
root@bogon \~# ls
jdk-8u144-linux-x64.tar.gz
root@bogon \~# tar -zxf jdk-8u144-linux-x64.tar.gz
root@bogon \~# ls
jdk1.8.0_144 jdk-8u144-linux-x64.tar.gz
root@bogon \~# mv jdk1.8.0_144/ /usr/local/java/
root@bogon \~# ls /usr/local/java/
jdk1.8.0_144
root@bogon \~# vim /etc/profile
#最后面添加:
JAVA_HOME=/usr/local/java/jdk1.8.0_144
CLASSPATH=.:JAVA_HOME/jre/lib/rt.jar:JAVA_HOME/lib/dt.jar:$JAVA_HOME/lib/tools.jar
PATH=JAVA_HOME/bin:PATH
export JAVA_HOME CLASSPATH PATH
root@bogon \~# source /etc/profile
root@bogon \~# java -version
java version "1.8.0_144"
Java(TM) SE Runtime Environment (build 1.8.0_144-b01)
Java HotSpot(TM) 64-Bit Server VM (build 25.144-b01, mixed mode)
root@bogon \~# rz
上传logstash包
root@bogon \~# ls
jdk-8u144-linux-x64.tar.gz logstash-6.2.4.tar.gz
root@bogon \~# tar -zxf logstash-6.2.4.tar.gz
root@bogon \~# mv logstash-6.2.4 /opt/
root@bogon \~# ls /opt/
elasticsearch-6.2.4 elasticsearch-head logstash-6.2.4 node-v9.6.1-linux-x64
root@bogon \~# ls /opt/logstash-6.2.4/
bin CONTRIBUTORS Gemfile lib logstash-core modules tools
config data Gemfile.lock LICENSE logstash-core-plugin-api NOTICE.TXT vendor
root@bogon \~# ls /opt/logstash-6.2.4/bin/logstash
/opt/logstash-6.2.4/bin/logstash
root@bogon \~# cd /opt/logstash-6.2.4/
root@bogon logstash-6.2.4# ls
bin CONTRIBUTORS Gemfile lib logstash-core modules tools
config data Gemfile.lock LICENSE logstash-core-plugin-api NOTICE.TXT vendor
root@bogon \~# export PATH=$PATH:/opt/logstash-6.2.4/bin
root@bogon \~# echo "PATH=$PATH:/opt/logstash-6.2.4/bin" >> /etc/profile
root@bogon \~# source /etc/profile
root@bogon \~# logstash -V
logstash 6.2.4
logstash安装完毕,启动时候,可以先创建配置文件,然后指定配置文件启动,配置文件位置在哪都行,启动时候能找到就行,内容也是自己定义写的内容。
b)安装nginx
root@bogon \~# yum -y install gcc gcc-c++
root@bogon \~# yum -y install openssl-devel openssl zlib zlib-devel pcre pcre-devel
root@bogon \~# rz
上传nginx包
root@bogon \~# ls nginx-1.6.2.tar.gz
nginx-1.6.2.tar.gz
root@bogon \~# tar -zxf nginx-1.6.2.tar.gz
root@bogon \~# cd nginx-1.6.2
root@bogon nginx-1.6.2# ls
auto CHANGES CHANGES.ru conf configure contrib html LICENSE man README src
root@bogon nginx-1.6.2# useradd -s /sbin/nologin -M nginx
root@bogon nginx-1.6.2# ./configure --user=nginx --group=nginx --prefix=/usr/local/nginx --with-http_stub_status_module --with-http_ssl_module
root@bogon nginx-1.6.2# make && make install
root@bogon nginx-1.6.2# ls /usr/local/nginx/
conf html logs sbin
root@bogon nginx-1.6.2# /usr/local/nginx/sbin/nginx -t
nginx: the configuration file /usr/local/nginx/conf/nginx.conf syntax is ok
nginx: configuration file /usr/local/nginx/conf/nginx.conf test is successful
root@bogon nginx-1.6.2# /usr/local/nginx/sbin/nginx
root@bogon nginx-1.6.2# netstat -anput |grep 80
tcp 0 0 0.0.0.0:80 0.0.0.0:* LISTEN 15918/nginx: master
root@localhost nginx-1.6.2# cd
root@bogon \~# vim /usr/local/nginx/conf/nginx.conf
.......
#下面是在http模块添加:
log_format json '{ "@timestamp": "$time_iso8601", '
'"remote_addr": "$remote_addr", '
'"remote_user": "$remote_user", '
'"body_bytes_sent": "$body_bytes_sent", '
'"request_time": "$request_time", '
'"status": "$status", '
'"request_uri": "$request_uri", '
'"request_method": "$request_method", '
'"http_referrer": "$http_referer", '
'"http_x_forwarded_for": "$http_x_forwarded_for", '
'"http_user_agent": "$http_user_agent"}';
access_log logs/access.log json;
.........
root@bogon \~# /usr/local/nginx/sbin/nginx -t
nginx: the configuration file /usr/local/nginx/conf/nginx.conf syntax is ok
nginx: configuration file /usr/local/nginx/conf/nginx.conf test is successful
root@bogon \~# /usr/local/nginx/sbin/nginx -s reload
root@bogon \~# netstat -anput |grep 80
tcp 0 0 0.0.0.0:80 0.0.0.0:* LISTEN 1885/nginx: master
访问产生访问日志:
root@bogon \~# curl 127.0.0.1
root@bogon \~# curl 127.0.0.1
root@bogon \~# curl 127.0.0.1
root@bogon \~# curl 127.0.0.1
root@bogon \~# curl 127.0.0.1
root@bogon \~# cat /usr/local/nginx/logs/access.log
{ "@timestamp": "2019-10-14T18:44:30+08:00", "remote_addr": "127.0.0.1", "remote_user": "-", "body_bytes_sent": "612", "request_time": "0.000", "status": "200", "request_uri": "/", "request_method": "GET", "http_referrer": "-", "http_x_forwarded_for": "-", "http_user_agent": "curl/7.29.0"}
{ "@timestamp": "2019-10-14T18:44:31+08:00", "remote_addr": "127.0.0.1", "remote_user": "-", "body_bytes_sent": "612", "request_time": "0.000", "status": "200", "request_uri": "/", "request_method": "GET", "http_referrer": "-", "http_x_forwarded_for": "-", "http_user_agent": "curl/7.29.0"}
{ "@timestamp": "2019-10-14T18:44:32+08:00", "remote_addr": "127.0.0.1", "remote_user": "-", "body_bytes_sent": "612", "request_time": "0.000", "status": "200", "request_uri": "/", "request_method": "GET", "http_referrer": "-", "http_x_forwarded_for": "-", "http_user_agent": "curl/7.29.0"}
{ "@timestamp": "2019-10-14T18:44:33+08:00", "remote_addr": "127.0.0.1", "remote_user": "-", "body_bytes_sent": "612", "request_time": "0.000", "status": "200", "request_uri": "/", "request_method": "GET", "http_referrer": "-", "http_x_forwarded_for": "-", "http_user_agent": "curl/7.29.0"}
{ "@timestamp": "2019-10-14T18:44:33+08:00", "remote_addr": "127.0.0.1", "remote_user": "-", "body_bytes_sent": "612", "request_time": "0.000", "status": "200", "request_uri": "/", "request_method": "GET", "http_referrer": "-", "http_x_forwarded_for": "-", "http_user_agent": "curl/7.29.0"}
root@bogon \~# vim /usr/local/nginx/logs/access.log #修改一下日志文件,将ip改成外网,能分析地理位置的ip
{ "@timestamp": "2019-10-14T18:40:30+08:00", "remote_addr": "103.216.43.11", "remote_user": "-", "body_bytes_sent": "612", "request_time": "0.001", "status": "304", "request_uri": "/", "request_method": "GET", "http_referrer": "-", "http_x_forwarded_for": "-", "http_user_agent": "curl/7.29.0"}
{ "@timestamp": "2019-10-14T18:41:31+08:00", "remote_addr": "103.216.43.11", "remote_user": "-", "body_bytes_sent": "612", "request_time": "0.002", "status": "200", "request_uri": "/", "request_method": "GET", "http_referrer": "-", "http_x_forwarded_for": "-", "http_user_agent": "curl/7.29.0"}
{ "@timestamp": "2019-10-14T18:42:32+08:00", "remote_addr": "103.216.43.11", "remote_user": "-", "body_bytes_sent": "612", "request_time": "0.003", "status": "500", "request_uri": "/", "request_method": "GET", "http_referrer": "-", "http_x_forwarded_for": "-", "http_user_agent": "curl/7.29.0"}
{ "@timestamp": "2019-10-14T18:43:33+08:00", "remote_addr": "103.216.43.11", "remote_user": "-", "body_bytes_sent": "612", "request_time": "0.004", "status": "200", "request_uri": "/", "request_method": "GET", "http_referrer": "-", "http_x_forwarded_for": "-", "http_user_agent": "curl/7.29.0"}
{ "@timestamp": "2019-10-14T18:44:33+08:00", "remote_addr": "103.216.43.113", "remote_user": "-", "body_bytes_sent": "612", "request_time": "0.005", "status": "403", "request_uri": "/", "request_method": "GET", "http_referrer": "-", "http_x_forwarded_for": "-", "http_user_agent": "curl/7.29.0"}
{ "@timestamp": "2019-10-14T18:45:33+08:00", "remote_addr": "103.216.43.113", "remote_user": "-", "body_bytes_sent": "612", "request_time": "0.006", "status": "200", "request_uri": "/", "request_method": "GET", "http_referrer": "-", "http_x_forwarded_for": "-", "http_user_agent": "curl/7.29.0"}
{ "@timestamp": "2019-10-14T18:46:33+08:00", "remote_addr": "103.216.43.113", "remote_user": "-", "body_bytes_sent": "612", "request_time": "0.007", "status": "201", "request_uri": "/", "request_method": "GET", "http_referrer": "-", "http_x_forwarded_for": "-", "http_user_agent": "curl/7.29.0"}
{ "@timestamp": "2019-10-14T18:47:33+08:00", "remote_addr": "105.216.43.12", "remote_user": "-", "body_bytes_sent": "612", "request_time": "0.008", "status": "200", "request_uri": "/", "request_method": "GET", "http_referrer": "-", "http_x_forwarded_for": "-", "http_user_agent": "curl/7.29.0"}
{ "@timestamp": "2019-10-14T18:48:33+08:00", "remote_addr": "105.216.43.12", "remote_user": "-", "body_bytes_sent": "612", "request_time": "0.008", "status": "206", "request_uri": "/", "request_method": "GET", "http_referrer": "-", "http_x_forwarded_for": "-", "http_user_agent": "curl/7.29.0"}
{ "@timestamp": "2019-10-14T18:49:33+08:00", "remote_addr": "104.216.43.11", "remote_user": "-", "body_bytes_sent": "612", "request_time": "0.009", "status": "200", "request_uri": "/", "request_method": "GET", "http_referrer": "-", "http_x_forwarded_for": "-", "http_user_agent": "curl/7.29.0"}
3 ) 在192.168.171.130上: 安装kibana和nginx,nginx配置,使得kibana能用用户登录认证。
a)安装kibana6.2.4(不需要java环境),自身不支持认证登录,需要配合nginx
root@bogon \~# rz
上传kibana包
root@bogon \~# ls kibana-6.2.4-linux-x86_64.tar.gz
kibana-6.2.4-linux-x86_64.tar.gz
root@bogon \~# tar zxf kibana-6.2.4-linux-x86_64.tar.gz
root@bogon \~# ls
01-logstash.conf jdk-8u144-linux-x64.tar.gz kibana-6.2.4-linux-x86_64.tar.gz node-v9.6.1-linux-x64.tar test_multiline.conf
elasticsearch-6.2.4.tar.gz kibana-6.2.4-linux-x86_64 logstash-6.2.4.tar.gz sys-java-log.conf
root@bogon \~# mv kibana-6.2.4-linux-x86_64 /opt/
root@bogon \~# ls /opt/
elasticsearch-6.2.4 elasticsearch-head kibana-6.2.4-linux-x86_64 logstash-6.2.4 node-v9.6.1-linux-x64
root@bogon \~# cd /opt/kibana-6.2.4-linux-x86_64/
root@bogon kibana-6.2.4-linux-x86_64# ls
bin config data LICENSE.txt node node_modules NOTICE.txt optimize package.json plugins README.txt src ui_framework webpackShims
root@bogon kibana-6.2.4-linux-x86_64# vim config/kibana.yml
server.port: 5601 #本身的服务端口5601默认
server.host: "0.0.0.0" #监听本机所有ip
elasticsearch.url: "http://192.168.171.128:9200" #连接es,从es获取数据
kibana.index: ".kibana" #kibana的索引,
wq
root@bogon kibana-6.2.4-linux-x86_64# cd bin/
root@bogon bin# ls
kibana kibana-keystore kibana-plugin
root@bogon bin# ./kibana & #后台运行kibana
2 13186
root@bogon bin# log 07:18:24.849 infostatusplugin:kibana@6.2.4 Status changed from uninitialized to green - Ready
log 07:18:24.904 infostatusplugin:elasticsearch@6.2.4 Status changed from uninitialized to yellow - Waiting for Elasticsearch
log 07:18:25.062 infostatusplugin:timelion@6.2.4 Status changed from uninitialized to green - Ready
log 07:18:25.071 infostatusplugin:console@6.2.4 Status changed from uninitialized to green - Ready
log 07:18:25.079 infostatusplugin:metrics@6.2.4 Status changed from uninitialized to green - Ready
log 07:18:25.106 infolistening Server running at http://0.0.0.0:5601
log 07:18:25.152 infostatusplugin:elasticsearch@6.2.4 Status changed from yellow to green - Ready
root@bogon bin# netstat -anput |grep 5601
tcp 0 0 0.0.0.0:5601 0.0.0.0:* LISTEN 13186/./../node/bin
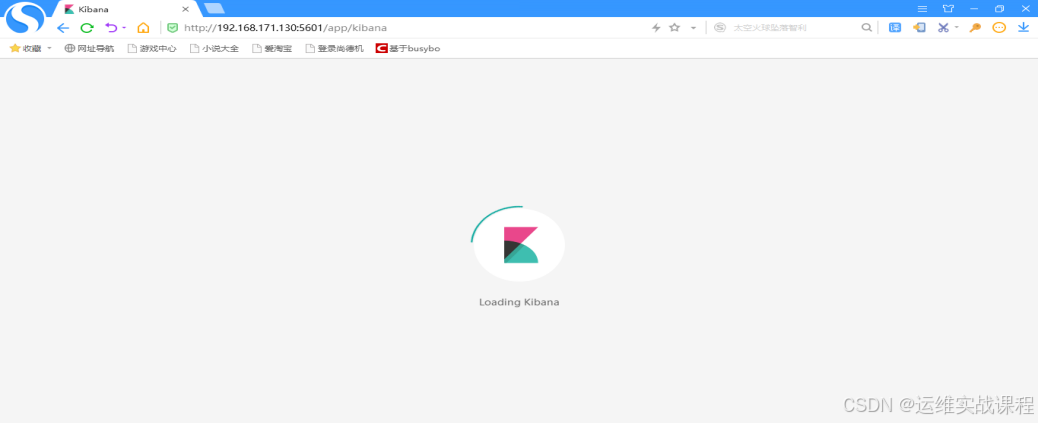
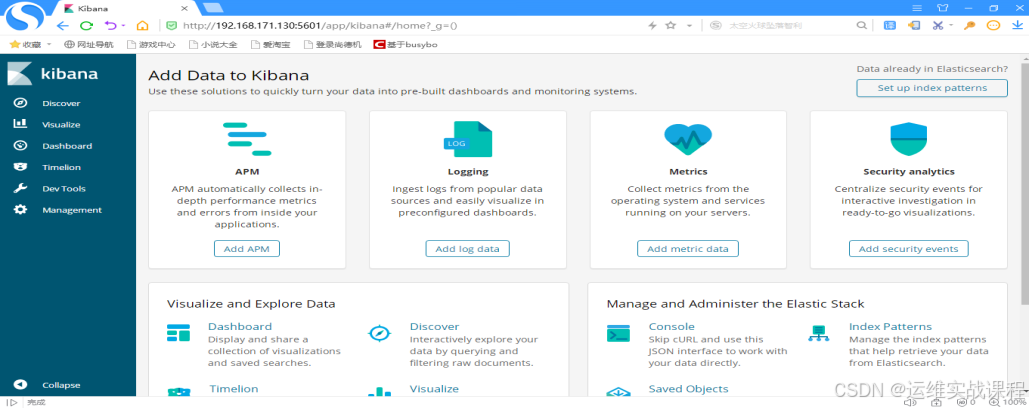
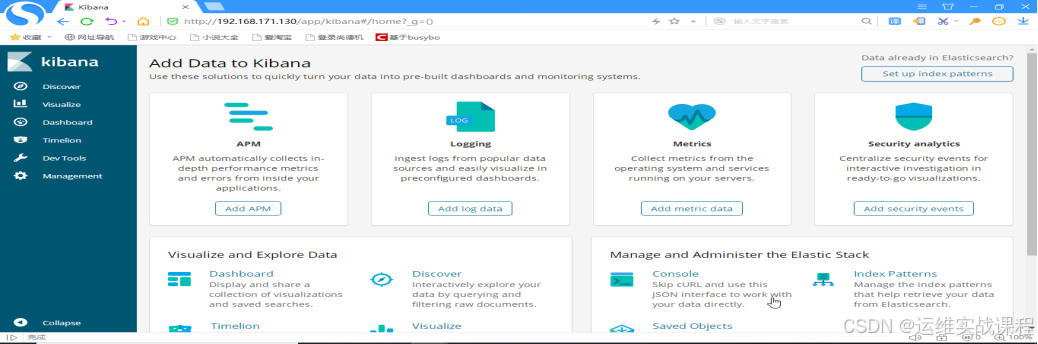
浏览器直接访问kibana界面:http://192.168.171.130:5601 回车后直接就能登录进来,如下:
b)安装nginx,并配置结合kibana,能让kibana通过使用用户和密码认证登录。
root@bogon \~# yum -y install gcc gcc-c++
root@bogon \~# yum -y install openssl-devel openssl zlib zlib-devel pcre pcre-devel
root@bogon \~# rz
上传nginx包
root@bogon \~# ls nginx-1.6.2.tar.gz
nginx-1.6.2.tar.gz
root@bogon \~# tar -zxf nginx-1.6.2.tar.gz
root@bogon \~# cd nginx-1.6.2
root@bogon nginx-1.6.2# ls
auto CHANGES CHANGES.ru conf configure contrib html LICENSE man README src
root@bogon nginx-1.6.2# useradd -s /sbin/nologin -M nginx
root@bogon nginx-1.6.2# ./configure --user=nginx --group=nginx --prefix=/usr/local/nginx --with-http_stub_status_module --with-http_ssl_module
root@bogon nginx-1.6.2# make && make install
root@bogon nginx-1.6.2# ls /usr/local/nginx/
conf html logs sbin
root@bogon nginx-1.6.2# /usr/local/nginx/sbin/nginx -t
nginx: the configuration file /usr/local/nginx/conf/nginx.conf syntax is ok
nginx: configuration file /usr/local/nginx/conf/nginx.conf test is successful
root@bogon nginx-1.6.2# /usr/local/nginx/sbin/nginx
root@bogon nginx-1.6.2# netstat -anput |grep 80
tcp 0 0 0.0.0.0:80 0.0.0.0:* LISTEN 15918/nginx: master
root@localhost nginx-1.6.2# cd
root@localhost \~# vim /usr/local/nginx/conf/nginx.conf
.......
server {
listen 80;
server_name localhost;
location / {
root html;
index index.html index.htm;
auth_basic "Please input user and password"; #添加
auth_basic_user_file /usr/local/nginx/conf/passwd.db; #添加
proxy_pass http://192.168.171.130:5601; #添加
}
}
.........
root@localhost \~# openssl passwd -crypt 123456 #将明文密码进行加密,然后将加密内容写入密码文件
3KWv9TAdX4Qx2
root@localhost \~# vim /usr/local/nginx/conf/passwd.db
shi:3KWv9TAdX4Qx2
root@localhost \~# /usr/local/nginx/sbin/nginx -s reload
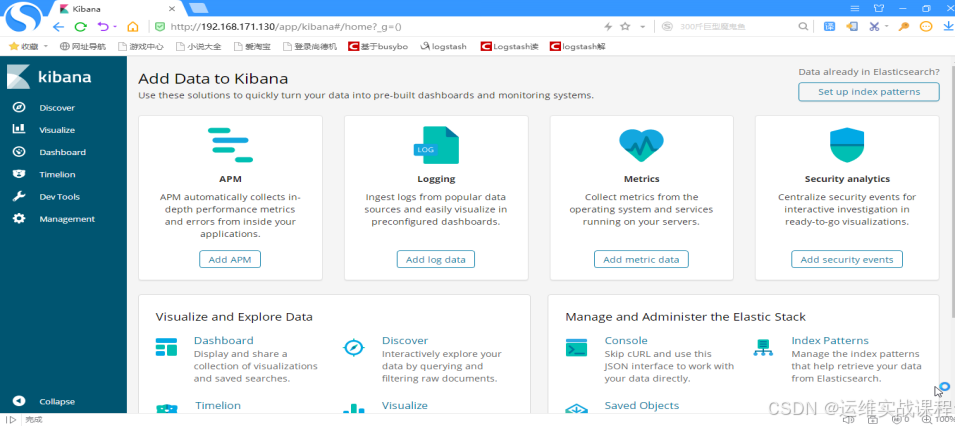
浏览器通过访问nginx访问kibana界面:http://192.168.171.130 回车后,需要输入用户名和密码: shi/123456

确定后,才能登录,如下:
4) r edis 机器: 在 1 92.168. 171.131上安装redis(redis密码:123)和logstash2服务
a)安装redis
root@bogon \~# yum -y install epel-release
root@bogon \~# yum -y install redis
root@bogon \~# vim /etc/redis.conf
daemonize yes
bind 0.0.0.0 #默认绑定127.0.0.1,客户端没权限连接,修改成0.0.0.0后,客户端和本地都能连接redis
port 6379
requirepass 123
root@bogon \~# systemctl start redis
root@bogon \~# systemctl enable redis
root@bogon \~# netstat -anput |grep 6379
tcp 0 0 127.0.0.1:6379 0.0.0.0:* LISTEN 1643/redis-server 1
root@bogon \~# redis-cli -a 123
127.0.0.1:6379> set k1 v1
OK
127.0.0.1:6379> get k1
"v1"
127.0.0.1:6379> quit
b)安装logstash2 6.2.4(需要jdk环境)
root@bogon \~# mkdir /usr/local/java
root@bogon \~# rz
上传jdk1.8包
root@bogon \~# ls
jdk-8u144-linux-x64.tar.gz
root@bogon \~# tar -zxf jdk-8u144-linux-x64.tar.gz
root@bogon \~# ls
jdk1.8.0_144 jdk-8u144-linux-x64.tar.gz
root@bogon \~# mv jdk1.8.0_144/ /usr/local/java/
root@bogon \~# ls /usr/local/java/
jdk1.8.0_144
root@bogon \~# vim /etc/profile
#最后面添加:
JAVA_HOME=/usr/local/java/jdk1.8.0_144
CLASSPATH=.:JAVA_HOME/jre/lib/rt.jar:JAVA_HOME/lib/dt.jar:$JAVA_HOME/lib/tools.jar
PATH=JAVA_HOME/bin:PATH
export JAVA_HOME CLASSPATH PATH
root@bogon \~# source /etc/profile
root@bogon \~# java -version
java version "1.8.0_144"
Java(TM) SE Runtime Environment (build 1.8.0_144-b01)
Java HotSpot(TM) 64-Bit Server VM (build 25.144-b01, mixed mode)
root@bogon \~# rz
上传logstash包
root@bogon \~# ls
jdk-8u144-linux-x64.tar.gz logstash-6.2.4.tar.gz
root@bogon \~# tar -zxf logstash-6.2.4.tar.gz
root@bogon \~# mv logstash-6.2.4 /opt/
root@bogon \~# ls /opt/
elasticsearch-6.2.4 elasticsearch-head logstash-6.2.4 node-v9.6.1-linux-x64
root@bogon \~# ls /opt/logstash-6.2.4/
bin CONTRIBUTORS Gemfile lib logstash-core modules tools
config data Gemfile.lock LICENSE logstash-core-plugin-api NOTICE.TXT vendor
root@bogon \~# ls /opt/logstash-6.2.4/bin/logstash
/opt/logstash-6.2.4/bin/logstash
root@bogon \~# cd /opt/logstash-6.2.4/
root@bogon logstash-6.2.4# ls
bin CONTRIBUTORS Gemfile lib logstash-core modules tools
config data Gemfile.lock LICENSE logstash-core-plugin-api NOTICE.TXT vendor
root@bogon logstash-6.2.4# cd
root@bogon \~# export PATH=$PATH:/opt/logstash-6.2.4/bin
root@bogon \~# echo "PATH=$PATH:/opt/logstash-6.2.4/bin" >> /etc/profile
root@bogon \~# source /etc/profile
root@bogon \~# logstash -V
logstash 6.2.4
logstash安装完毕,启动时候,可以先创建配置文件,然后指定配置文件启动,配置文件位置在哪都行,启动时候能找到就行,内容也是自己定义写的内容。
5)在 1 92.168. 171.129上启动logstash1服务,将本地的nginx日志文件收集并写入elk中------多行匹配(各种类型,不同情况使用不同正则,根据实际情况使用正则)
a)通过nginx服务制造点日志,如下:(以日期开头的为一条,一共5条,如下)(以其中一种类型的日志类型,匹配正则为例,其他根据情况)
一定注意:下面日志不能提前生成,需要先启动filebeat开始收集后,在vim编写下面的日志,否则filebeat不能读取已经有的日志.
root@bogon \~# cat /usr/local/nginx/logs/access.log #修改一下日志文件,将ip改成外网,能分析地理位置的ip
{ "@timestamp": "2019-10-14T18:40:30+08:00", "remote_addr": "103.216.43.11", "remote_user": "-", "body_bytes_sent": "612", "request_time": "0.001", "status": "304", "request_uri": "/", "request_method": "GET", "http_referrer": "-", "http_x_forwarded_for": "-", "http_user_agent": "curl/7.29.0"}
{ "@timestamp": "2019-10-14T18:41:31+08:00", "remote_addr": "103.216.43.11", "remote_user": "-", "body_bytes_sent": "612", "request_time": "0.002", "status": "200", "request_uri": "/", "request_method": "GET", "http_referrer": "-", "http_x_forwarded_for": "-", "http_user_agent": "curl/7.29.0"}
{ "@timestamp": "2019-10-14T18:42:32+08:00", "remote_addr": "103.216.43.11", "remote_user": "-", "body_bytes_sent": "612", "request_time": "0.003", "status": "500", "request_uri": "/", "request_method": "GET", "http_referrer": "-", "http_x_forwarded_for": "-", "http_user_agent": "curl/7.29.0"}
{ "@timestamp": "2019-10-14T18:43:33+08:00", "remote_addr": "103.216.43.11", "remote_user": "-", "body_bytes_sent": "612", "request_time": "0.004", "status": "200", "request_uri": "/", "request_method": "GET", "http_referrer": "-", "http_x_forwarded_for": "-", "http_user_agent": "curl/7.29.0"}
{ "@timestamp": "2019-10-14T18:44:33+08:00", "remote_addr": "103.216.43.113", "remote_user": "-", "body_bytes_sent": "612", "request_time": "0.005", "status": "403", "request_uri": "/", "request_method": "GET", "http_referrer": "-", "http_x_forwarded_for": "-", "http_user_agent": "curl/7.29.0"}
{ "@timestamp": "2019-10-14T18:45:33+08:00", "remote_addr": "103.216.43.113", "remote_user": "-", "body_bytes_sent": "612", "request_time": "0.006", "status": "200", "request_uri": "/", "request_method": "GET", "http_referrer": "-", "http_x_forwarded_for": "-", "http_user_agent": "curl/7.29.0"}
{ "@timestamp": "2019-10-14T18:46:33+08:00", "remote_addr": "103.216.43.113", "remote_user": "-", "body_bytes_sent": "612", "request_time": "0.007", "status": "201", "request_uri": "/", "request_method": "GET", "http_referrer": "-", "http_x_forwarded_for": "-", "http_user_agent": "curl/7.29.0"}
{ "@timestamp": "2019-10-14T18:47:33+08:00", "remote_addr": "105.216.43.12", "remote_user": "-", "body_bytes_sent": "612", "request_time": "0.008", "status": "200", "request_uri": "/", "request_method": "GET", "http_referrer": "-", "http_x_forwarded_for": "-", "http_user_agent": "curl/7.29.0"}
{ "@timestamp": "2019-10-14T18:48:33+08:00", "remote_addr": "105.216.43.12", "remote_user": "-", "body_bytes_sent": "612", "request_time": "0.008", "status": "206", "request_uri": "/", "request_method": "GET", "http_referrer": "-", "http_x_forwarded_for": "-", "http_user_agent": "curl/7.29.0"}
{ "@timestamp": "2019-10-14T18:49:33+08:00", "remote_addr": "104.216.43.11", "remote_user": "-", "body_bytes_sent": "612", "request_time": "0.009", "status": "200", "request_uri": "/", "request_method": "GET", "http_referrer": "-", "http_x_forwarded_for": "-", "http_user_agent": "curl/7.29.0"}
b)logstash1服务将本地系统日志和tomcat日志收集,并写入redis:
root@bogon conf# cat nginx_out_redis_in.conf
input {
file {
path => "/usr/local/nginx/logs/access.log"
codec => "json"
start_position => "beginning"
type => "nginx-log"
}
}
#收集nginx日志,最好先将nginx的日志格式修改成json格式,容易收集展示
#codec => "json": 将nginx日志转成json格式后,才能用该插件,简单方便
output {
if type == "nginx-log" {
redis {
host => "192.168.171.131"
port => "6379"
password => "123"
db => "6"
data_type => "list"
key => "nginx-log"
}
}
stdout{codec => rubydebug }
#codec => rubydebug是调试,输出到控制台
}
#注意db => 6是随便选择了redis里的一个数据库,也可其他,0,1,2,..
root@bogon conf# logstash -f nginx_out_redis_in.conf #启动logstash1服务,开始收集日志,写入redis
先启动logstash1服务,然后vim,将日志写入各自文件,logstash1会自动搜集后,存入redis,上面安装时候已配置好。
启动后,在vim编辑产生日志,然后才能到redis中。
写入到redis后,到redis机器查看(192.168.171.131上):
root@bogon \~# redis-cli -h 192.168.171.131 -a 123
192.168.171.131:6379> select 6
OK
- "nginx-log"
127.0.0.1:63796> LLEN nginx-log
(integer) 10
127.0.0.1:63796> quit
c)在192.168.171.131上编写logstash配置文件,启动时候,从redis机器读出来各种类型日志,并写入es机器:
安装供分析地理位置的数据库文件:
root@bogon \~# ls GeoLite2-City.tar.gz
GeoLite2-City.tar.gz
root@bogon \~# tar -zxf GeoLite2-City.tar.gz
root@bogon \~# ls GeoLite2-City_20191008/
COPYRIGHT.txt GeoLite2-City.mmdb LICENSE.txt README.txt
root@bogon \~# cp -a GeoLite2-City_20191008/GeoLite2-City.mmdb /opt/
root@bogon \~# ls /opt/GeoLite2-City.mmdb
/opt/GeoLite2-City.mmdb
root@bogon \~# cd conf/
root@bogon conf# vim nginx_redis_out_es_in.conf
input {
redis {
type => "nginx-log"
host => "192.168.171.131"
port => "6379"
password => "123"
db => "6"
data_type => "list"
key => "nginx-log"
}
}
#默认target是@timestamp,所以time_local会更新@timestamp时间。下面filter的date插件作用: 当第一次收集或使用缓存写入时候,会发现入库时间比日志实际时间有延时,导致时间不准确,最好加入date插件,使得>入库时间和日志实际时间保持一致.
filter {
json {
source => "message"
remove_field => "message"
}
geoip {
source => "remote_addr"
target => "geoip"
database => "/opt/GeoLite2-City.mmdb"
add_field => "\[geoipcoordinates", "%{geoiplongitude}"]
add_field => "\[geoipcoordinates", "%{geoiplatitude}"]
}
mutate {
convert => "\[geoipcoordinates", "float"]
}
#date {
locale => "en"
match => "time_local", "dd/MMM/yyyy:HH:mm:ss Z"
#}
#上面因为nginx配置文件配置成json格式时候,已经覆盖了入库时间,已经和日志实际时间保持了一致,所以上面date可以不用
}
output {
if type == "nginx-log" {
elasticsearch {
hosts => "192.168.171.128:9200"
index => "logstash-nginx-access-log-%{+YYYY.MM.dd}"
}
}
stdout { codec=> rubydebug }
#codec=> rubydebug 是调试,输出到控制台
#写入es的索引名最好以logstash开头,因为创建map地理位置图表时候,如果不是以logstash开头,创建不了,其他也可能有这种情况,尽量都这么做吧
}
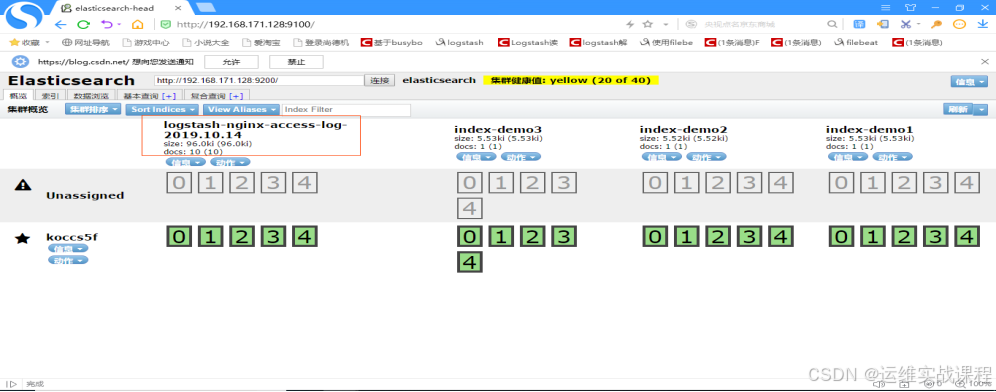
root@bogon conf# logstash -f nginx_redis_out_es_in.conf #启动logstash服务,将redis数据写入es
到es机器查看,有写入的数据,并创建了索引:http://192.168.171.128:9100
6)在 1 92.168. 171.130上访问nginx代理的kibana,并配置kibana界面展示日志(从es中获取数据并展示)
a)登录kibana,输入用户名和密码: shi/123456
b)kibana依次创建索引(尽量和es里索引名对应,方便查找)------查询和展示es里的数据
先创建-*索引:
点击management,如下:
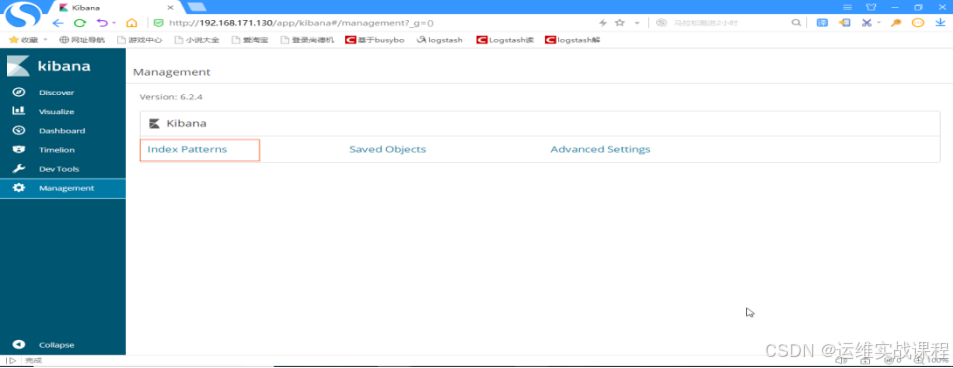
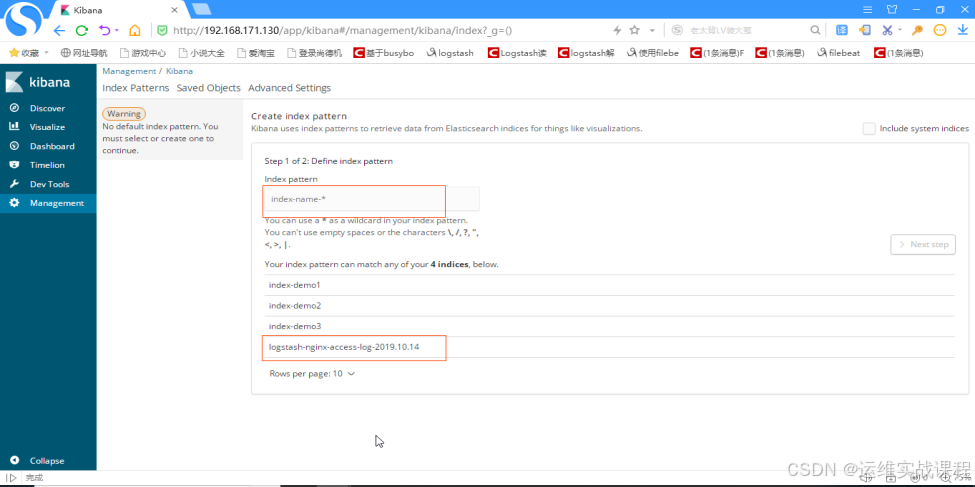
logstash-nginx-access-log-*,如下:
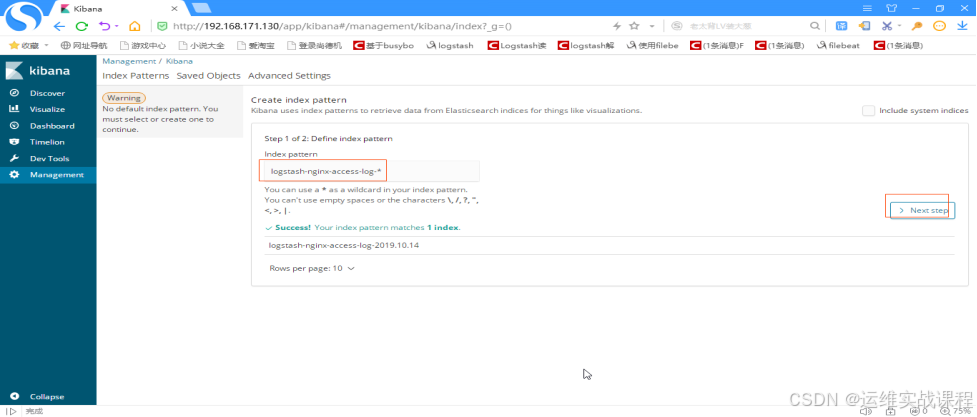
点击next step,如下:
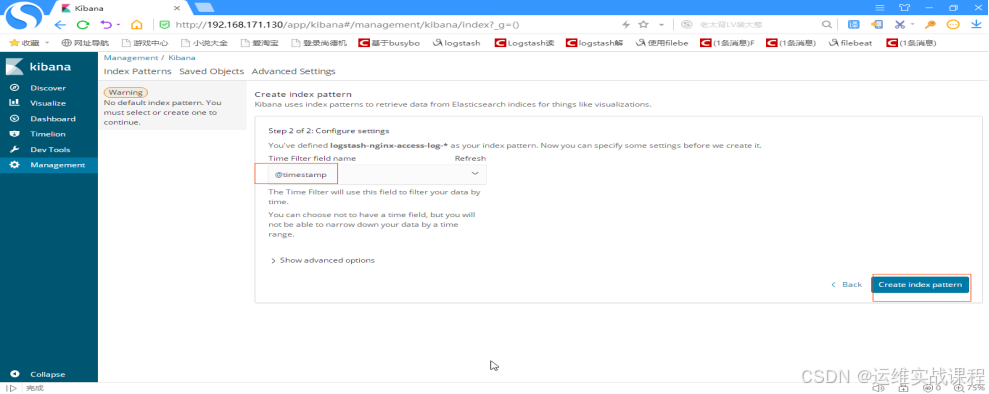
选择时间戳 @timestamp,点击create index pattern,如下:
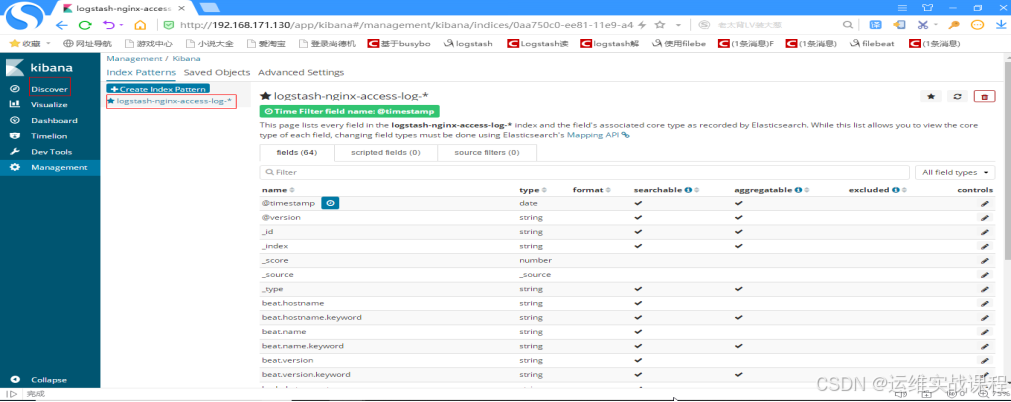
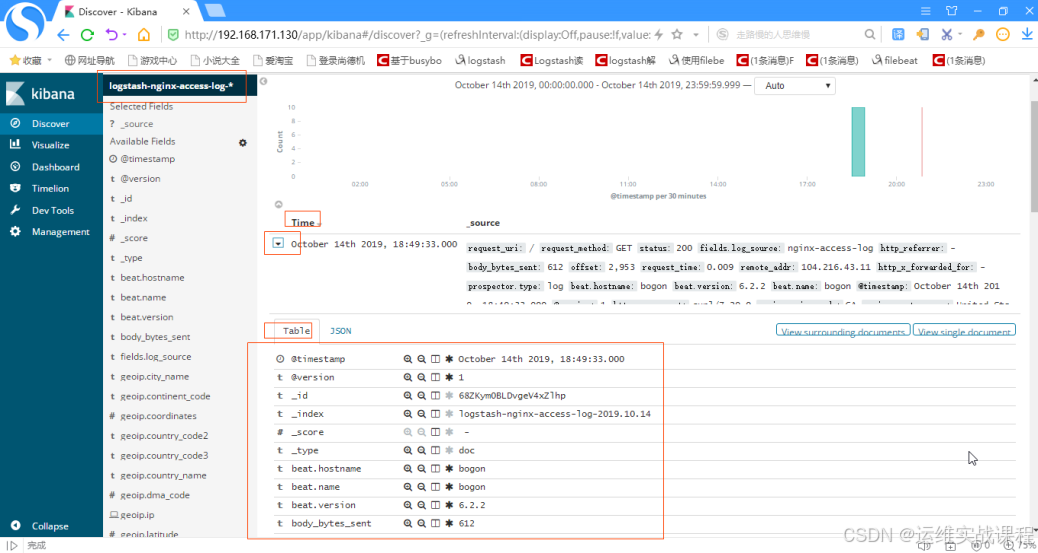
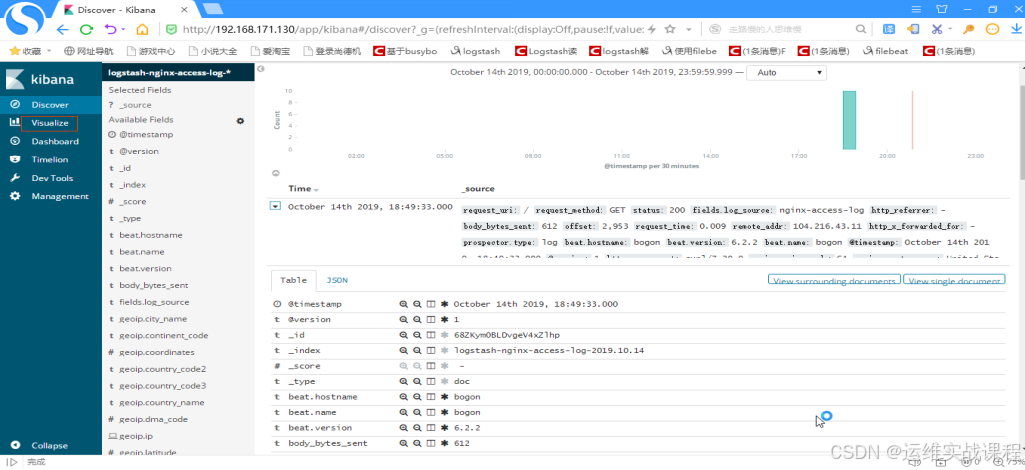
查看日志,点击discover,选择logstash-nginx-access-log-*,如下:
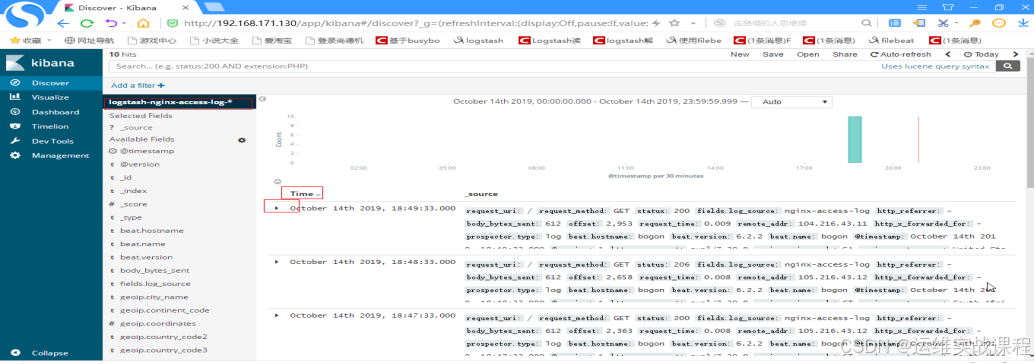
展开其中一条,可以看到是json解析格式的日志,如下:
2.在kibana上对nginx日志进行分析并绘图
1)创建pv图:
点击visuallize,如下:
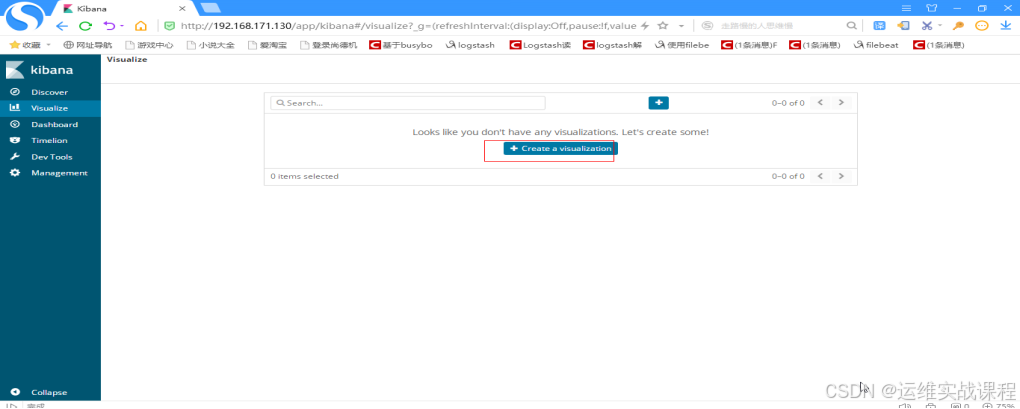
点击create a visualization,如下:
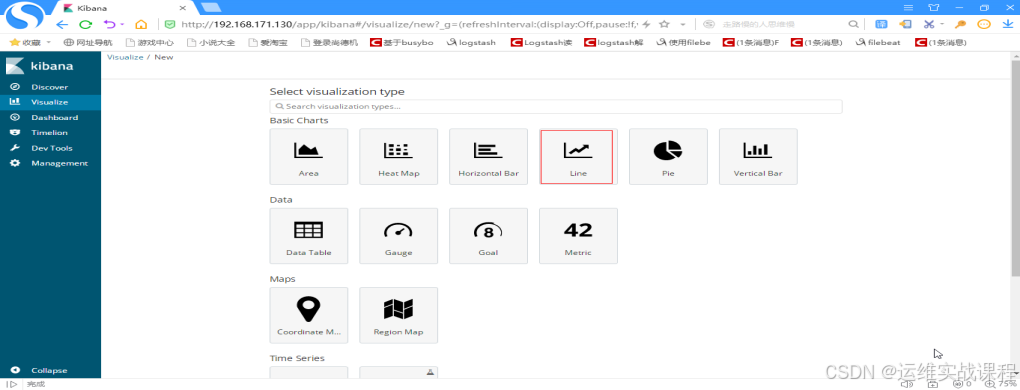
选择line,如下:
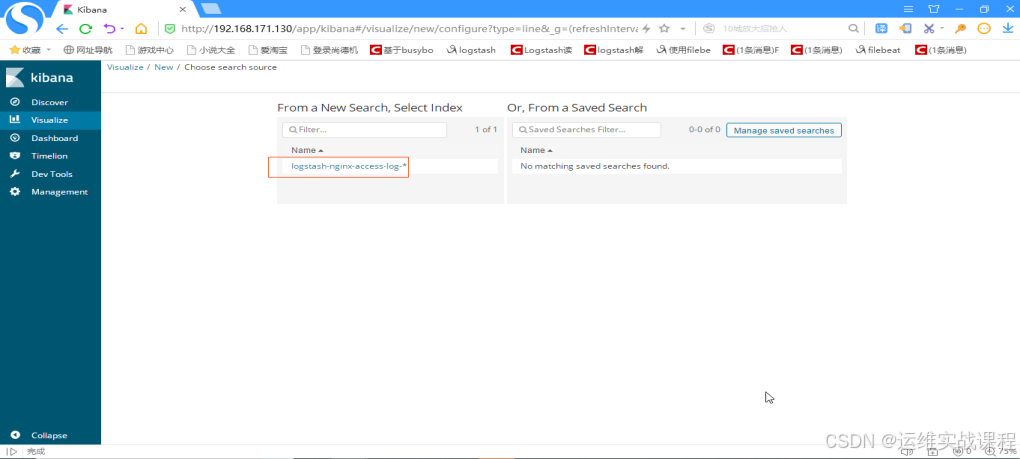
选择要绘图的日志点击,如下:
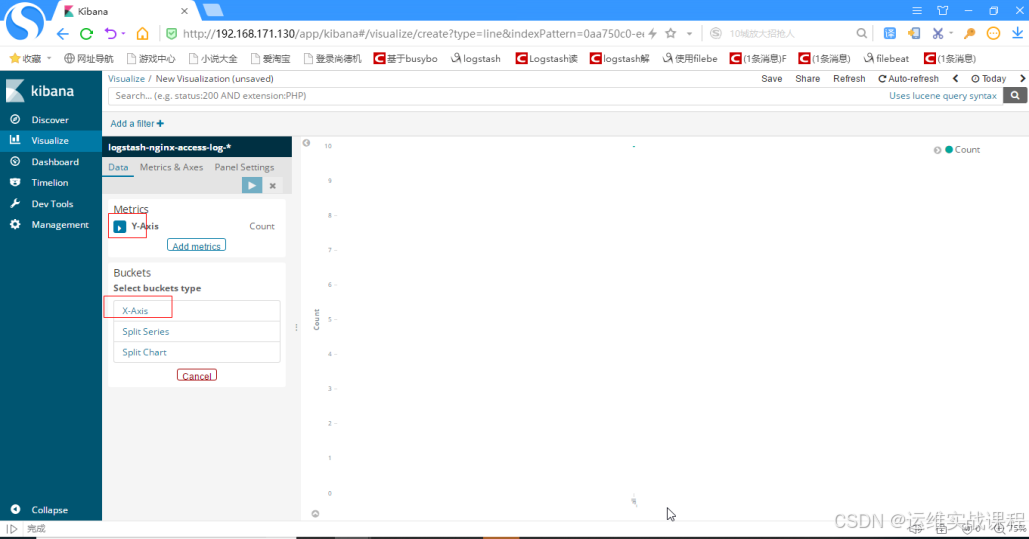
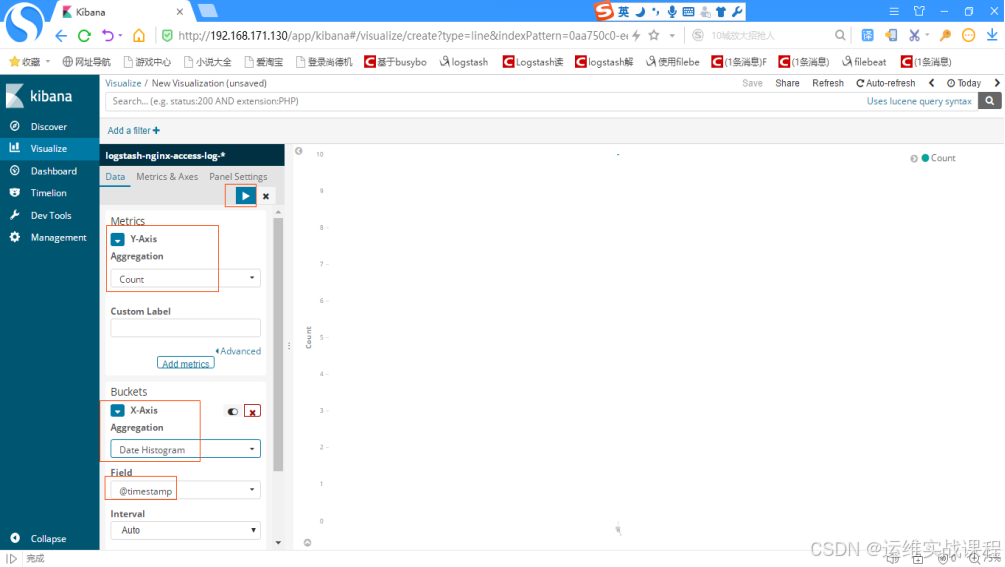
Y轴线选择count,x轴选择时间戳,点击向右箭头,如下:
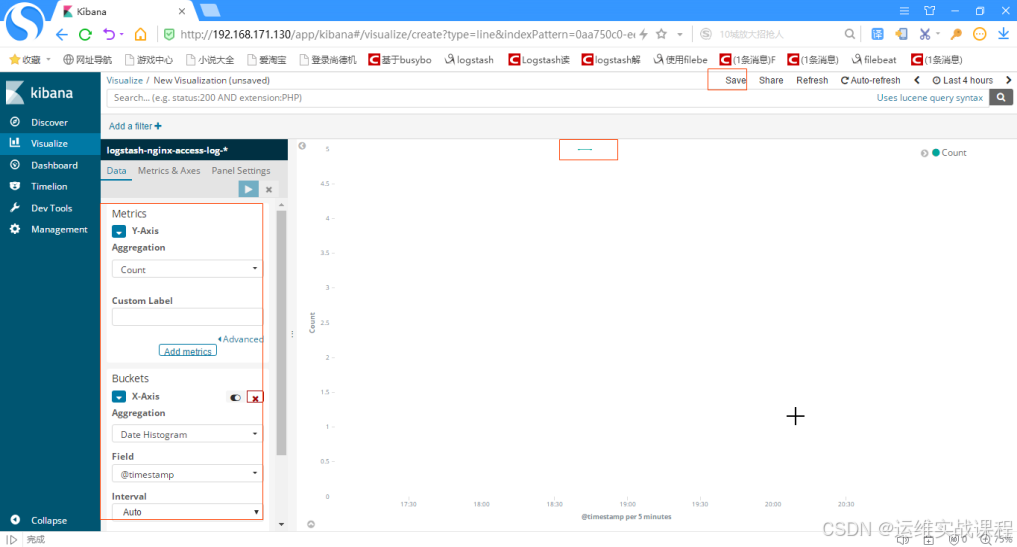
可以看到有一条直线,因为日志少,所有图形少,点击save,如下:
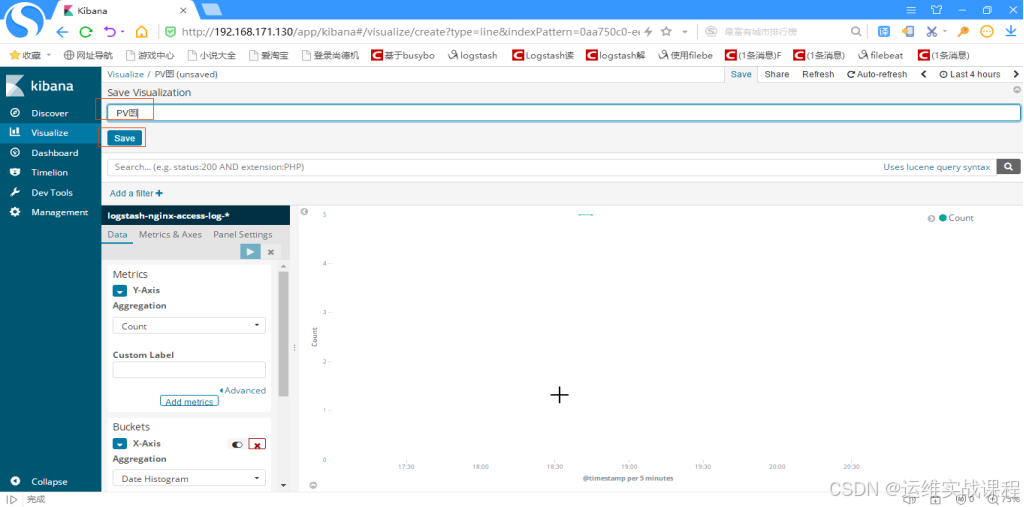
起名,并save,如下:
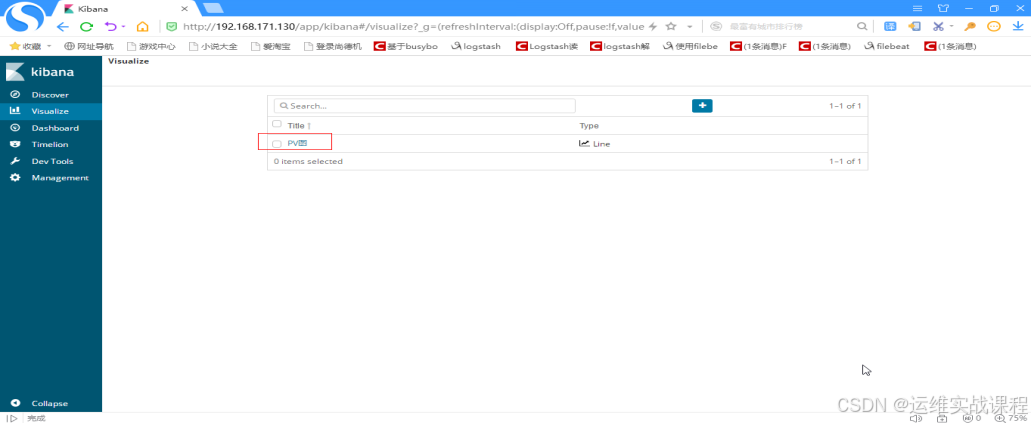
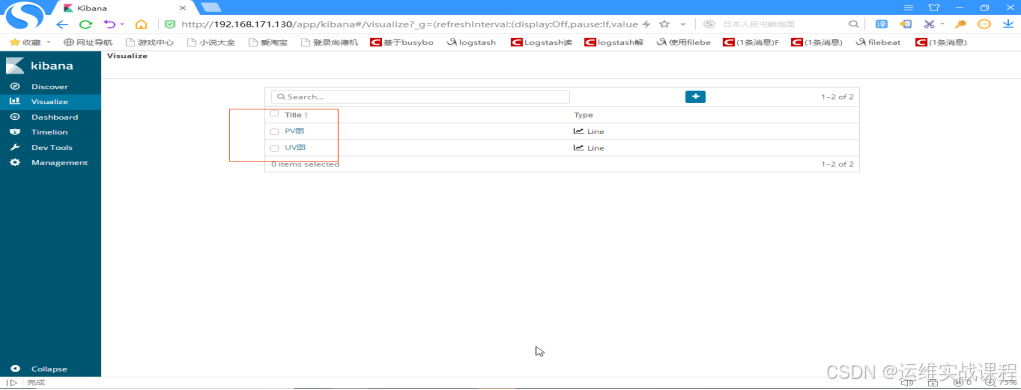
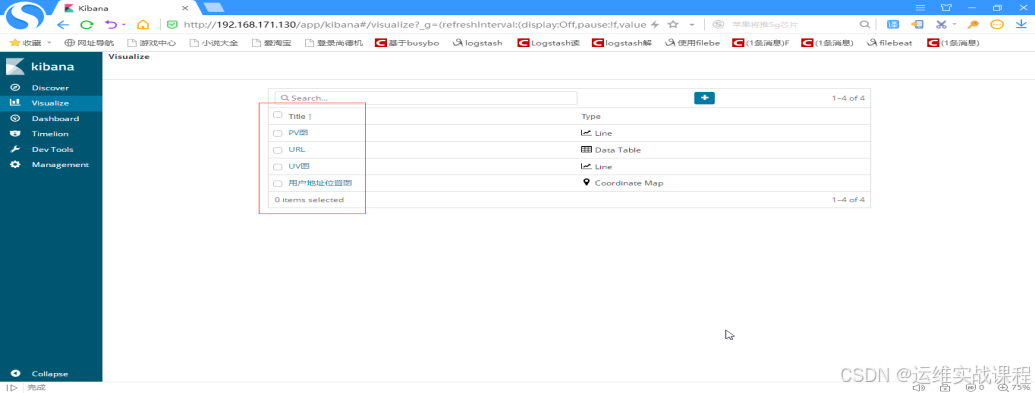
2)创建uv图:
点击+添加,如下:

选择line,如下:
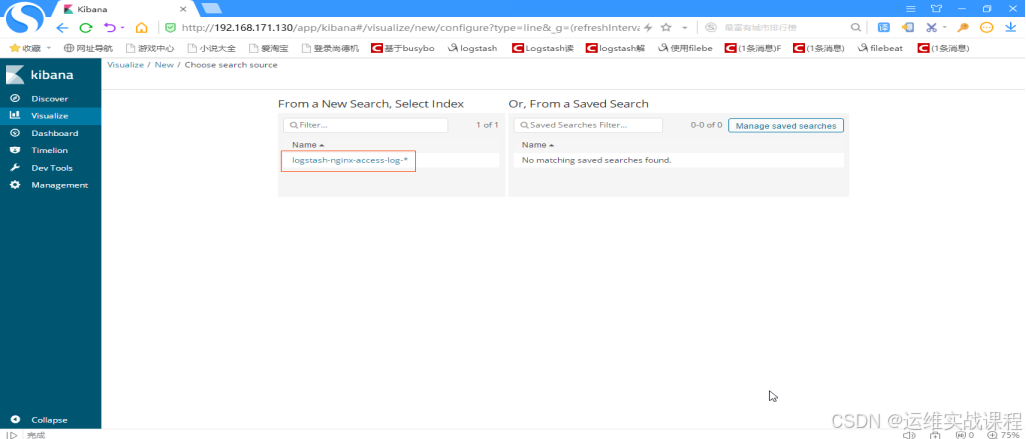
选择日志,如下:
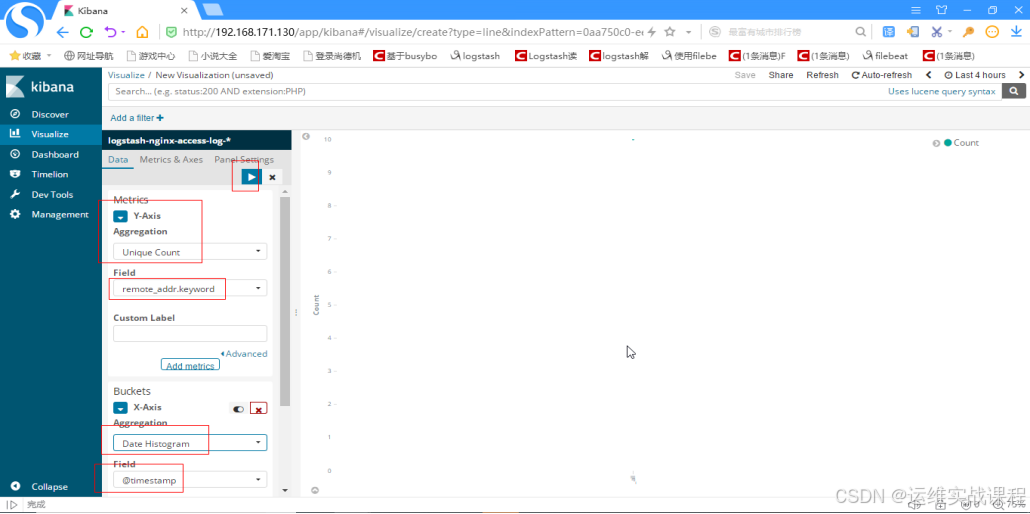
X轴选择Unique Count(去重统计),字段选择: remote_addr(客户端ip的那个),y轴选择时间戳,点击向右箭头,如下:

出现图形后,点击save,如下:
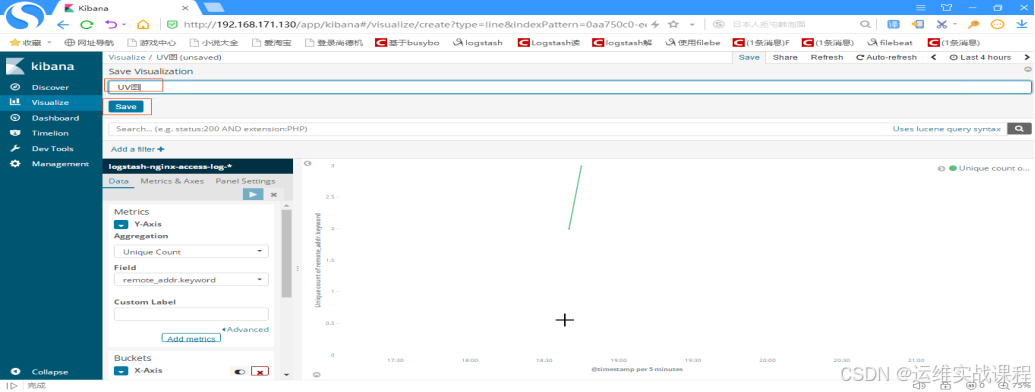
起名,并save后,如下:
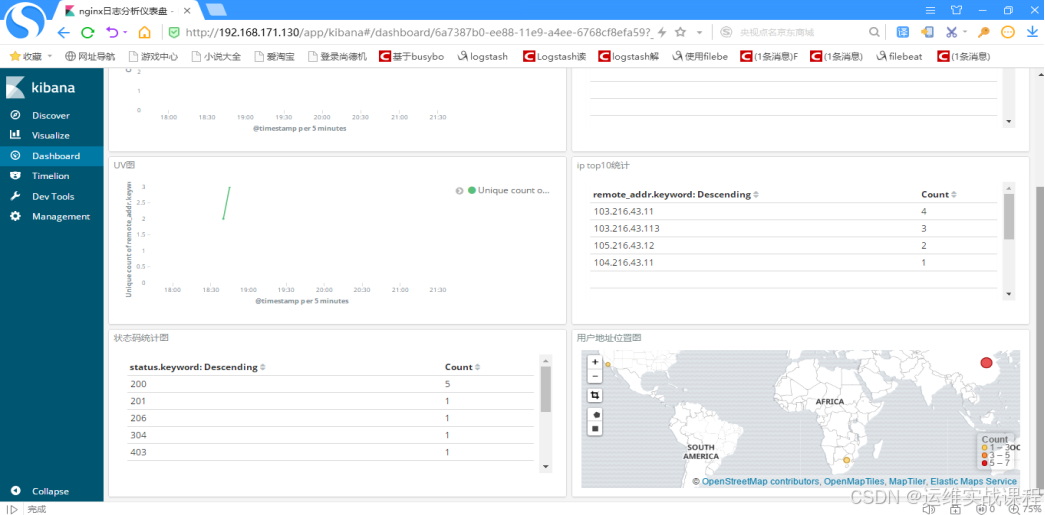
3)创建用户地理位置分布图
点击+添加,如下:
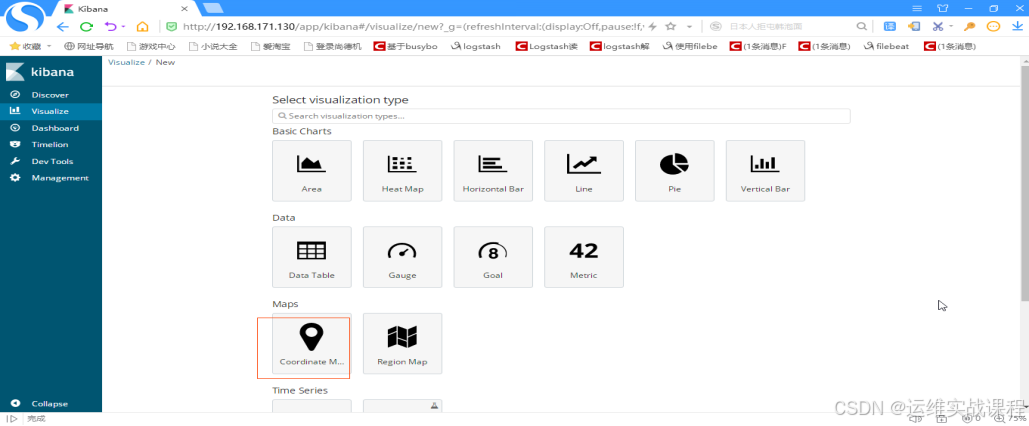
选择map图,如下:

选择日志,如下:
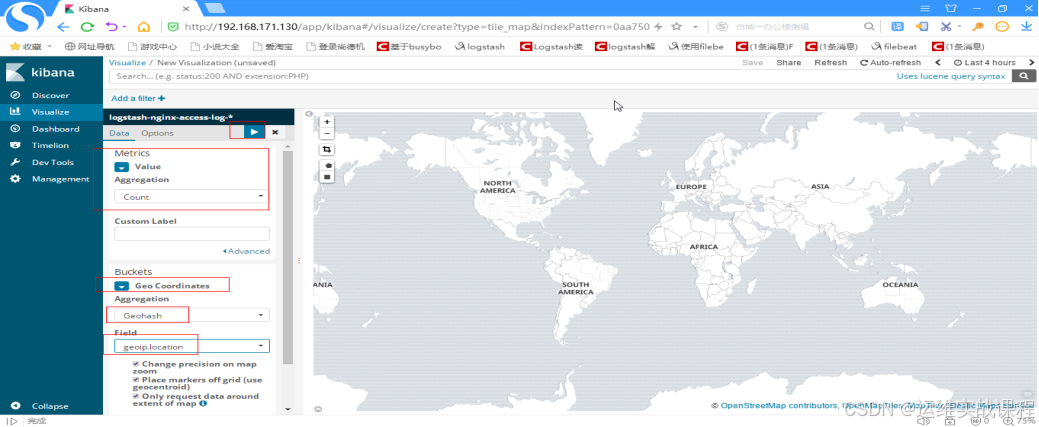
Vlaue选择count, 再选择Geo Coordinates, Geohash, geoip.location,点击向右箭头,如下:
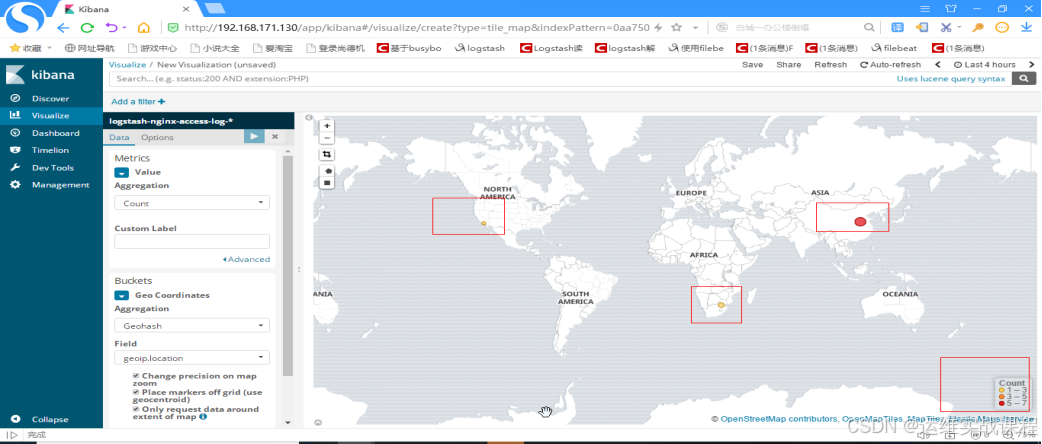
出现图后,点击save,如下:
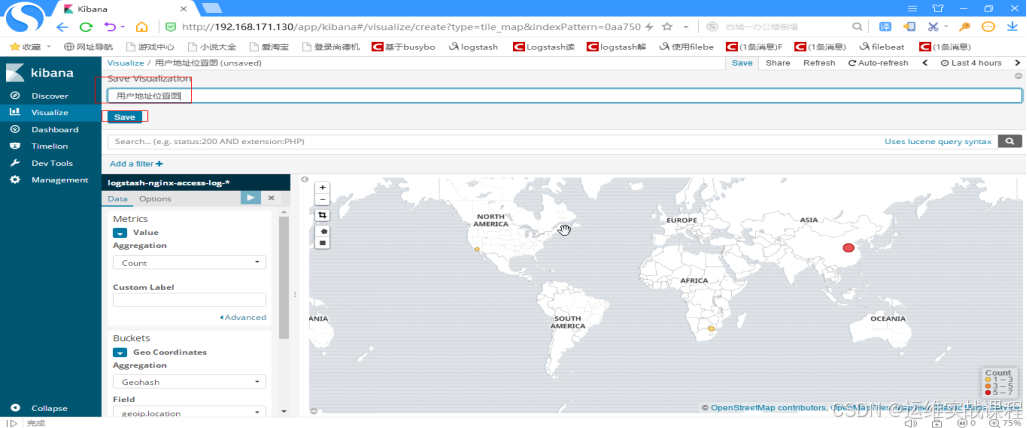
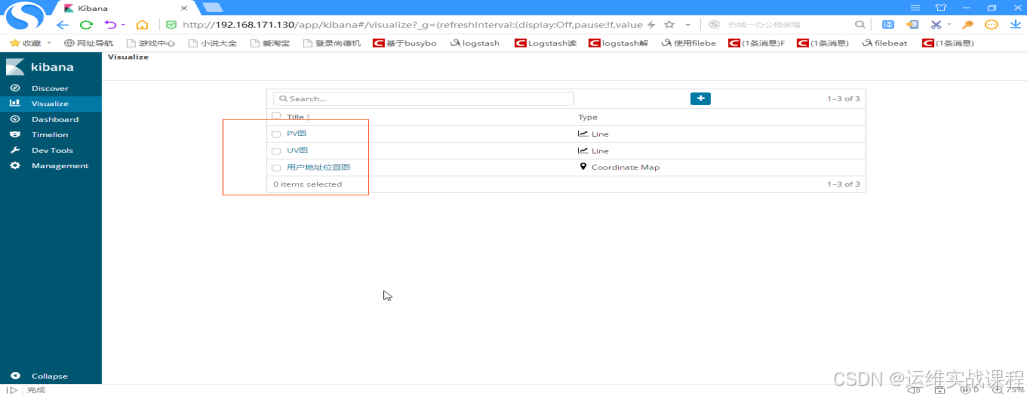
起名,并save后,如下:
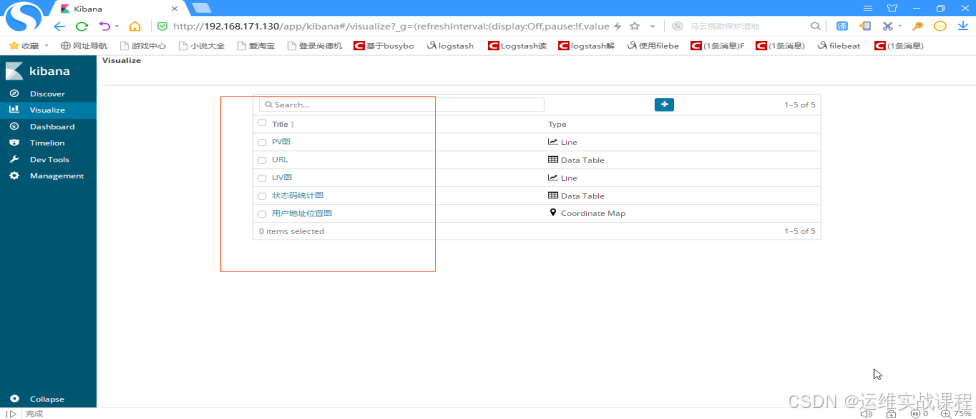
4)创建url图
点击+新加,如下:
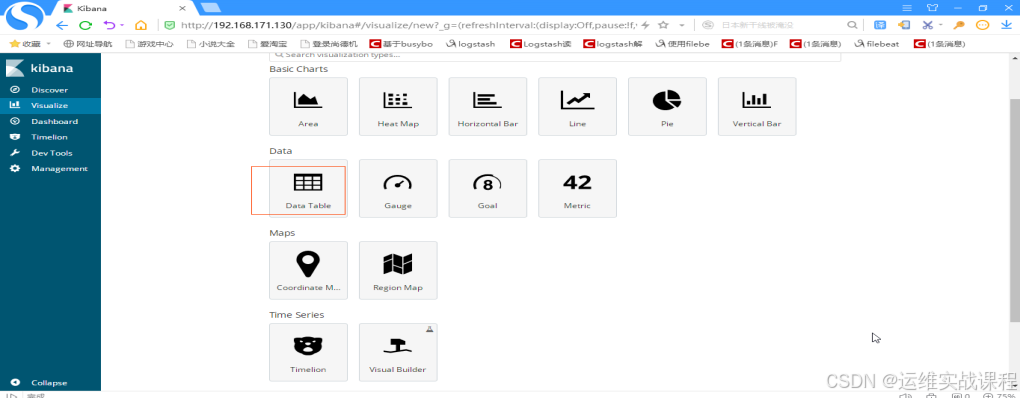
选择data table,如下:
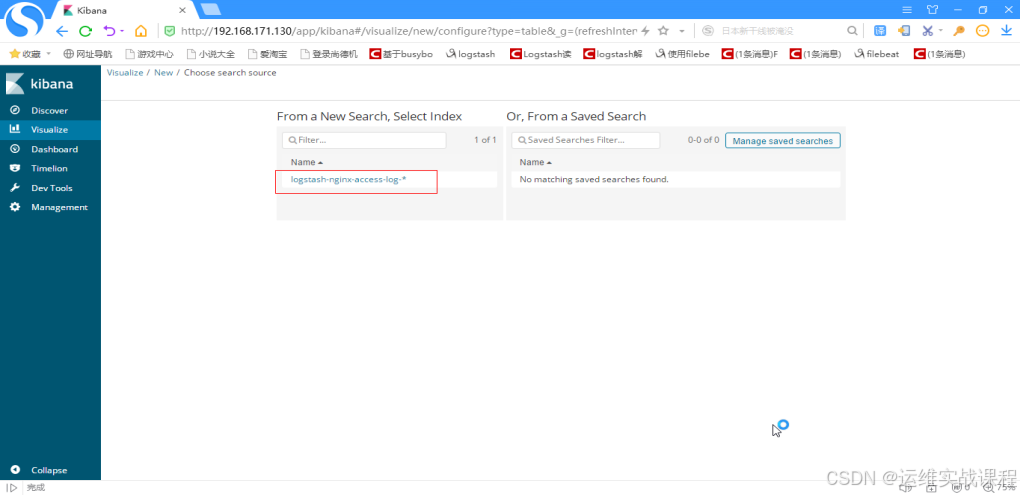
选择日志,如下:
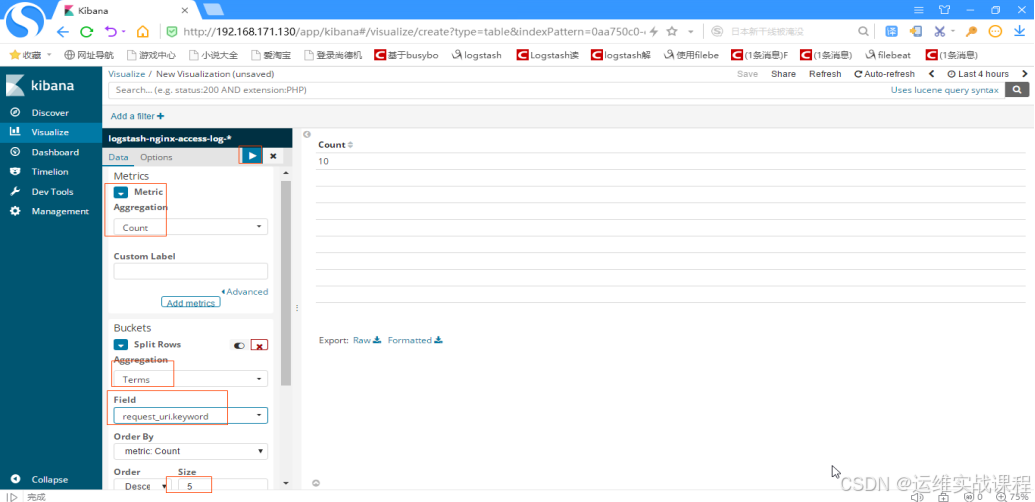
选择统计count, 聚合Terms,字段 :request_uri 排序:5个,点击向右箭头,如下:
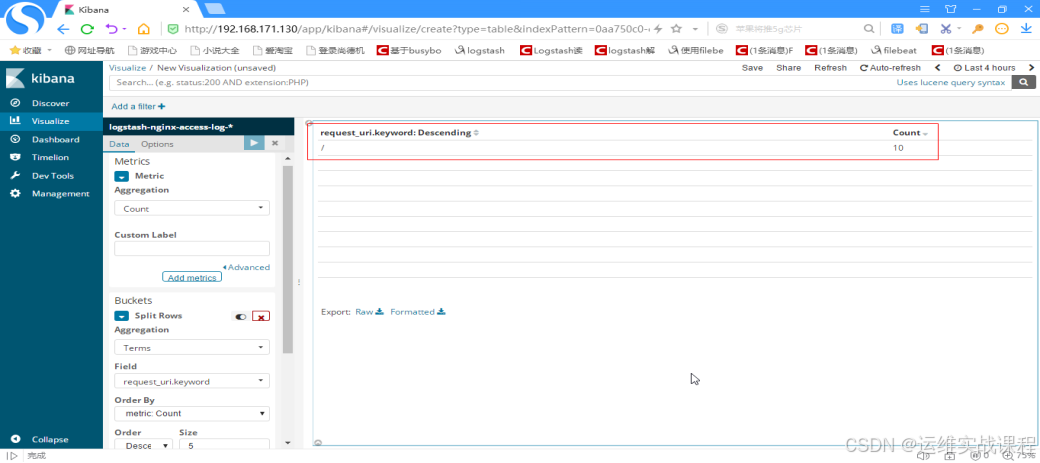
出现图后,点击save,因为此处访问就一个根url,所以没有别的,save,如下:
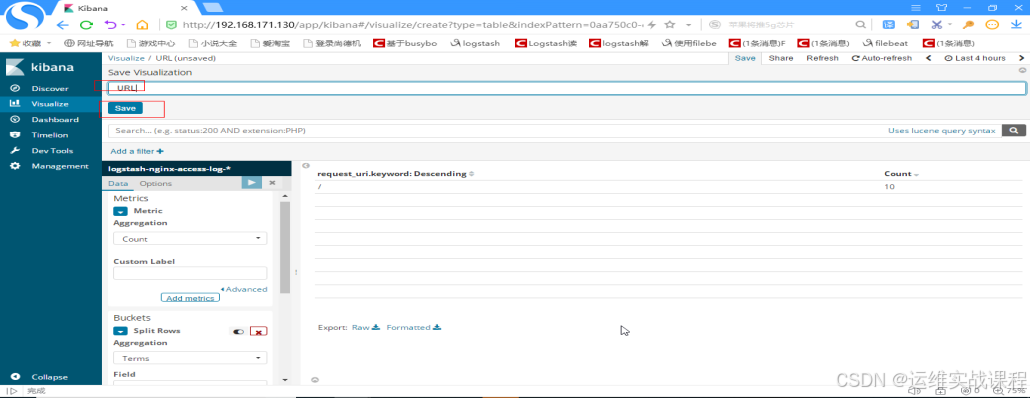
起名,并save后如下:
5)http status图
点击+新增,如下:
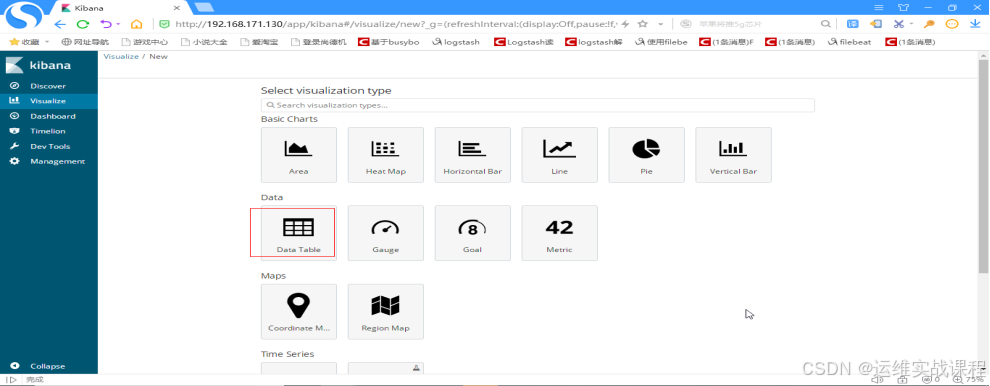
选择data table,如下:
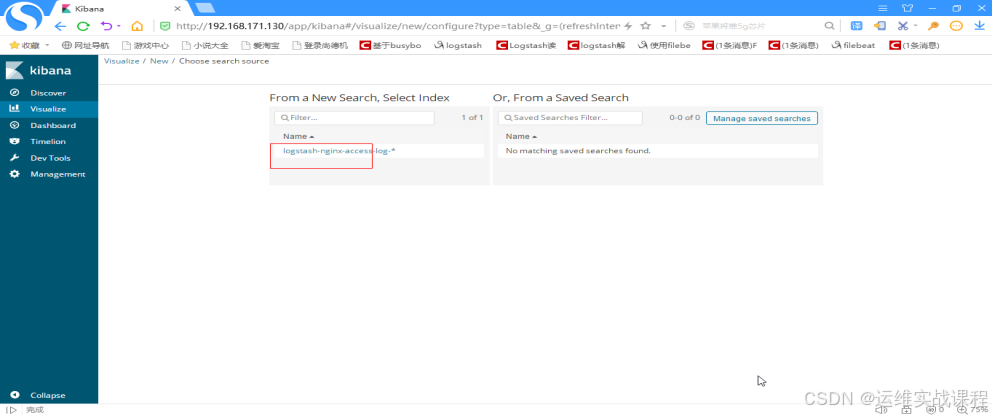
选择日志,如下:

选择count统计,Terms聚合,字段:status 排序5个,点击向右箭头,如下:
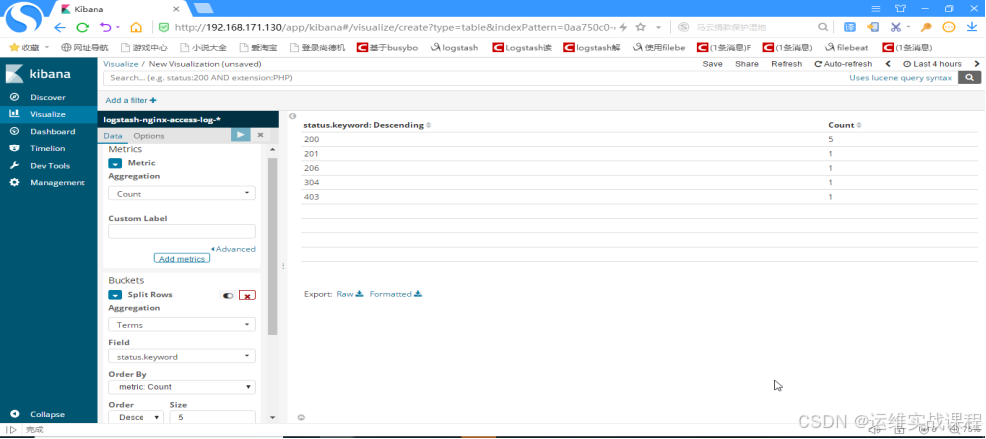
显示出图形后,点击save,如下:
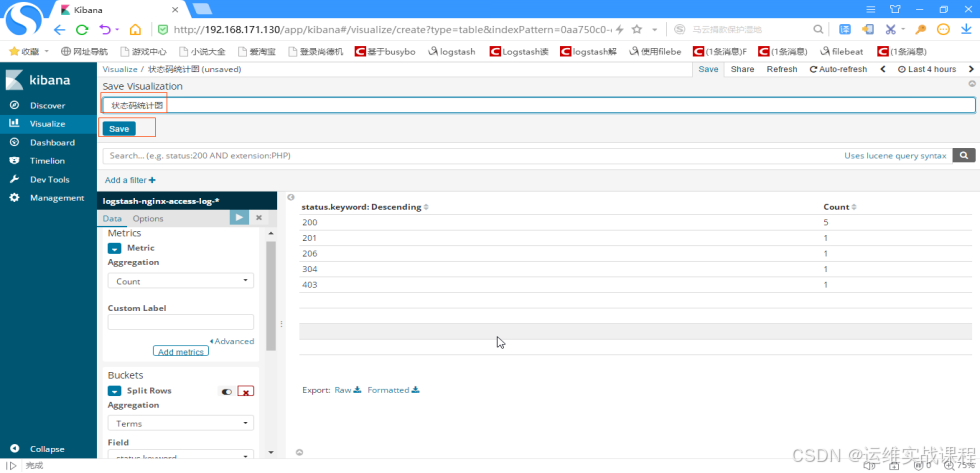
起名并save后,如下:
6)ip top 10统计
点击+新增,如下:
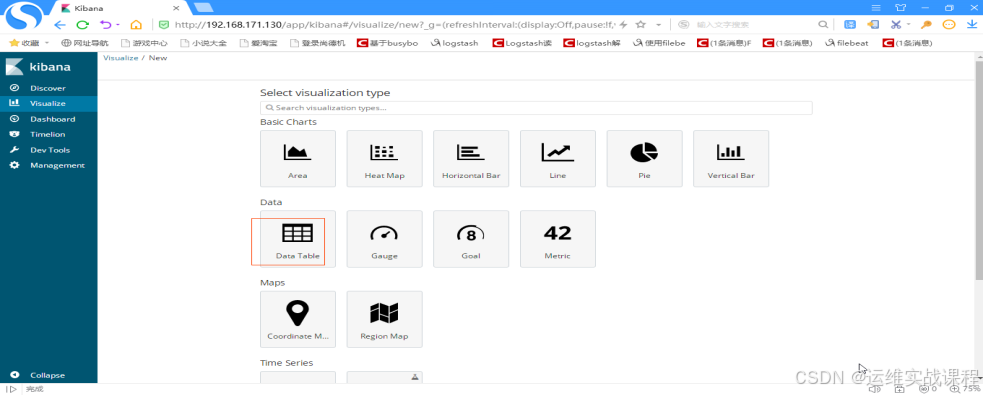
选择data table,如下:
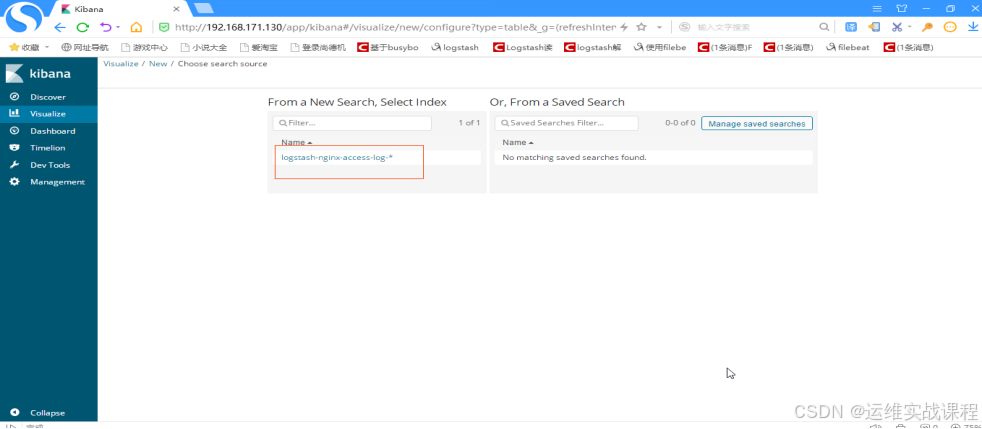
选择日志,如下:
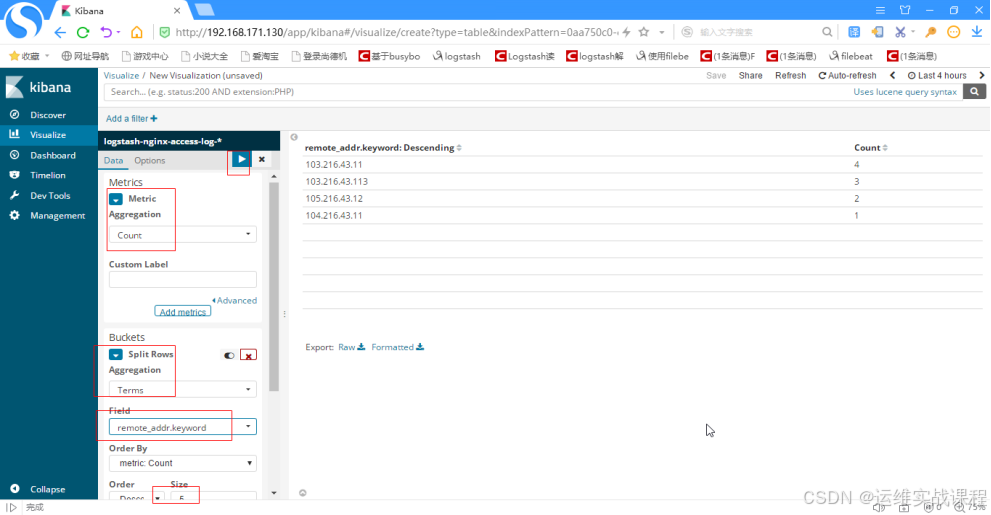
选择统计count,聚合terms,字段:remote_addr 排序5个,点击向右箭头,如下:
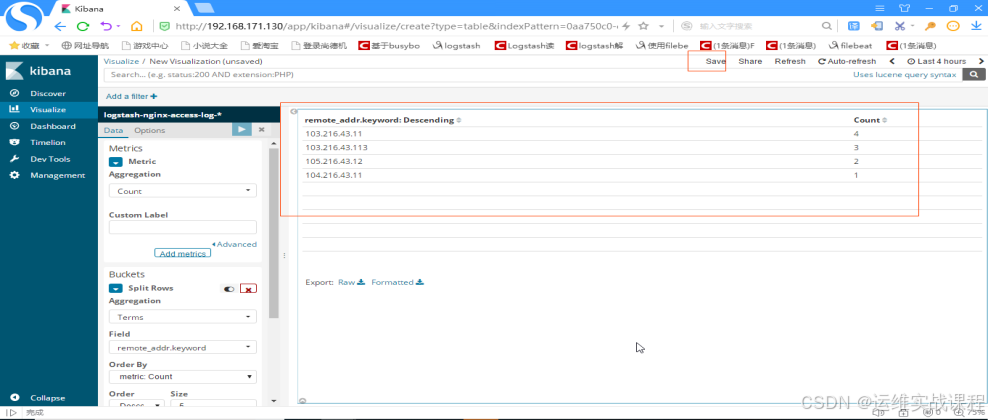
点击save,如下:
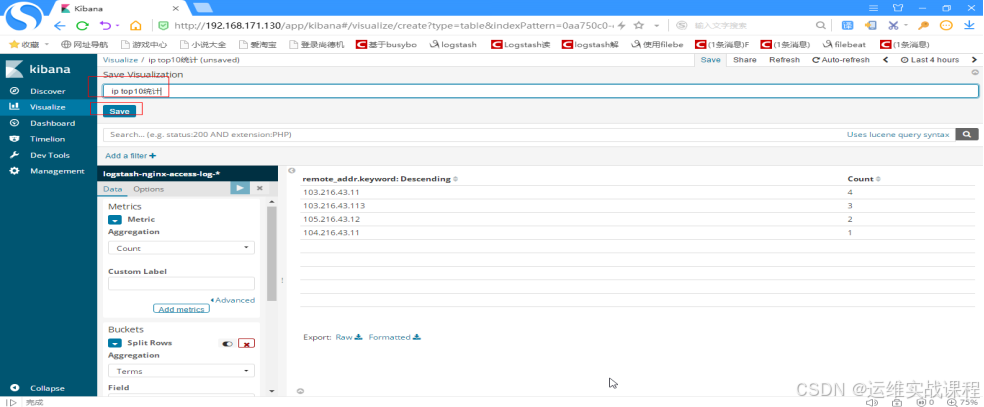
起名,并save后,如下:
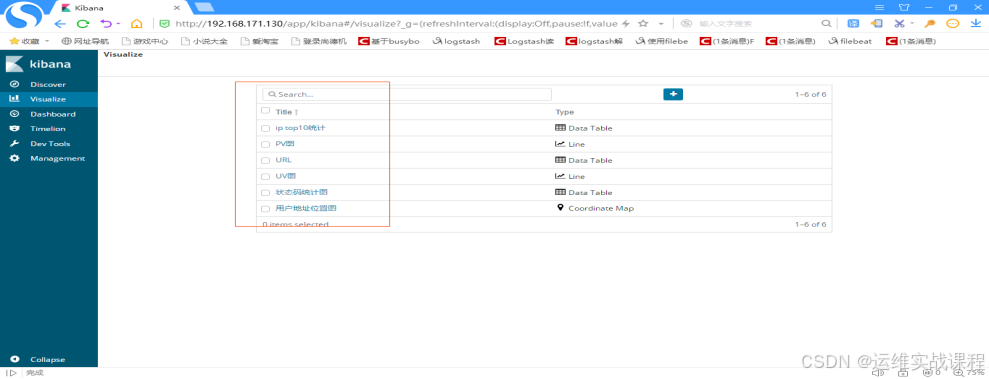
7)将刚才创建的可视化图表放到仪表盘中:
创建仪表盘:
点击:dashboard,如下:

点击create a dashboard,如下:
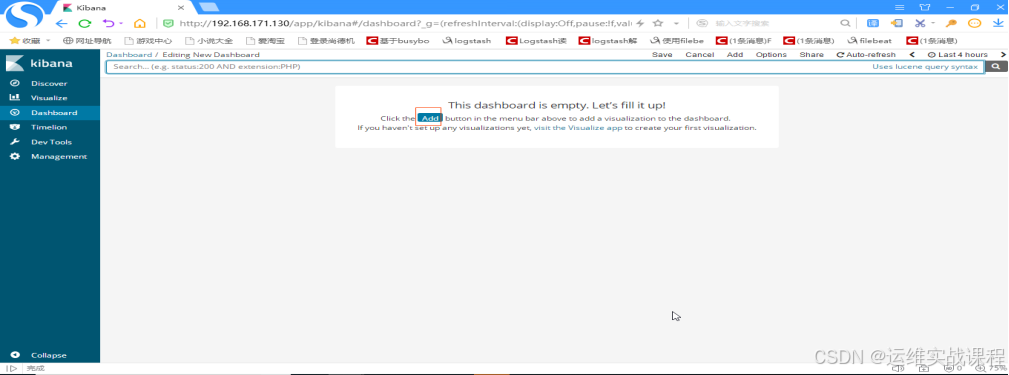
点击add,如下:
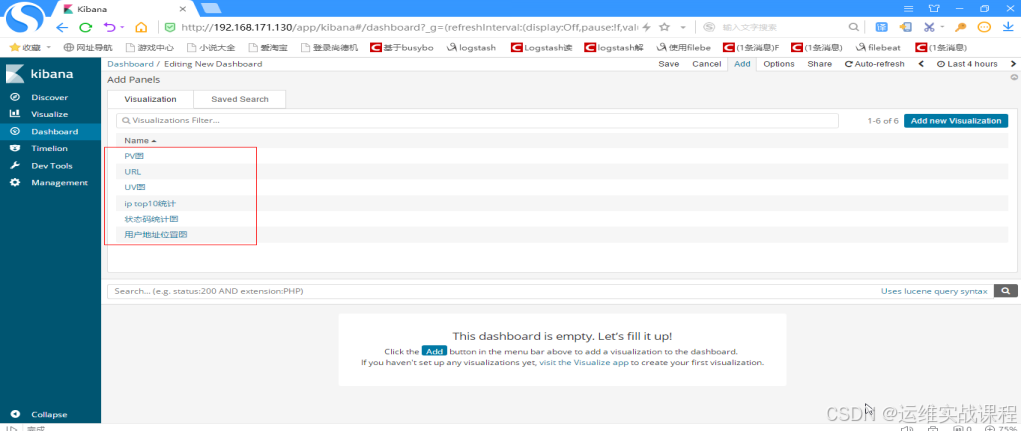
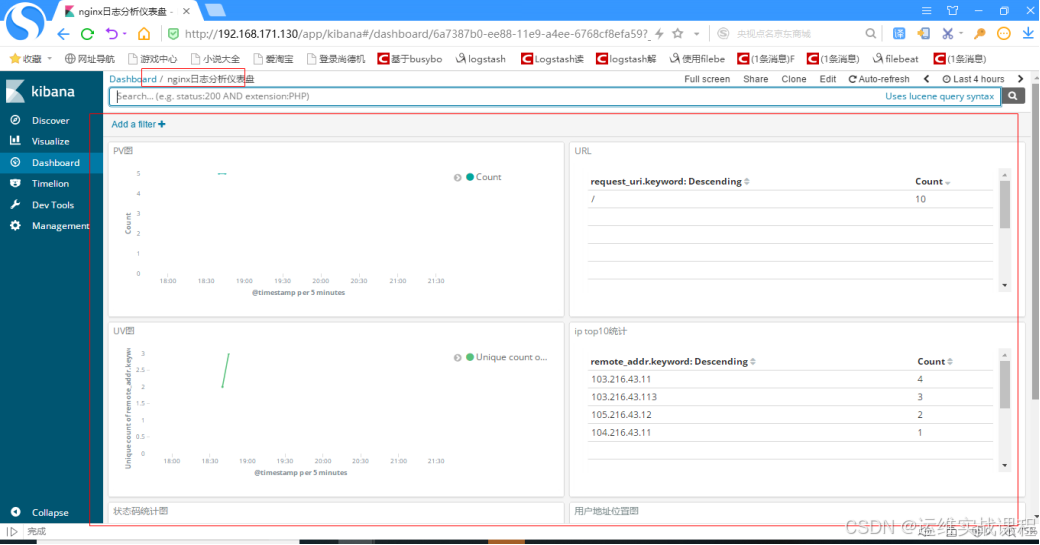
依次点击各个可视化图表即可添加到仪表盘,添加后如下:
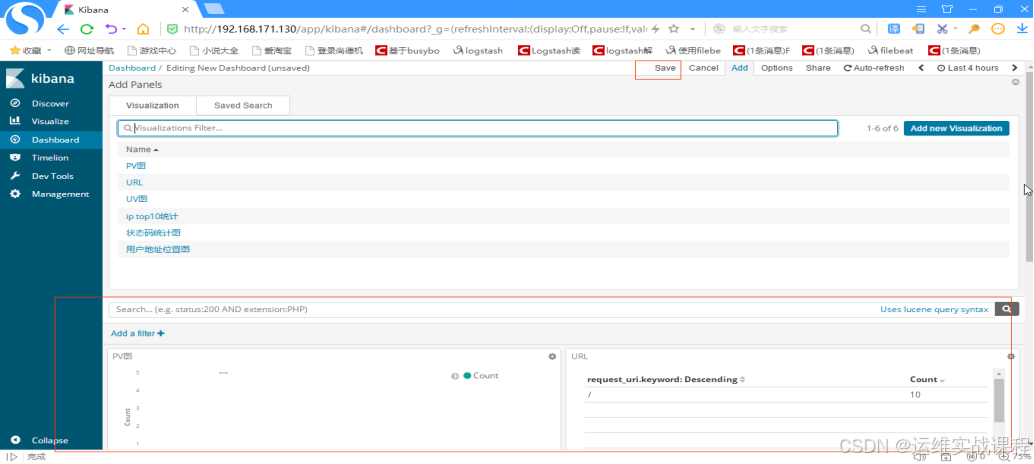
点击save,如下:
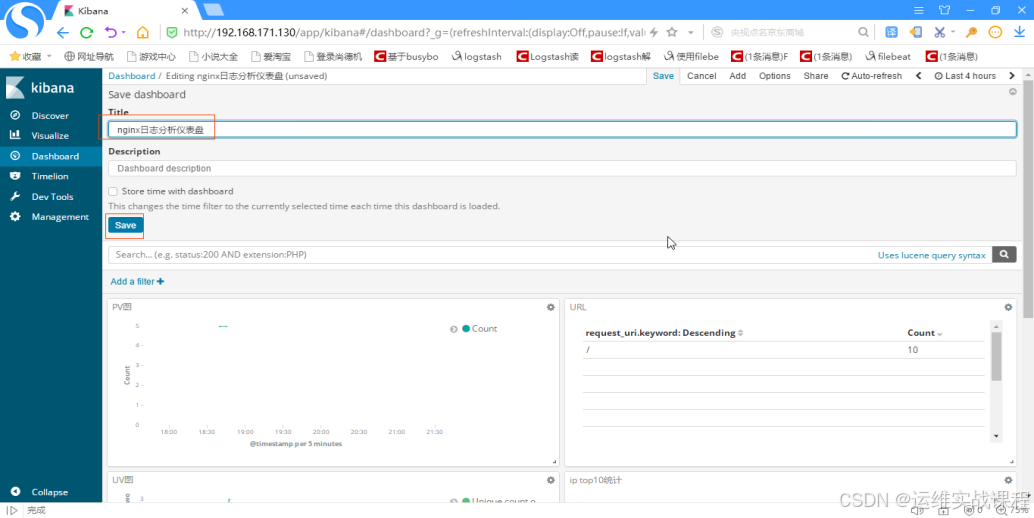
起名并保存,添加完后,如下:
如果对运维课程感兴趣,可以在b站上、A站或csdn上搜索我的账号: 运维实战课程,可以关注我,学习更多免费的运维实战技术视频