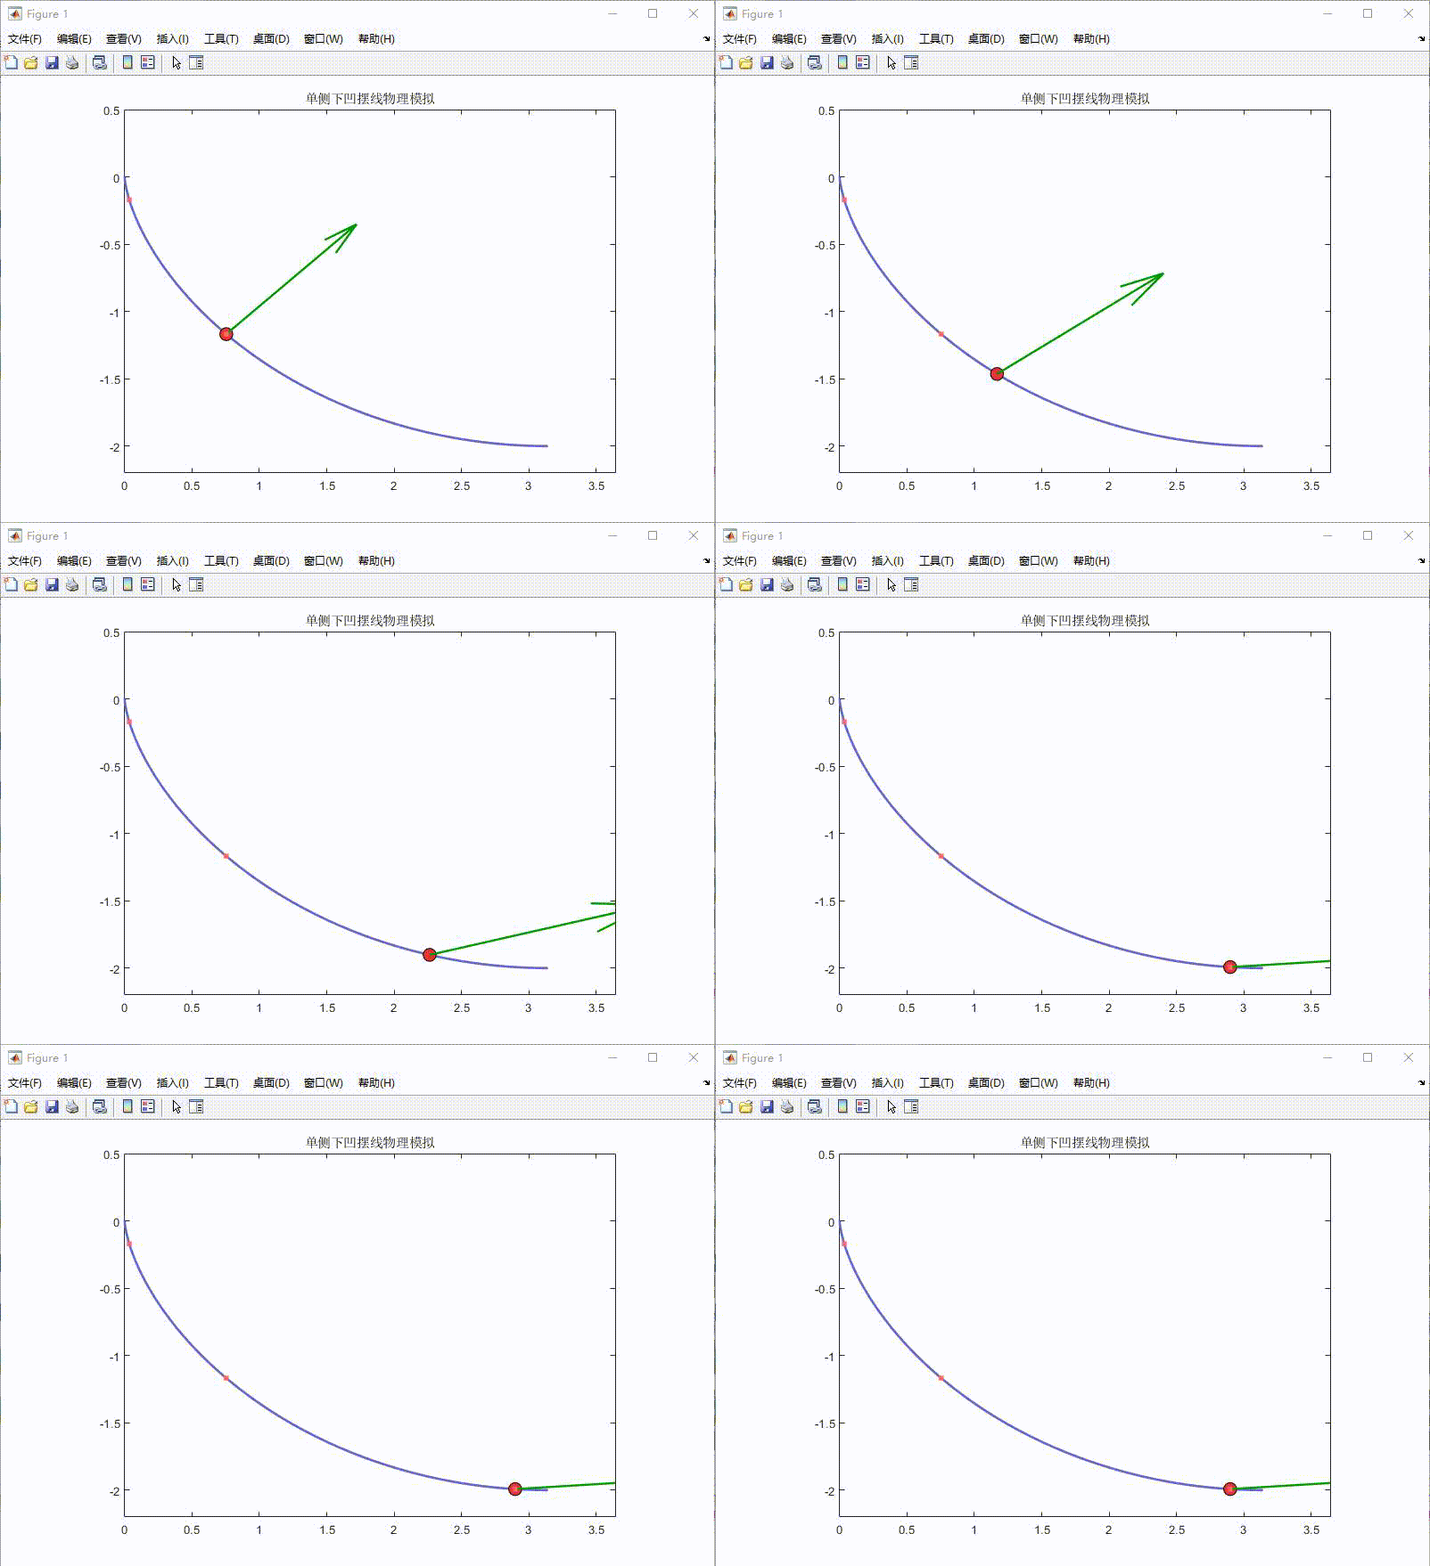
-
物理建模:
- 使用摆线参数方程定义轨迹:x = r(θ - sinθ), y = r(1 - cosθ)
- 通过微分方程求解角度θ随时间变化关系,考虑能量守恒定律
- 计算实时速度分量和切向加速度
-
可视化特性:
- 灰色虚线显示完整摆线轨迹
- 红色小球实时显示当前位置
- 绿色箭头指示瞬时速度矢量
- 粉色点迹显示运动轨迹历史
- 实时数据显示时间、速度和加速度
-
交互特性:
- 自动调整坐标系比例保持物理尺度一致
- 每0.09秒记录一次轨迹点
- 速度矢量动态缩放确保可视化效果
-

Matlab
%% 单侧摆线下落物理模拟
function single_side_cycloid()
    clf; close all; clear;

    %% 物理参数调整
    r = 1.0;                % 摆线半径 (m)
    g = 9.81;               % 重力加速度 (m/s²)
    theta_max = pi;         % 最大角度限制为π(半摆线)
    t_total = 2.5;          % 总模拟时间 (s)
    dt = 0.03;              % 时间步长 (s)

    %% 单侧摆线方程(右半侧)
    cycloid_x = @(th) r*(th - sin(th));  % x坐标方程保持不变
    cycloid_y = @(th) -r*(1 - cos(th));  % 下凹摆线y坐标(取反)

    %% 约束运动微分方程
    ode_fun = @(t,y) [y(2);
                     (g/r)*sin(y(1))/(1 - cos(y(1))) * (y(1)<theta_max*0.98)]; % 角度接近π时抑制加速度

    opts = odeset('RelTol',1e-6,'AbsTol',1e-9, 'Events', @(t,y)angleEvents(y,theta_max));
    [t_ode, theta] = ode45(ode_fun, [0 t_total], [0.1; 0], opts); % 初始角度0.1rad启动

    %% 时间插值处理
    t_sim = 0:dt:min(t_ode(end), t_total);
    theta_sim = interp1(t_ode, theta(:,1), t_sim, 'pchip');

    %% 图形初始化
    figure('Color','w','Position',[200 200 800 500])
    ax = axes('XLim',[0 r*pi+0.5], 'YLim',[-2.2 0.5],... % X轴范围限定在右半侧
             'DataAspectRatio',[1 1 1],'Box','on');
    title('单侧下凹摆线物理模拟')
    hold on;

    % 绘制右半摆线(θ从0到π)
    th_plot = linspace(0, theta_max, 150);
    plot(cycloid_x(th_plot), cycloid_y(th_plot),...
        'LineWidth',2,'Color',[0.4 0.4 0.8])

    % 初始化小球图形(右侧起点)
    ball = scatter(cycloid_x(0.1), cycloid_y(0.1), 120, 'filled',...
                  'MarkerFaceColor',[0.9 0.2 0.2],...
                  'MarkerEdgeColor','k');

    % 速度矢量初始化
    v_quiver = quiver(cycloid_x(0.1), cycloid_y(0.1), 0, 0,...
                     'LineWidth',1.8,'Color',[0 0.6 0],...
                     'MaxHeadSize',0.8,'AutoScale','off');

    % 创建终点标记
    end_marker = plot(nan, nan, 'rx', 'MarkerSize',15,'LineWidth',2);

    %% 动态模拟主循环
    for k = 1:length(t_sim)
        th = theta_sim(k);

        % 计算当前位置
        x = cycloid_x(th);
        y = cycloid_y(th);

        % 计算瞬时速度
        dx_dth = r*(1 - cos(th));
        dy_dth = r*sin(th);
        dth_dt = interp1(t_ode, theta(:,2), t_sim(k));
        vx = dx_dth * dth_dt;
        vy = dy_dth * dth_dt;

        % 更新图形对象
        set(ball, 'XData',x, 'YData',y)
        set(v_quiver, 'XData',x, 'YData',y,...
                     'UData',vx*0.08, 'VData',vy*0.08)

        % 到达终点时标记
        if th >= theta_max*0.98
            set(end_marker, 'XData',x, 'YData',y)
            break; % 提前终止循环
        end

        % 绘制轨迹(每4帧记录一次)
        if mod(k,4)==0
            plot(x, y, '.','Color',[1 0.4 0.4],'MarkerSize',12)
        end

        drawnow limitrate

        pause(0.8);
    end
end

%% 事件函数(角度达到π时停止)
function [value,isterminal,direction] = angleEvents(y,theta_max)
    value = y(1) - theta_max*0.99; % 触发阈值设为99%最大角度
    isterminal = 1; % 终止积分
    direction = 1;  % 单方向触发
end