代码:
import numpy as np
import matplotlib.pyplot as plt
import matplotlib as mpl
# 中文字体设置
mpl.rcParams['font.sans-serif'] = ['SimHei']
mpl.rcParams['axes.unicode_minus'] = False
# 原始数据
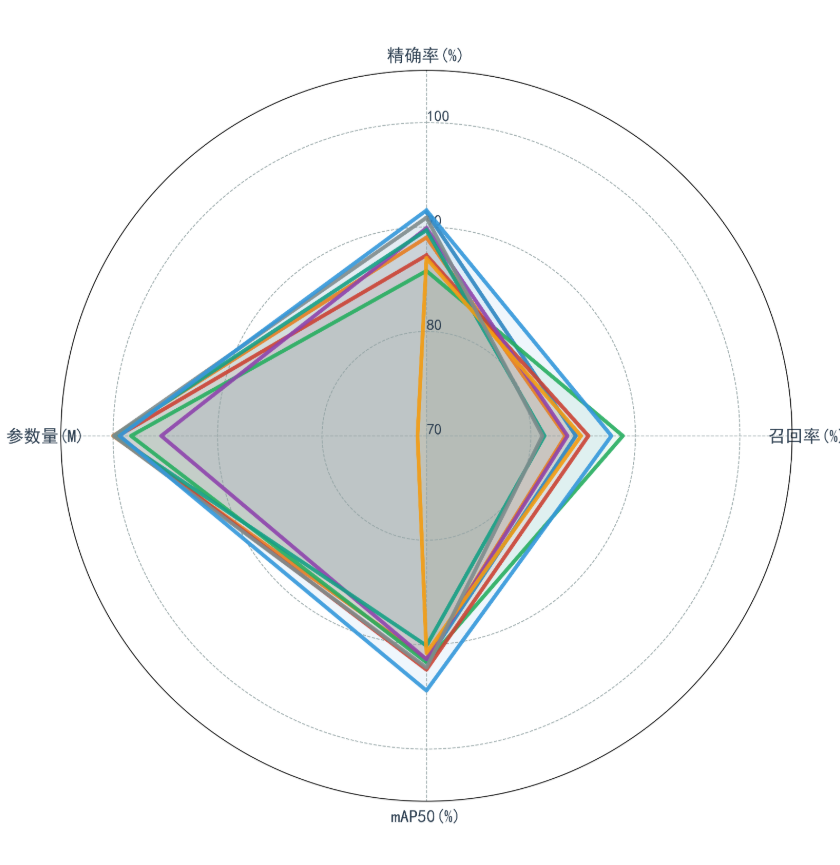
data = [
{'模型': 'YOLOv3', 'P': 91.4, 'R': 84.3, 'mAP50': 91.6, 'Params': 103.665},
{'模型': 'YOLOv5', 'P': 89.0, 'R': 83.3, 'mAP50': 91.4, 'Params': 2.503},
{'模型': 'YOLOv6', 'P': 85.8, 'R': 88.8, 'mAP50': 91.7, 'Params': 4.233},
{'模型': 'YOLOv8', 'P': 87.3, 'R': 85.5, 'mAP50': 92.4, 'Params': 3.006},
{'模型': 'YOLOv9s', 'P': 89.9, 'R': 83.5, 'mAP50': 91.4, 'Params': 7.167},
{'模型': 'YOLOv10n', 'P': 89.7, 'R': 81.3, 'mAP50': 90.1, 'Params': 2.695},
{'模型': 'RT-DETR-I', 'P': 87.0, 'R': 84.8, 'mAP50': 90.8, 'Params': 31.987},
{'模型': 'YOLO12', 'P': 90.9, 'R': 81.1, 'mAP50': 92.2, 'Params': 2.557},
{'模型': 'YOLO11-DL', 'P': 91.6, 'R': 87.7, 'mAP50': 94.4, 'Params': 3.140},
]
# 数据处理
params = [d['Params'] for d in data]
min_p, max_p = min(params), max(params)
scaled_params = [100 * (max_p - p) / (max_p - min_p) for p in params] # 参数效率计算
categories = ['P', 'R', 'mAP50', 'Params']
labels = ['精确率(%)', '召回率(%)', 'mAP50(%)', '参数量(M)']
# 构造雷达图数据
angles = np.linspace(0, 2*np.pi, len(categories), endpoint=False).tolist()
values = []
for d in data:
val = [d['P'], d['R'], d['mAP50'], scaled_params[data.index(d)]]
values.append(val + val[:1]) # 闭合多边形
angles += angles[:1]
# 专业配色方案 (9种优化颜色)
colors = [
'#2E86C1', # 深蓝
'#E67E22', # 橙
'#27AE60', # 绿
'#CB4335', # 红
'#8E44AD', # 紫
'#16A085', # 青
'#F39C12', # 金
'#7F8C8D', # 灰
'#3498DB' # 蓝
]
# 创建画布
plt.figure(figsize=(12, 12), dpi=300)
ax = plt.subplot(111, polar=True)
# 绘制每个模型(线宽增加到3)
for i, (model, color) in enumerate(zip(data, colors)):
ax.plot(angles, values[i], linewidth=3.5, linestyle='-', # 加粗线条
label=model['模型'], color=color, alpha=0.9)
ax.fill(angles, values[i], alpha=0.08, color=color) # 降低填充透明度
# 坐标轴美化
ax.set_theta_offset(np.pi/2)
ax.set_theta_direction(-1)
ax.set_rlabel_position(0)
plt.xticks(angles[:-1], labels, size=16, color='#2c3e50')
plt.yticks([70, 80, 90, 100], ['70','80','90','100'], size=14, color='#2c3e50')
plt.ylim(70, 105)
# 专业图例设置
legend = plt.legend(
loc='upper right',
bbox_to_anchor=(1.28, 1.12), # 调整图例位置
prop={'size': 14, 'family': 'SimHei'},
ncol=1,
frameon=True,
framealpha=0.9,
edgecolor='#bdc3c7',
facecolor='#ffffff',
borderpad=1,
labelspacing=1.5
)
# 设置图例颜色块大小
for handle in legend.legend_handles:
handle.set_linewidth(4.0) # 加粗图例线条
handle.set_alpha(0.9)
# 网格优化
ax.xaxis.grid(True, color='#95a5a6', linestyle='--', linewidth=0.8)
ax.yaxis.grid(True, color='#95a5a6', linestyle='--', linewidth=0.8)
# 标题设置
plt.title('模型性能对比雷达图',
size=20, y=1.18, color='#2c3e50', fontweight='bold')
# 保存图像
plt.savefig('YOLO_radar_chart_optimized.png',
bbox_inches='tight',
dpi=300,
facecolor='white')
plt.close()效果图: