生成随机数据
在R中,可以使用rnorm()生成正态分布的随机数据,并模拟分组数据。以下代码生成3组(A、B、C)随机数据,每组包含10个样本:
r
set.seed(123)  # 确保可重复性
group_A <- rnorm(10, mean=50, sd=5)
group_B <- rnorm(10, mean=60, sd=8)
group_C <- rnorm(10, mean=45, sd=6)
data <- data.frame(
  Group = rep(c("A", "B", "C"), each=10),
  Value = c(group_A, group_B, group_C)
)
计算均值和标准偏差
使用dplyr包汇总数据,计算每组均值和标准偏差:
r
library(dplyr)
summary_data <- data %>%
  group_by(Group) %>%
  summarise(
    Mean = mean(Value),
    SD = sd(Value)
  )
绘制柱状图与误差棒
使用ggplot2绘制柱状图,并通过geom_errorbar添加标准偏差误差棒:
r
library(ggplot2)
ggplot(summary_data, aes(x=Group, y=Mean, fill=Group)) +
  geom_bar(stat="identity", width=0.5) +
  geom_errorbar(aes(ymin=Mean-SD, ymax=Mean+SD), width=0.2) +
  labs(title="误差分析柱状图", y="均值 ± 标准偏差") +
  theme_minimal()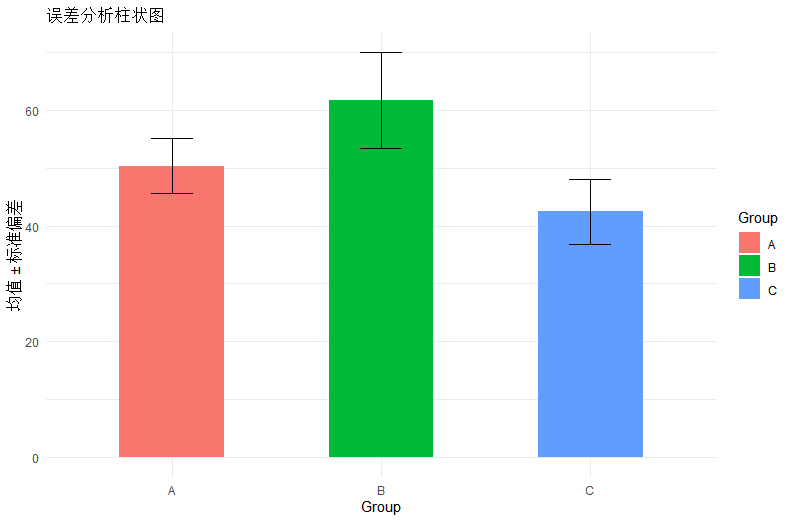
自定义图形样式(可选)
调整颜色、标题和坐标轴:
r
ggplot(summary_data, aes(x=Group, y=Mean, fill=Group)) +
  geom_bar(stat="identity", width=0.5, color="black") +
  geom_errorbar(aes(ymin=Mean-SD, ymax=Mean+SD), width=0.2, linewidth=0.7) +
  scale_fill_brewer(palette="Set2") +
  labs(title="误差分析柱状图", x="分组", y="测量值") +
  theme_classic()
输出图形
执行代码后,图形将显示在R的绘图窗口。如需保存为文件,使用ggsave():
r
ggsave("error_bar_plot.png", width=6, height=4, dpi=300)安装patchwork包 在R或RStudio中执行以下命令从CRAN安装:
r
install.packages("patchwork")
双排显示
r
library(ggplot2)
library(patchwork)
``````r
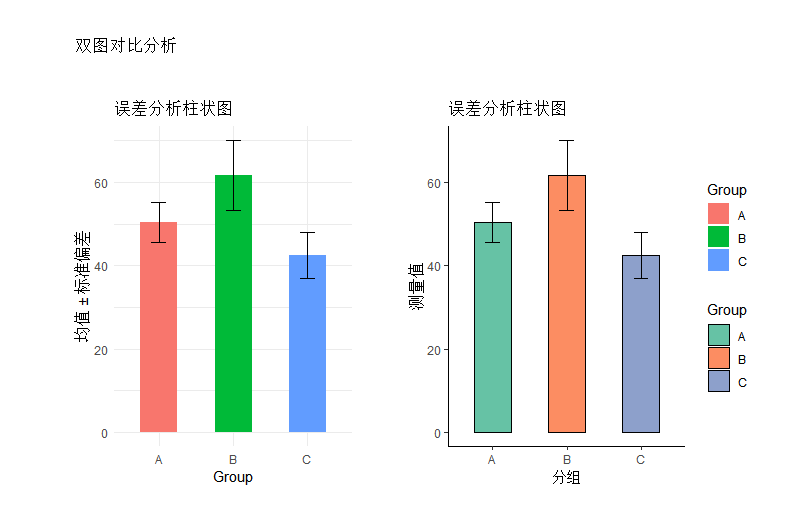
p1 <- ggplot(summary_data, aes(x=Group, y=Mean, fill=Group)) +
geom_bar(stat="identity", width=0.5) +
geom_errorbar(aes(ymin=Mean-SD, ymax=Mean+SD), width=0.2) +
labs(title="误差分析柱状图", y="均值 ± 标准偏差") +
theme_minimal()
p2 <- ggplot(summary_data, aes(x=Group, y=Mean, fill=Group)) +
geom_bar(stat="identity", width=0.5, color="black") +
geom_errorbar(aes(ymin=Mean-SD, ymax=Mean+SD), width=0.2, linewidth=0.7) +
scale_fill_brewer(palette="Set2") +
labs(title="误差分析柱状图", x="分组", y="测量值") +
theme_classic()
左右排列显示结果
r
combined_horizontal <- p1 + p2 + plot_layout(ncol = 2)
print(combined_horizontal)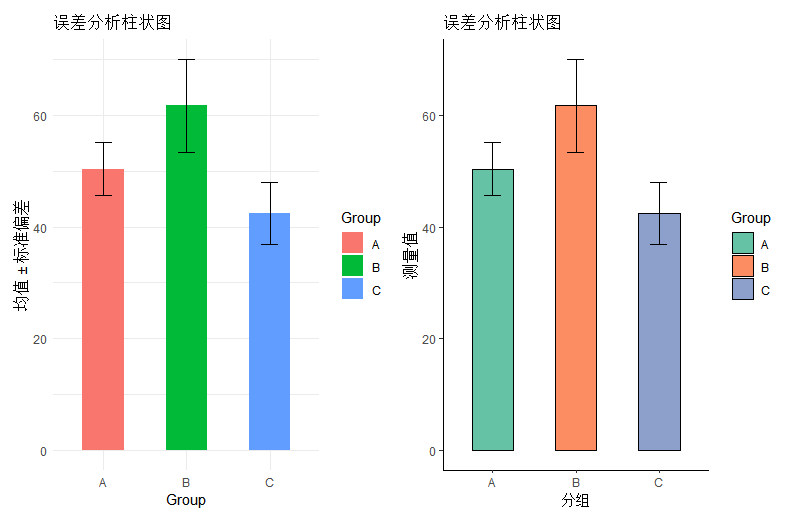
r
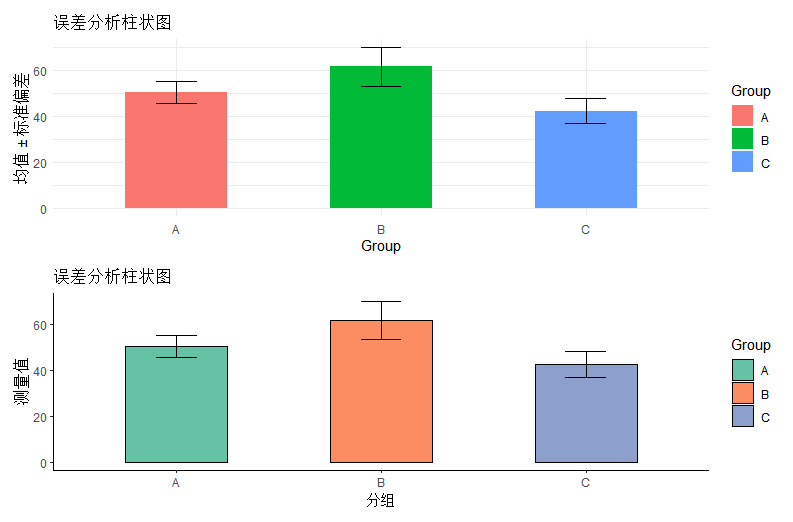
combined_vertical <- p1 / p2 + plot_layout(nrow = 2)
print(combined_vertical)
r
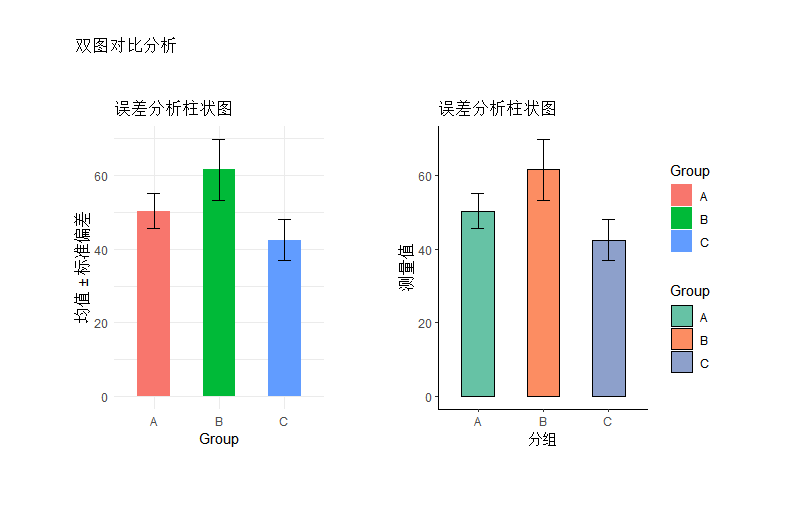
combined_horizontal +
  plot_annotation(title = "双图对比分析") +
  plot_layout(guides = "collect") &
  theme(plot.margin = unit(c(1,1,1,1), "cm"))
总结
柱状图是所有图像的基础,尝试建立不同的柱状图,在基本的格式基础上更改参数,多练习多尝试,加油吧小伙伴们。