1. 引言:AI技术概述及其在各行业的重要性
人工智能(AI)技术近年来取得了突破性进展,从理论研究走向了广泛的商业应用。AI的核心技术包括机器学习、深度学习、自然语言处理、计算机视觉等,这些技术正在深刻改变各行各业的运营模式和服务方式。
在金融领域,AI提高了风险控制能力,优化了投资决策,并改善了客户服务体验;在医疗领域,AI辅助诊断、药物研发和个性化治疗方案正在改变传统的医疗模式;在教育领域,AI实现了个性化学习和智能教学评估;在制造业领域,AI推动了智能制造、预测性维护和质量控制的发展。
随着计算能力的提升、大数据的积累和算法的优化,AI技术正在从实验室走向实际应用场景,为各行业带来效率提升、成本降低和创新服务。本文将详细探讨AI在金融、医疗、教育和制造业四大领域的具体落地案例,并通过代码、流程图、Prompt示例和图表等方式展示这些应用的实际效果。
2. AI在金融领域的应用案例
2.1 智能风控系统
金融行业的核心是风险管理,而AI技术正在革新传统的风控模式。智能风控系统通过机器学习算法分析大量历史数据,识别潜在风险,预测违约概率,从而帮助金融机构做出更准确的信贷决策。
案例描述:某银行的智能信贷风控系统
该银行利用AI技术构建了全面的信贷风控系统,整合了客户的交易记录、信用历史、社交网络等多维度数据,通过深度学习模型评估客户的信用风险。系统上线后,贷款审批时间从原来的3天缩短至10分钟,坏账率降低了25%。
代码示例:基于XGBoost的信用评分模型
import pandas as pd
import numpy as np
from sklearn.model_selection import train_test_split
from sklearn.metrics import accuracy_score, roc_auc_score
import xgboost as xgb
import matplotlib.pyplot as plt

# 加载数据
data = pd.read_csv('loan_data.csv')

# 数据预处理
def preprocess_data(df):
    # 处理缺失值
    df = df.fillna(df.mean())

    # 特征工程
    df['debt_to_income'] = df['debt'] / df['income']
    df['payment_to_income'] = df['payment'] / df['income']

    # 类别变量编码
    categorical_cols = ['employment', 'home_ownership', 'loan_purpose']
    df = pd.get_dummies(df, columns=categorical_cols, drop_first=True)

    return df

data = preprocess_data(data)

# 划分特征和目标变量
X = data.drop('loan_status', axis=1)
y = data['loan_status']

# 划分训练集和测试集
X_train, X_test, y_train, y_test = train_test_split(X, y, test_size=0.2, random_state=42)

# 训练XGBoost模型
model = xgb.XGBClassifier(
    n_estimators=100,
    max_depth=5,
    learning_rate=0.1,
    subsample=0.8,
    colsample_bytree=0.8,
    random_state=42
)

model.fit(X_train, y_train)

# 预测和评估
y_pred = model.predict(X_test)
y_pred_proba = model.predict_proba(X_test)[:, 1]

print(f"Accuracy: {accuracy_score(y_test, y_pred):.4f}")
print(f"AUC: {roc_auc_score(y_test, y_pred_proba):.4f}")

# 特征重要性可视化
plt.figure(figsize=(10, 6))
xgb.plot_importance(model, max_num_features=10)
plt.title('Feature Importance')
plt.show()
Mermaid流程图:智能风控系统流程
flowchart TD
    A[客户申请贷款] --> B[数据收集]
    B --> C[数据预处理]
    C --> D[特征工程]
    D --> E[AI模型评分]
    E --> F{风险等级判断}
    F -->|低风险| G[自动批准]
    F -->|中风险| H[人工审核]
    F -->|高风险| I[拒绝申请]
    H --> J[最终决策]
    G --> K[放款]
    J --> K
    I --> L[通知客户]
    K --> M[贷后监控]
    M --> N[行为数据更新]
    N --> E
Prompt示例:用于生成风控报告的AI提示
你是一名金融风控专家,请根据以下客户数据生成一份风控评估报告:

客户信息:
- 姓名:张三
- 年龄:35岁
- 职业:IT工程师
- 月收入:15,000元
- 工作年限:8年
- 信用历史:无逾期记录
- 负债情况:房贷月供5,000元,信用卡总额度50,000元,已使用30,000元
- 申请贷款金额:200,000元
- 贷款期限:36个月

请从以下几个方面进行评估:
1. 客户的基本信用状况
2. 还款能力分析
3. 潜在风险点
4. 建议的贷款条件和利率
5. 其他需要关注的事项

请以专业、客观的语言撰写报告,并给出明确的建议。
图表:风控模型性能评估
| 模型类型 | 准确率 | 召回率 | F1分数 | AUC |
|---|---|---|---|---|
| 传统逻辑回归 | 0.82 | 0.75 | 0.78 | 0.81 |
| 随机森林 | 0.85 | 0.79 | 0.82 | 0.87 |
| XGBoost | 0.88 | 0.83 | 0.85 | 0.91 |
| 神经网络 | 0.86 | 0.81 | 0.83 | 0.89 |
2.2 智能投顾系统
智能投顾是AI在金融领域的另一重要应用,它利用算法和机器学习技术为投资者提供个性化的投资建议和资产配置方案。
案例描述:某金融科技公司的智能投顾平台
该平台通过分析客户的风险偏好、投资目标、财务状况等信息,结合市场数据和宏观经济指标,利用AI算法生成个性化的投资组合建议。平台上线后,客户投资组合的平均年化收益率提升了3.2%,客户满意度达到92%。
代码示例:基于现代投资组合理论的资产配置优化
import numpy as np
import pandas as pd
import matplotlib.pyplot as plt
import cvxpy as cp
from datetime import datetime, timedelta

# 获取资产价格数据
def get_asset_data():
    # 这里使用模拟数据,实际应用中可以从API获取真实数据
    np.random.seed(42)
    dates = pd.date_range(start='2020-01-01', end='2023-01-01')
    assets = ['股票', '债券', '商品', '房地产', '现金']

    # 生成模拟收益率
    returns = pd.DataFrame(np.random.normal(0.001, 0.02, (len(dates), len(assets))),
                          index=dates, columns=assets)

    # 调整不同资产的风险收益特征
    returns['股票'] *= 2.5  # 股票风险收益更高
    returns['债券'] *= 0.7  # 债券风险收益更低
    returns['现金'] *= 0.1  # 现金几乎无风险

    return returns

returns = get_asset_data()

# 计算年化收益率和协方差矩阵
mean_returns = returns.mean() * 252  # 年化收益率
cov_matrix = returns.cov() * 252     # 年化协方差矩阵

# 定义资产数量
num_assets = len(mean_returns)

# 设置优化变量
weights = cp.Variable(num_assets)

# 设置目标函数 - 最大化夏普比率
risk_free_rate = 0.02
portfolio_return = mean_returns.values @ weights
portfolio_risk = cp.quad_form(weights, cov_matrix.values)
sharpe_ratio = (portfolio_return - risk_free_rate) / cp.sqrt(portfolio_risk)

# 设置约束条件
constraints = [
    cp.sum(weights) == 1,  # 权重和为1
    weights >= 0,          # 不允许做空
]

# 定义并求解优化问题
objective = cp.Maximize(sharpe_ratio)
problem = cp.Problem(objective, constraints)
problem.solve()

# 获取最优权重
optimal_weights = weights.value

# 打印结果
print("最优资产配置:")
for asset, weight in zip(mean_returns.index, optimal_weights):
    print(f"{asset}: {weight:.2%}")

# 可视化资产配置
plt.figure(figsize=(10, 6))
plt.pie(optimal_weights, labels=mean_returns.index, autopct='%1.1f%%')
plt.title('最优资产配置')
plt.show()

# 计算并可视化有效前沿
frontier_returns = []
frontier_risks = []

for target_return in np.linspace(min(mean_returns), max(mean_returns), 50):
    # 设置约束条件
    constraints = [
        cp.sum(weights) == 1,
        weights >= 0,
        mean_returns.values @ weights == target_return
    ]

    # 定义并求解优化问题(最小化风险)
    objective = cp.Minimize(cp.sqrt(portfolio_risk))
    problem = cp.Problem(objective, constraints)
    problem.solve()

    if problem.status == 'optimal':
        frontier_returns.append(target_return)
        frontier_risks.append(cp.sqrt(portfolio_risk).value)

# 绘制有效前沿
plt.figure(figsize=(10, 6))
plt.plot(frontier_risks, frontier_returns, 'b-', label='有效前沿')
plt.scatter(np.sqrt(np.diag(cov_matrix)), mean_returns, c='red', label='单个资产')
plt.scatter(np.sqrt(optimal_weights.T @ cov_matrix.values @ optimal_weights),
            mean_returns.values @ optimal_weights, c='green', s=100, label='最优组合')
plt.xlabel('风险(标准差)')
plt.ylabel('预期收益率')
plt.title('投资组合有效前沿')
plt.legend()
plt.grid(True)
plt.show()
Mermaid流程图:智能投顾系统工作流程
flowchart TD
    A[客户风险评估] --> B[投资目标设定]
    B --> C[市场数据分析]
    C --> D[资产配置模型]
    D --> E[投资组合生成]
    E --> F[客户确认]
    F -->|确认| G[执行投资]
    F -->|调整| H[修改参数]
    H --> D
    G --> I[持续监控]
    I --> J{市场变化检测}
    J -->|显著变化| K[再平衡建议]
    J -->|正常| I
    K --> L[客户确认]
    L -->|确认| M[执行再平衡]
    M --> I
Prompt示例:生成投资建议的AI提示
你是一名专业的投资顾问,请根据以下客户信息提供个性化的投资建议:

客户信息:
- 姓名:李四
- 年龄:45岁
- 职业:企业高管
- 家庭状况:已婚,有两个孩子(一个上大学,一个上高中)
- 月收入:50,000元
- 月支出:30,000元
- 现有资产:银行存款500,000元,股票投资300,000元,房产一套(市值3,000,000元,贷款余额1,500,000元)
- 投资经验:5年,中等风险承受能力
- 投资目标:10年后积累2,000,000元用于子女教育和退休规划
- 投资期限:中长期(10年以上)

请提供以下内容:
1. 客户财务状况分析
2. 风险评估结果
3. 资产配置建议(包括各大类资产的建议比例)
4. 具体投资产品推荐(至少3-5种)
5. 投资策略和预期收益
6. 风险提示和注意事项

请以专业、易懂的语言撰写建议,并考虑客户的实际情况和需求。
图表:不同风险偏好下的资产配置比例
| 风险偏好 | 股票 | 债券 | 商品 | 房地产 | 现金 |
|---|---|---|---|---|---|
| 保守型 | 20% | 50% | 5% | 15% | 10% |
| 稳健型 | 40% | 35% | 5% | 15% | 5% |
| 平衡型 | 55% | 25% | 5% | 10% | 5% |
| 进取型 | 70% | 15% | 5% | 5% | 5% |
| 激进型 | 85% | 5% | 5% | 5% | 0% |
3. AI在医疗领域的应用案例
3.1 医学影像智能诊断
AI在医学影像诊断领域的应用已经取得了显著成果,特别是在放射学、病理学和皮肤科等领域。深度学习算法可以分析医学影像,帮助医生更准确地检测疾病。
案例描述:某三甲医院的AI辅助肺部CT诊断系统
该医院引入了基于深度学习的AI辅助诊断系统,用于分析肺部CT影像,检测肺结节、肺炎、肺结核等疾病。系统经过数万例标注数据的训练,能够自动识别和标记可疑病灶,并提供良恶性预测。系统上线后,早期肺癌检出率提高了23%,诊断时间缩短了60%,医生诊断准确率提升了15%。
代码示例:基于卷积神经网络的肺结节检测
import numpy as np
import pandas as pd
import matplotlib.pyplot as plt
import tensorflow as tf
from tensorflow.keras import layers, models
from sklearn.model_selection import train_test_split
from sklearn.metrics import accuracy_score, confusion_matrix, classification_report
import cv2
import os

# 数据预处理
def load_data(data_dir):
    images = []
    labels = []

    # 加载正样本(含结节)
    positive_dir = os.path.join(data_dir, 'positive')
    for filename in os.listdir(positive_dir):
        img_path = os.path.join(positive_dir, filename)
        img = cv2.imread(img_path, cv2.IMREAD_GRAYSCALE)
        img = cv2.resize(img, (64, 64))  # 调整图像大小
        img = img / 255.0  # 归一化
        images.append(img)
        labels.append(1)  # 1表示有结节

    # 加载负样本(无结节)
    negative_dir = os.path.join(data_dir, 'negative')
    for filename in os.listdir(negative_dir):
        img_path = os.path.join(negative_dir, filename)
        img = cv2.imread(img_path, cv2.IMREAD_GRAYSCALE)
        img = cv2.resize(img, (64, 64))
        img = img / 255.0
        images.append(img)
        labels.append(0)  # 0表示无结节

    return np.array(images), np.array(labels)

# 加载数据
X, y = load_data('lung_ct_data')

# 调整数据形状以适应CNN输入
X = X.reshape(X.shape[0], X.shape[1], X.shape[2], 1)

# 划分训练集和测试集
X_train, X_test, y_train, y_test = train_test_split(X, y, test_size=0.2, random_state=42)

# 构建CNN模型
def build_model():
    model = models.Sequential([
        layers.Conv2D(32, (3, 3), activation='relu', input_shape=(64, 64, 1)),
        layers.MaxPooling2D((2, 2)),
        layers.Conv2D(64, (3, 3), activation='relu'),
        layers.MaxPooling2D((2, 2)),
        layers.Conv2D(64, (3, 3), activation='relu'),
        layers.Flatten(),
        layers.Dense(64, activation='relu'),
        layers.Dropout(0.5),
        layers.Dense(1, activation='sigmoid')
    ])

    model.compile(optimizer='adam',
                  loss='binary_crossentropy',
                  metrics=['accuracy'])

    return model

# 创建模型
model = build_model()

# 训练模型
history = model.fit(
    X_train, y_train,
    epochs=20,
    batch_size=32,
    validation_split=0.2
)

# 评估模型
test_loss, test_acc = model.evaluate(X_test, y_test)
print(f"Test accuracy: {test_acc:.4f}")

# 预测
y_pred = model.predict(X_test)
y_pred_binary = (y_pred > 0.5).astype(int)

# 打印分类报告
print(classification_report(y_test, y_pred_binary))

# 绘制混淆矩阵
cm = confusion_matrix(y_test, y_pred_binary)
plt.figure(figsize=(8, 6))
plt.imshow(cm, interpolation='nearest', cmap=plt.cm.Blues)
plt.title('Confusion Matrix')
plt.colorbar()
tick_marks = np.arange(2)
plt.xticks(tick_marks, ['Negative', 'Positive'])
plt.yticks(tick_marks, ['Negative', 'Positive'])
plt.xlabel('Predicted Label')
plt.ylabel('True Label')

# 在混淆矩阵每个单元格中添加数字
thresh = cm.max() / 2.
for i in range(cm.shape[0]):
    for j in range(cm.shape[1]):
        plt.text(j, i, cm[i, j],
                 horizontalalignment="center",
                 color="white" if cm[i, j] > thresh else "black")

plt.tight_layout()
plt.show()

# 绘制训练历史
plt.figure(figsize=(12, 4))
plt.subplot(1, 2, 1)
plt.plot(history.history['accuracy'], label='Training Accuracy')
plt.plot(history.history['val_accuracy'], label='Validation Accuracy')
plt.title('Accuracy over Epochs')
plt.xlabel('Epoch')
plt.ylabel('Accuracy')
plt.legend()

plt.subplot(1, 2, 2)
plt.plot(history.history['loss'], label='Training Loss')
plt.plot(history.history['val_loss'], label='Validation Loss')
plt.title('Loss over Epochs')
plt.xlabel('Epoch')
plt.ylabel('Loss')
plt.legend()

plt.tight_layout()
plt.show()

# 可视化一些预测结果
def visualize_predictions(X, y_true, y_pred, num_samples=5):
    plt.figure(figsize=(15, 5))
    indices = np.random.choice(len(X), num_samples, replace=False)

    for i, idx in enumerate(indices):
        plt.subplot(1, num_samples, i+1)
        plt.imshow(X[idx].reshape(64, 64), cmap='gray')
        true_label = "Positive" if y_true[idx] == 1 else "Negative"
        pred_label = "Positive" if y_pred[idx] > 0.5 else "Negative"
        color = 'green' if true_label == pred_label else 'red'
        plt.title(f"True: {true_label}\nPred: {pred_label}", color=color)
        plt.axis('off')

    plt.tight_layout()
    plt.show()

visualize_predictions(X_test, y_test, y_pred)
Mermaid流程图:AI辅助医学影像诊断流程
flowchart TD
    A[患者CT扫描] --> B[图像预处理]
    B --> C[AI模型分析]
    C --> D[病灶检测]
    D --> E[良恶性预测]
    E --> F[生成诊断报告]
    F --> G[医生审核]
    G --> H{医生判断}
    H -->|同意| I[确认诊断]
    H -->|修改| J[调整诊断结果]
    J --> K[更新AI模型]
    I --> L[制定治疗方案]
    K --> C
Prompt示例:生成医学影像诊断报告的AI提示
你是一名放射科医生,请根据以下CT影像分析结果生成一份诊断报告:

患者信息:
- 姓名:王五
- 性别:男
- 年龄:62岁
- 临床症状:咳嗽2个月,偶有痰中带血
- 吸烟史:30年,每天20支

CT影像分析结果:
- 右肺上叶尖段见一不规则结节,大小约1.8cm×1.5cm,边缘毛糙,可见毛刺征
- 结节密度不均匀,内部可见小空洞形成
- 纵隔窗未见明显肿大淋巴结
- 双肺未见其他明显异常
- AI系统分析:恶性概率85%

请撰写一份完整的诊断报告,包括以下内容:
1. 影像学检查方法和技术参数
2. 影像学表现详细描述
3. 与既往检查对比(如有)
4. 诊断意见和鉴别诊断
5. 建议进一步检查或治疗方案
6. 报告医生签名和日期

请使用专业、准确的医学术语,并保持客观、严谨的态度。
图表:AI辅助诊断系统性能对比
| 诊断方法 | 敏感性 | 特异性 | 准确率 | AUC |
|---|---|---|---|---|
| 初级医生 | 0.72 | 0.76 | 0.74 | 0.75 |
| 资深医生 | 0.85 | 0.88 | 0.86 | 0.89 |
| AI系统 | 0.91 | 0.89 | 0.90 | 0.94 |
| AI+资深医生 | 0.96 | 0.95 | 0.95 | 0.98 |
3.2 智能药物研发
AI在药物研发领域的应用正在加速新药发现和开发过程,通过预测分子结构、筛选候选化合物和优化药物设计,大大缩短了研发周期和降低了成本。
案例描述:某制药公司的AI辅助药物发现平台
该公司利用深度学习和生成式AI技术构建了药物发现平台,能够预测分子与靶点的相互作用,生成新的候选分子结构,并预测其药理特性和安全性。该平台成功将一款抗癌药物的研发周期从传统的5年缩短至2年,研发成本降低了60%。
代码示例:基于图神经网络的分子性质预测
import numpy as np
import pandas as pd
import torch
import torch.nn as nn
import torch.optim as optim
from torch_geometric.data import Data, DataLoader
from torch_geometric.nn import GCNConv, global_mean_pool
from rdkit import Chem
from rdkit.Chem import AllChem
import matplotlib.pyplot as plt
from sklearn.model_selection import train_test_split
from sklearn.metrics import mean_squared_error, r2_score
import os

# 分子图数据准备
def mol_to_graph(mol, y=None):
    # 获取原子特征
    atom_features = []
    for atom in mol.GetAtoms():
        features = [
            atom.GetAtomicNum(),
            atom.GetDegree(),
            atom.GetFormalCharge(),
            atom.GetNumRadicalElectrons(),
            atom.GetHybridization().real,
            atom.GetIsAromatic(),
        ]
        atom_features.append(features)

    x = torch.tensor(atom_features, dtype=torch.float)

    # 获取边索引
    edges = []
    for bond in mol.GetBonds():
        i = bond.GetBeginAtomIdx()
        j = bond.GetEndAtomIdx()
        edges.append((i, j))
        edges.append((j, i))  # 无向图

    edge_index = torch.tensor(edges, dtype=torch.long).t().contiguous()

    # 创建图数据对象
    data = Data(x=x, edge_index=edge_index)

    if y is not None:
        data.y = torch.tensor([y], dtype=torch.float)

    return data

# 加载分子数据
def load_molecular_data(csv_file):
    df = pd.read_csv(csv_file)
    graphs = []

    for _, row in df.iterrows():
        smiles = row['smiles']
        y = row['property_value']

        # 将SMILES转换为分子对象
        mol = Chem.MolFromSmiles(smiles)
        if mol is not None:
            # 添加氢原子
            mol = Chem.AddHs(mol)
            # 生成3D构象
            AllChem.EmbedMolecule(mol, randomSeed=42)
            # 转换为图数据
            graph = mol_to_graph(mol, y)
            graphs.append(graph)

    return graphs

# 加载数据
data_list = load_molecular_data('molecular_properties.csv')

# 划分训练集和测试集
train_data, test_data = train_test_split(data_list, test_size=0.2, random_state=42)

# 创建数据加载器
train_loader = DataLoader(train_data, batch_size=32, shuffle=True)
test_loader = DataLoader(test_data, batch_size=32, shuffle=False)

# 定义GNN模型
class MolecularGNN(nn.Module):
    def __init__(self, hidden_dim=64, output_dim=1):
        super(MolecularGNN, self).__init__()

        # 图卷积层
        self.conv1 = GCNConv(6, hidden_dim)  # 输入特征维度为6
        self.conv2 = GCNConv(hidden_dim, hidden_dim)
        self.conv3 = GCNConv(hidden_dim, hidden_dim)

        # 全连接层
        self.fc1 = nn.Linear(hidden_dim, hidden_dim)
        self.fc2 = nn.Linear(hidden_dim, output_dim)

        # 激活函数和dropout
        self.relu = nn.ReLU()
        self.dropout = nn.Dropout(0.5)

    def forward(self, data):
        x, edge_index, batch = data.x, data.edge_index, data.batch

        # 图卷积
        x = self.conv1(x, edge_index)
        x = self.relu(x)
        x = self.conv2(x, edge_index)
        x = self.relu(x)
        x = self.conv3(x, edge_index)

        # 全局池化
        x = global_mean_pool(x, batch)

        # 全连接层
        x = self.fc1(x)
        x = self.relu(x)
        x = self.dropout(x)
        x = self.fc2(x)

        return x

# 初始化模型
model = MolecularGNN()
optimizer = optim.Adam(model.parameters(), lr=0.001)
criterion = nn.MSELoss()

# 训练模型
def train(model, train_loader, optimizer, criterion, device):
    model.train()
    total_loss = 0

    for data in train_loader:
        data = data.to(device)
        optimizer.zero_grad()
        output = model(data)
        loss = criterion(output, data.y.view(-1, 1))
        loss.backward()
        optimizer.step()
        total_loss += loss.item() * data.num_graphs

    return total_loss / len(train_loader.dataset)

# 测试模型
def test(model, test_loader, device):
    model.eval()
    predictions = []
    targets = []

    with torch.no_grad():
        for data in test_loader:
            data = data.to(device)
            output = model(data)
            predictions.extend(output.cpu().numpy())
            targets.extend(data.y.cpu().numpy())

    predictions = np.array(predictions).flatten()
    targets = np.array(targets)

    mse = mean_squared_error(targets, predictions)
    r2 = r2_score(targets, predictions)

    return mse, r2, predictions, targets

# 训练循环
device = torch.device('cuda' if torch.cuda.is_available() else 'cpu')
model = model.to(device)

train_losses = []
test_mses = []
test_r2s = []

num_epochs = 100
for epoch in range(1, num_epochs + 1):
    train_loss = train(model, train_loader, optimizer, criterion, device)
    mse, r2, _, _ = test(model, test_loader, device)

    train_losses.append(train_loss)
    test_mses.append(mse)
    test_r2s.append(r2)

    if epoch % 10 == 0:
        print(f'Epoch: {epoch:03d}, Train Loss: {train_loss:.4f}, Test MSE: {mse:.4f}, Test R²: {r2:.4f}')

# 最终评估
final_mse, final_r2, predictions, targets = test(model, test_loader, device)
print(f'Final Test MSE: {final_mse:.4f}')
print(f'Final Test R²: {final_r2:.4f}')

# 绘制训练历史
plt.figure(figsize=(12, 4))
plt.subplot(1, 2, 1)
plt.plot(train_losses, label='Training Loss')
plt.title('Training Loss over Epochs')
plt.xlabel('Epoch')
plt.ylabel('Loss')
plt.legend()

plt.subplot(1, 2, 2)
plt.plot(test_r2s, label='Test R²')
plt.title('Test R² over Epochs')
plt.xlabel('Epoch')
plt.ylabel('R²')
plt.legend()

plt.tight_layout()
plt.show()

# 绘制预测值与真实值对比图
plt.figure(figsize=(8, 8))
plt.scatter(targets, predictions, alpha=0.5)
plt.plot([min(targets), max(targets)], [min(targets), max(targets)], 'r--')
plt.xlabel('True Values')
plt.ylabel('Predicted Values')
plt.title('True vs Predicted Molecular Properties')
plt.grid(True)
plt.show()
Mermaid流程图:AI辅助药物研发流程
flowchart TD
    A[疾病靶点识别] --> B[化合物库筛选]
    B --> C[分子生成与优化]
    C --> D[分子性质预测]
    D --> E[候选分子筛选]
    E --> F[体外实验验证]
    F --> G{实验结果}
    G -->|符合预期| H[体内实验]
    G -->|不符合预期| I[调整分子结构]
    I --> C
    H --> J{临床前研究}
    J -->|通过| K[临床试验]
    J -->|失败| L[终止研发]
    K --> M{临床试验结果}
    M -->|成功| N[药物上市]
    M -->|失败| L
Prompt示例:生成药物分子设计建议的AI提示
你是一名药物化学专家,请根据以下信息设计一种针对特定靶点的新型抑制剂分子:

靶点信息:
- 靶点名称:EGFR(表皮生长因子受体)
- 靶点类型:酪氨酸激酶
- 疾病领域:非小细胞肺癌
- 已知抑制剂:吉非替尼、厄洛替尼、奥希替尼
- 作用机制:ATP竞争性抑制剂
- 关键结合位点:Thr790, Met793, Cys797

设计要求:
1. 提高对T790M突变体的选择性
2. 改善血脑屏障穿透性
3. 降低对野生型EGFR的毒性
4. 优化口服生物利用度
5. 考虑合成可行性

请提供以下内容:
1. 分子设计策略和思路
2. 建议的分子骨架结构
3. 关键官能团和取代基
4. 预期的分子性质(如分子量、logP、氢键供体/受体数量等)
5. 合成路线建议
6. 潜在的优化方向

请使用专业、准确的化学术语,并考虑药物化学的基本原理。
图表:AI辅助药物研发与传统方法对比
| 指标 | 传统方法 | AI辅助方法 | 改进幅度 |
|---|---|---|---|
| 候选化合物筛选时间 | 12-18个月 | 2-3个月 | 缩短80% |
| 临床前成功率 | 10% | 25% | 提高150% |
| 研发成本 | 20-30亿美元 | 8-12亿美元 | 降低60% |
| 研发周期 | 10-15年 | 5-8年 | 缩短50% |
| 专利申请数量 | 每年50-100个 | 每年200-300个 | 增加200% |
4. AI在教育领域的应用案例
4.1 智能个性化学习系统
AI技术正在改变传统教育模式,通过分析学生的学习行为、知识掌握程度和学习风格,为每个学生提供个性化的学习路径和内容推荐。
案例描述:某在线教育平台的智能学习系统
该平台利用机器学习算法分析学生的学习数据,包括答题正确率、学习时间、知识点掌握情况等,构建知识图谱和学习者模型。系统能够实时调整学习内容难度,推荐个性化学习资源,并提供精准的学习反馈。平台上线后,学生学习效率提高了40%,课程完成率提升了35%,学习满意度达到90%以上。
代码示例:基于知识图谱的个性化学习推荐系统
import numpy as np
import pandas as pd
import networkx as nx
import matplotlib.pyplot as plt
from sklearn.cluster import KMeans
from sklearn.decomposition import PCA
from sklearn.metrics.pairwise import cosine_similarity
import json
import random

# 构建知识图谱
class KnowledgeGraph:
    def __init__(self):
        self.graph = nx.DiGraph()
        self.concepts = {}
        self.relations = []

    def add_concept(self, concept_id, name, difficulty, description=""):
        self.concepts[concept_id] = {
            'name': name,
            'difficulty': difficulty,
            'description': description
        }
        self.graph.add_node(concept_id, name=name, difficulty=difficulty)

    def add_relation(self, source_id, target_id, relation_type="prerequisite"):
        self.relations.append((source_id, target_id, relation_type))
        self.graph.add_edge(source_id, target_id, relation_type=relation_type)

    def visualize(self, figsize=(12, 10)):
        plt.figure(figsize=figsize)
        pos = nx.spring_layout(self.graph, seed=42)

        # 根据难度设置节点颜色
        node_colors = [self.graph.nodes[node]['difficulty'] for node in self.graph.nodes()]

        # 绘制节点
        nodes = nx.draw_networkx_nodes(
            self.graph, pos,
            node_color=node_colors,
            cmap=plt.cm.viridis,
            alpha=0.8
        )

        # 绘制边
        nx.draw_networkx_edges(self.graph, pos, alpha=0.5, arrows=True)

        # 绘制标签
        labels = {node: self.graph.nodes[node]['name'] for node in self.graph.nodes()}
        nx.draw_networkx_labels(self.graph, pos, labels, font_size=10)

        # 添加颜色条
        plt.colorbar(nodes, label='Difficulty')
        plt.title('Knowledge Graph')
        plt.axis('off')
        plt.show()

    def get_prerequisites(self, concept_id):
        """获取某个知识点的前置知识点"""
        return list(self.graph.predecessors(concept_id))

    def get_dependents(self, concept_id):
        """获取依赖于某个知识点的后续知识点"""
        return list(self.graph.successors(concept_id))

    def get_learning_path(self, start_id, end_id):
        """获取从起始知识点到目标知识点的学习路径"""
        try:
            return nx.shortest_path(self.graph, start_id, end_id)
        except nx.NetworkXNoPath:
            return None

# 创建知识图谱
kg = KnowledgeGraph()

# 添加数学知识点
kg.add_concept("M001", "基础算术", 1, "加减乘除等基本运算")
kg.add_concept("M002", "分数", 2, "分数的概念和运算")
kg.add_concept("M003", "小数", 2, "小数的概念和运算")
kg.add_concept("M004", "代数基础", 3, "变量、表达式和方程")
kg.add_concept("M005", "一元一次方程", 4, "一元一次方程的解法")
kg.add_concept("M006", "一元二次方程", 5, "一元二次方程的解法")
kg.add_concept("M007", "函数基础", 4, "函数的概念和性质")
kg.add_concept("M008", "线性函数", 5, "线性函数的图像和性质")
kg.add_concept("M009", "二次函数", 6, "二次函数的图像和性质")
kg.add_concept("M010", "指数函数", 6, "指数函数的图像和性质")
kg.add_concept("M011", "对数函数", 7, "对数函数的图像和性质")
kg.add_concept("M012", "三角函数", 7, "三角函数的图像和性质")

# 添加知识点之间的关系
kg.add_relation("M001", "M002")
kg.add_relation("M001", "M003")
kg.add_relation("M002", "M004")
kg.add_relation("M003", "M004")
kg.add_relation("M004", "M005")
kg.add_relation("M005", "M006")
kg.add_relation("M004", "M007")
kg.add_relation("M007", "M008")
kg.add_relation("M007", "M009")
kg.add_relation("M007", "M010")
kg.add_relation("M010", "M011")
kg.add_relation("M008", "M012")

# 可视化知识图谱
kg.visualize()

# 学生模型
class StudentModel:
    def __init__(self, student_id, name):
        self.student_id = student_id
        self.name = name
        self.knowledge_mastery = {}  # 知识点掌握程度
        self.learning_history = []    # 学习历史
        self.learning_style = {}      # 学习风格
        self.preferences = {}        # 学习偏好

    def update_knowledge_mastery(self, concept_id, mastery_level):
        """更新知识点掌握程度"""
        self.knowledge_mastery[concept_id] = mastery_level

    def add_learning_record(self, concept_id, resource_type, time_spent, performance):
        """添加学习记录"""
        record = {
            'concept_id': concept_id,
            'resource_type': resource_type,
            'time_spent': time_spent,
            'performance': performance,
            'timestamp': pd.Timestamp.now()
        }
        self.learning_history.append(record)

    def get_weak_concepts(self, threshold=0.6):
        """获取掌握程度较弱的知识点"""
        return [concept_id for concept_id, mastery in self.knowledge_mastery.items()
                if mastery < threshold]

    def get_ready_concepts(self, knowledge_graph, mastery_threshold=0.7):
        """获取准备好学习的知识点(前置知识点已掌握)"""
        ready_concepts = []

        for concept_id in knowledge_graph.graph.nodes():
            # 检查是否已经学习过
            if concept_id in self.knowledge_mastery:
                continue

            # 检查前置知识点是否已掌握
            prerequisites = knowledge_graph.get_prerequisites(concept_id)
            all_prereqs_mastered = all(
                self.knowledge_mastery.get(prereq, 0) >= mastery_threshold
                for prereq in prerequisites
            )

            if all_prereqs_mastered:
                ready_concepts.append(concept_id)

        return ready_concepts

# 创建学生模型
student = StudentModel("S001", "张三")

# 初始化学生知识点掌握情况
for concept_id in kg.concepts:
    # 随机初始化掌握程度,模拟学生已有知识
    mastery = random.uniform(0, 0.7) if random.random() > 0.3 else random.uniform(0.7, 1.0)
    student.update_knowledge_mastery(concept_id, mastery)

# 个性化学习推荐系统
class PersonalizedLearningRecommender:
    def __init__(self, knowledge_graph, resource_database):
        self.knowledge_graph = knowledge_graph
        self.resource_database = resource_database

    def recommend_concepts(self, student, num_recommendations=3):
        """推荐要学习的知识点"""
        # 获取学生准备好学习的知识点
        ready_concepts = student.get_ready_concepts(self.knowledge_graph)

        if not ready_concepts:
            return []

        # 根据学习风格和偏好对知识点进行排序
        concept_scores = []
        for concept_id in ready_concepts:
            # 基础分数:知识点难度与学生当前水平的匹配度
            concept_difficulty = self.knowledge_graph.concepts[concept_id]['difficulty']
            avg_mastery = np.mean(list(student.knowledge_mastery.values()))
            difficulty_match = 1 - abs(concept_difficulty - avg_mastery * 10) / 10

            # 调整分数:考虑知识点的重要性(连接度)
            importance = len(self.knowledge_graph.get_dependents(concept_id))

            # 综合分数
            score = 0.7 * difficulty_match + 0.3 * (importance / 10)
            concept_scores.append((concept_id, score))

        # 按分数排序并返回推荐
        concept_scores.sort(key=lambda x: x[1], reverse=True)
        return [concept_id for concept_id, _ in concept_scores[:num_recommendations]]

    def recommend_resources(self, student, concept_id, num_recommendations=5):
        """推荐学习资源"""
        # 获取与知识点相关的资源
        related_resources = [
            resource for resource in self.resource_database
            if concept_id in resource['related_concepts']
        ]

        if not related_resources:
            return []

        # 根据学生偏好对资源进行排序
        resource_scores = []
        for resource in related_resources:
            score = 0

            # 基于资源类型的偏好
            if 'resource_type' in student.preferences:
                preferred_types = student.preferences['resource_type']
                if resource['type'] in preferred_types:
                    score += 0.4

            # 基于资源难度的匹配
            if 'difficulty' in resource:
                concept_difficulty = self.knowledge_graph.concepts[concept_id]['difficulty']
                difficulty_match = 1 - abs(resource['difficulty'] - concept_difficulty) / 10
                score += 0.3 * difficulty_match

            # 基于资源评分
            if 'rating' in resource:
                score += 0.3 * resource['rating']

            resource_scores.append((resource, score))

        # 按分数排序并返回推荐
        resource_scores.sort(key=lambda x: x[1], reverse=True)
        return [resource for resource, _ in resource_scores[:num_recommendations]]

    def generate_learning_path(self, student, target_concept_id):
        """生成到目标知识点的学习路径"""
        # 获取到目标知识点的理论路径
        path = self.knowledge_graph.get_learning_path("M001", target_concept_id)

        if not path:
            return []

        # 筛选出学生需要学习的知识点
        learning_path = []
        for concept_id in path:
            mastery = student.knowledge_mastery.get(concept_id, 0)
            if mastery < 0.8:  # 掌握程度低于80%需要学习
                learning_path.append(concept_id)

        return learning_path

# 创建资源数据库
resource_database = [
    {
        'id': 'R001',
        'title': '基础算术视频教程',
        'type': 'video',
        'difficulty': 1,
        'duration': 45,
        'related_concepts': ['M001'],
        'rating': 4.7
    },
    {
        'id': 'R002',
        'title': '基础算术练习题集',
        'type': 'exercise',
        'difficulty': 1,
        'duration': 30,
        'related_concepts': ['M001'],
        'rating': 4.5
    },
    {
        'id': 'R003',
        'title': '分数概念互动课程',
        'type': 'interactive',
        'difficulty': 2,
        'duration': 40,
        'related_concepts': ['M002'],
        'rating': 4.8
    },
    {
        'id': 'R004',
        'title': '分数运算练习',
        'type': 'exercise',
        'difficulty': 2,
        'duration': 25,
        'related_concepts': ['M002'],
        'rating': 4.3
    },
    {
        'id': 'R005',
        'title': '小数与分数转换',
        'type': 'interactive',
        'difficulty': 2,
        'duration': 35,
        'related_concepts': ['M002', 'M003'],
        'rating': 4.6
    },
    {
        'id': 'R006',
        'title': '代数基础入门',
        'type': 'video',
        'difficulty': 3,
        'duration': 50,
        'related_concepts': ['M004'],
        'rating': 4.9
    },
    {
        'id': 'R007',
        'title': '一元一次方程解法',
        'type': 'video',
        'difficulty': 4,
        'duration': 55,
        'related_concepts': ['M005'],
        'rating': 4.8
    },
    {
        'id': 'R008',
        'title': '函数概念与图像',
        'type': 'interactive',
        'difficulty': 4,
        'duration': 45,
        'related_concepts': ['M007'],
        'rating': 4.7
    },
    {
        'id': 'R009',
        'title': '二次函数图像分析',
        'type': 'simulation',
        'difficulty': 6,
        'duration': 40,
        'related_concepts': ['M009'],
        'rating': 4.9
    },
    {
        'id': 'R010',
        'title': '三角函数应用',
        'type': 'exercise',
        'difficulty': 7,
        'duration': 30,
        'related_concepts': ['M012'],
        'rating': 4.6
    }
]

# 创建推荐系统
recommender = PersonalizedLearningRecommender(kg, resource_database)

# 设置学生偏好
student.preferences = {
    'resource_type': ['video', 'interactive'],
    'difficulty': 'medium'
}

# 推荐学习知识点
recommended_concepts = recommender.recommend_concepts(student)
print("推荐学习的知识点:")
for concept_id in recommended_concepts:
    print(f"- {kg.concepts[concept_id]['name']} (ID: {concept_id})")

# 为第一个推荐的知识点推荐学习资源
if recommended_concepts:
    concept_id = recommended_concepts[0]
    recommended_resources = recommender.recommend_resources(student, concept_id)
    print(f"\n为'{kg.concepts[concept_id]['name']}'推荐的学习资源:")
    for resource in recommended_resources:
        print(f"- {resource['title']} ({resource['type']}, 评分: {resource['rating']})")

# 生成到特定知识点的学习路径
target_concept = "M009"  # 二次函数
learning_path = recommender.generate_learning_path(student, target_concept)
print(f"\n到'{kg.concepts[target_concept]['name']}'的学习路径:")
for concept_id in learning_path:
    print(f"- {kg.concepts[concept_id]['name']} (ID: {concept_id})")

# 可视化学生知识掌握情况
def visualize_knowledge_mastery(student, knowledge_graph):
    plt.figure(figsize=(12, 8))

    # 获取知识点位置
    pos = nx.spring_layout(knowledge_graph.graph, seed=42)

    # 根据掌握程度设置节点颜色
    node_colors = []
    for node in knowledge_graph.graph.nodes():
        mastery = student.knowledge_mastery.get(node, 0)
        node_colors.append(mastery)

    # 绘制节点
    nodes = nx.draw_networkx_nodes(
        knowledge_graph.graph, pos,
        node_color=node_colors,
        cmap=plt.cm.RdYlGn,
        vmin=0, vmax=1,
        alpha=0.8
    )

    # 绘制边
    nx.draw_networkx_edges(knowledge_graph.graph, pos, alpha=0.5, arrows=True)

    # 绘制标签
    labels = {node: knowledge_graph.graph.nodes[node]['name'] for node in knowledge_graph.graph.nodes()}
    nx.draw_networkx_labels(knowledge_graph.graph, pos, labels, font_size=10)

    # 添加颜色条
    plt.colorbar(nodes, label='Mastery Level')
    plt.title(f'Student Knowledge Mastery: {student.name}')
    plt.axis('off')
    plt.show()

# 可视化学生知识掌握情况
visualize_knowledge_mastery(student, kg)
Mermaid流程图:智能个性化学习系统工作流程
flowchart TD
    A[学生登录系统] --> B[学习风格评估]
    B --> C[知识水平测试]
    C --> D[构建学生模型]
    D --> E[分析学习数据]
    E --> F[生成学习路径]
    F --> G[推荐学习资源]
    G --> H[学生学习]
    H --> I[学习行为跟踪]
    I --> J[学习效果评估]
    J --> K[更新学生模型]
    K --> E
    J --> L{学习目标达成}
    L -->|未达成| M[调整学习策略]
    M --> F
    L -->|已达成| N[设置新学习目标]
    N --> F
Prompt示例:生成个性化学习计划的AI提示
你是一名教育专家,请根据以下学生信息生成一份个性化学习计划:

学生信息:
- 姓名:李明
- 年级:初中二年级
- 年龄:14岁
- 学习科目:数学
- 当前水平:代数基础较弱,几何掌握较好
- 学习风格:视觉型学习者,喜欢通过图表和视频学习
- 学习目标:提高代数成绩,准备期末考试
- 学习时间:每天可以安排1-2小时学习
- 考试时间:30天后

学习情况分析:
- 一元一次方程:掌握程度60%
- 二元一次方程组:掌握程度40%
- 一元一次不等式:掌握程度50%
- 因式分解:掌握程度30%
- 分式方程:掌握程度20%
- 函数初步:掌握程度10%

请提供以下内容:
1. 学生学习情况分析和薄弱环节识别
2. 30天学习计划(按周划分)
3. 每周学习重点和目标
4. 推荐的学习方法和资源类型
5. 每周学习效果评估方式
6. 针对薄弱环节的强化训练建议
7. 考前复习策略

请根据学生的学习风格和特点,提供具体、可行的建议,并考虑学习内容的逻辑顺序和难度递进。
图表:个性化学习系统效果对比
| 指标 | 传统学习 | AI个性化学习 | 改进幅度 |
|---|---|---|---|
| 学习效率 | 基准值 | 提高40% | +40% |
| 课程完成率 | 55% | 90% | +35% |
| 学习满意度 | 65% | 92% | +27% |
| 知识保留率 | 45% | 78% | +33% |
| 学习时间利用率 | 60% | 85% | +25% |
4.2 智能作业批改系统
AI技术正在改变传统的作业批改方式,特别是在语言学习、数学和编程等学科中,智能批改系统能够提供即时反馈,减轻教师负担,并帮助学生及时了解自己的学习情况。
案例描述:某教育科技公司的智能作文批改系统
该公司开发的AI作文批改系统能够分析学生的作文内容,从语法、词汇、句子结构、逻辑连贯性等多个维度进行评估,并提供针对性的修改建议。系统支持中英文作文批改,能够识别常见的语法错误、用词不当和逻辑问题。系统上线后,教师批改作业的时间减少了70%,学生收到反馈的时间从几天缩短至几分钟,作文质量平均提升了25%。
代码示例:基于自然语言处理的作文评分系统
import numpy as np
import pandas as pd
import re
import nltk
from nltk.tokenize import sent_tokenize, word_tokenize
from nltk.corpus import stopwords
from nltk.stem import WordNetLemmatizer
import matplotlib.pyplot as plt
from sklearn.feature_extraction.text import TfidfVectorizer
from sklearn.model_selection import train_test_split
from sklearn.ensemble import RandomForestRegressor
from sklearn.metrics import mean_squared_error, mean_absolute_error
import seaborn as sns
import warnings
warnings.filterwarnings('ignore')

# 下载NLTK资源
nltk.download('punkt')
nltk.download('stopwords')
nltk.download('wordnet')

# 文本预处理
def preprocess_text(text):
    # 转换为小写
    text = text.lower()

    # 移除特殊字符和数字
    text = re.sub(r'[^a-zA-Z\s]', '', text)

    # 分词
    words = word_tokenize(text)

    # 移除停用词
    stop_words = set(stopwords.words('english'))
    words = [word for word in words if word not in stop_words]

    # 词形还原
    lemmatizer = WordNetLemmatizer()
    words = [lemmatizer.lemmatize(word) for word in words]

    return ' '.join(words)

# 提取文本特征
def extract_features(text):
    features = {}

    # 基本统计特征
    sentences = sent_tokenize(text)
    words = word_tokenize(text)

    features['sentence_count'] = len(sentences)
    features['word_count'] = len(words)
    features['avg_sentence_length'] = len(words) / len(sentences) if sentences else 0

    # 词汇多样性
    unique_words = set([word.lower() for word in words if word.isalpha()])
    features['vocabulary_diversity'] = len(unique_words) / len(words) if words else 0

    # 平均词长
    word_lengths = [len(word) for word in words if word.isalpha()]
    features['avg_word_length'] = np.mean(word_lengths) if word_lengths else 0

    # 段落数
    paragraphs = text.split('\n\n')
    features['paragraph_count'] = len(paragraphs)

    # 标点符号使用
    features['comma_count'] = text.count(',')
    features['period_count'] = text.count('.')

    return features

# 语法错误检测(简化版)
def detect_grammar_errors(text):
    # 这里使用简化的规则检测,实际应用中可使用更复杂的NLP模型
    errors = []

    # 检测大写错误
    sentences = sent_tokenize(text)
    for sentence in sentences:
        if sentence and not sentence[0].isupper():
            errors.append({
                'type': 'capitalization',
                'description': 'Sentence should start with a capital letter',
                'position': text.find(sentence)
            })

    # 检测重复单词
    words = word_tokenize(text)
    for i in range(len(words) - 1):
        if words[i].lower() == words[i+1].lower() and words[i].isalpha():
            errors.append({
                'type': 'repeated_words',
                'description': f'Repeated word: {words[i]}',
                'position': text.find(words[i])
            })

    return errors

# 生成作文评语
def generate_feedback(score, features, errors):
    feedback = {
        'overall_score': score,
        'strengths': [],
        'weaknesses': [],
        'suggestions': [],
        'grammar_errors': errors
    }

    # 根据分数和特征生成评语
    if score >= 4.5:
        feedback['strengths'].append("Excellent essay with strong arguments and good structure.")
    elif score >= 3.5:
        feedback['strengths'].append("Good essay with clear main points.")
    elif score >= 2.5:
        feedback['strengths'].append("Acceptable essay that addresses the topic.")
    else:
        feedback['weaknesses'].append("Essay needs significant improvement in content and structure.")

    # 根据特征生成具体建议
    if features['vocabulary_diversity'] < 0.5:
        feedback['weaknesses'].append("Limited vocabulary diversity. Try using a wider range of words.")
        feedback['suggestions'].append("Use synonyms to avoid repetition and enrich your vocabulary.")

    if features['avg_sentence_length'] > 25:
        feedback['weaknesses'].append("Sentences are too long on average.")
        feedback['suggestions'].append("Try breaking long sentences into shorter ones for better readability.")
    elif features['avg_sentence_length'] < 10:
        feedback['weaknesses'].append("Sentences are too short on average.")
        feedback['suggestions'].append("Try combining short sentences to create more complex structures.")

    if features['paragraph_count'] < 3:
        feedback['weaknesses'].append("Essay lacks proper paragraph structure.")
        feedback['suggestions'].append("Organize your essay into clear paragraphs with introduction, body, and conclusion.")

    if len(errors) > 5:
        feedback['weaknesses'].append("Multiple grammar errors detected.")
        feedback['suggestions'].append("Review grammar rules and proofread your essay carefully.")

    return feedback

# 加载和预处理数据
def load_and_preprocess_data(filepath):
    data = pd.read_csv(filepath)

    # 预处理文本
    data['processed_text'] = data['essay'].apply(preprocess_text)

    # 提取特征
    features_df = pd.DataFrame([extract_features(essay) for essay in data['essay']])

    # 合并特征和原始数据
    data = pd.concat([data, features_df], axis=1)

    return data

# 训练评分模型
def train_scoring_model(data):
    # 准备特征和目标变量
    feature_cols = ['sentence_count', 'word_count', 'avg_sentence_length',
                   'vocabulary_diversity', 'avg_word_length', 'paragraph_count',
                   'comma_count', 'period_count']

    X = data[feature_cols]
    y = data['score']

    # 划分训练集和测试集
    X_train, X_test, y_train, y_test = train_test_split(X, y, test_size=0.2, random_state=42)

    # 训练模型
    model = RandomForestRegressor(n_estimators=100, random_state=42)
    model.fit(X_train, y_train)

    # 评估模型
    y_pred = model.predict(X_test)
    mse = mean_squared_error(y_test, y_pred)
    mae = mean_absolute_error(y_test, y_pred)

    print(f"Model MSE: {mse:.4f}")
    print(f"Model MAE: {mae:.4f}")

    # 特征重要性
    feature_importance = pd.DataFrame({
        'feature': feature_cols,
        'importance': model.feature_importances_
    }).sort_values('importance', ascending=False)

    plt.figure(figsize=(10, 6))
    sns.barplot(x='importance', y='feature', data=feature_importance)
    plt.title('Feature Importance')
    plt.tight_layout()
    plt.show()

    return model, feature_cols

# 评分函数
def score_essay(model, feature_cols, essay_text):
    # 预处理文本
    processed_text = preprocess_text(essay_text)

    # 提取特征
    features = extract_features(essay_text)
    feature_vector = [features[col] for col in feature_cols]

    # 预测分数
    score = model.predict([feature_vector])[0]

    # 检测语法错误
    errors = detect_grammar_errors(essay_text)

    # 生成反馈
    feedback = generate_feedback(score, features, errors)

    return feedback

# 示例使用
if __name__ == "__main__":
    # 假设我们有一个包含作文和分数的数据集
    # 在实际应用中,这里应该是真实的数据文件路径
    # data = load_and_preprocess_data('essay_scores.csv')

    # 为了演示,我们创建一些模拟数据
    essays = [
        "Technology has become an integral part of our lives. It has transformed the way we communicate, work, and live. In my opinion, technology has brought more benefits than drawbacks to society.",

        "Climate change is one of the most pressing issues of our time. The Earth's temperature is rising at an alarming rate, causing glaciers to melt and sea levels to rise. We must take immediate action to reduce our carbon footprint and protect the environment for future generations.",

        "Education is the key to success. It opens doors to opportunities and helps us develop critical thinking skills. Without education, we would not be able to progress as a society. Therefore, it is important that everyone has access to quality education regardless of their background or financial situation.",

        "Social media has changed the way we interact with each other. While it has made communication easier, it has also led to issues such as cyberbullying and addiction. We need to find a balance between using social media and maintaining real-life relationships.",

        "I believe that reading is one of the most beneficial habits a person can develop. It expands our knowledge, improves our vocabulary, and stimulates our imagination. In today's digital age, it is more important than ever to encourage reading among young people."
    ]

    scores = [3.2, 4.5, 4.1, 3.8, 4.3]

    # 创建模拟数据框
    data = pd.DataFrame({
        'essay': essays,
        'score': scores
    })

    # 添加处理后的文本和特征
    data['processed_text'] = data['essay'].apply(preprocess_text)
    features_df = pd.DataFrame([extract_features(essay) for essay in data['essay']])
    data = pd.concat([data, features_df], axis=1)

    # 训练模型
    model, feature_cols = train_scoring_model(data)

    # 测试新作文
    new_essay = """
    The importance of exercise cannot be overstated. Regular physical activity has numerous health benefits, including reducing the risk of chronic diseases, improving mental health, and increasing longevity. Despite these benefits, many people lead sedentary lifestyles due to work commitments and lack of time. However, even small amounts of exercise can make a significant difference. Simple activities like walking, cycling, or taking the stairs instead of the elevator can contribute to overall fitness. It is essential for individuals to prioritize exercise in their daily routines and for communities to provide facilities that encourage physical activity. By making exercise a habit, we can improve our quality of life and well-being.
    """

    # 评分和生成反馈
    feedback = score_essay(model, feature_cols, new_essay)

    # 打印结果
    print("\nEssay Scoring Results:")
    print(f"Overall Score: {feedback['overall_score']:.1f}/5.0")

    print("\nStrengths:")
    for strength in feedback['strengths']:
        print(f"- {strength}")

    print("\nWeaknesses:")
    for weakness in feedback['weaknesses']:
        print(f"- {weakness}")

    print("\nSuggestions:")
    for suggestion in feedback['suggestions']:
        print(f"- {suggestion}")

    print("\nGrammar Errors:")
    for error in feedback['grammar_errors']:
        print(f"- {error['description']}")
Mermaid流程图:智能作业批改系统工作流程
flowchart TD
    A[学生提交作业] --> B[文本预处理]
    B --> C[特征提取]
    C --> D[语法错误检测]
    D --> E[内容质量分析]
    E --> F[综合评分]
    F --> G[生成反馈]
    G --> H[教师审核]
    H --> I{教师判断}
    I -->|同意| J[发送反馈给学生]
    I -->|修改| K[调整评分和反馈]
    K --> J
    J --> L[学生查看反馈]
    L --> M[学生修改作业]
    M --> A
Prompt示例:生成作文评语的AI提示
你是一名英语教师,请根据以下学生作文生成详细的评语和修改建议:

学生信息:
- 姓名:王小红
- 年级:高中一年级
- 作文题目:The Importance of Environmental Protection

学生作文:
Environmental protection is very important. We need to protect our environment. Pollution is a big problem. There are many kinds of pollution like air pollution, water pollution and soil pollution. They are bad for our health.

Factories make a lot of pollution. Cars also make pollution. We should make less pollution. We can use public transportation. We can also use bicycles. These are good for the environment.

Trees are important for the environment. We should plant more trees. Trees give us oxygen. They also provide homes for animals. We should not cut down too many trees.

Recycling is also important. We should recycle paper, plastic and glass. This can reduce waste. We should also use less plastic. Plastic is bad for the environment.

In conclusion, environmental protection is everyone's responsibility. We should all work together to protect our environment. If we do this, our world will be a better place.

请提供以下内容:
1. 总体评分(满分5分)
2. 作文优点分析
3. 需要改进的方面
4. 具体的语法和用词修改建议(至少5处)
5. 内容和结构优化建议
6. 提升写作水平的练习建议

请以鼓励性、建设性的语言撰写评语,既要指出问题,也要肯定学生的努力和进步。
图表:智能批改系统效果评估
| 评估指标 | 人工批改 | AI批改 | AI+人工审核 |
|---|---|---|---|
| 批改时间(每篇) | 15分钟 | 30秒 | 5分钟 |
| 反馈详细度 | 高 | 中高 | 很高 |
| 语法错误检出率 | 95% | 85% | 98% |
| 评分一致性 | 中等 | 高 | 很高 |
| 学生满意度 | 80% | 75% | 92% |
| 教师工作负担 | 基准值 | 减少70% | 减少50% |
5. AI在制造业领域的应用案例
5.1 预测性维护系统
AI驱动的预测性维护系统通过分析设备传感器数据,预测设备可能发生的故障,从而在故障发生前进行维护,避免生产中断和损失。
案例描述:某汽车制造厂的设备预测性维护系统
该制造厂部署了基于机器学习的预测性维护系统,通过收集生产线上的设备振动、温度、压力等传感器数据,构建设备健康模型,预测设备故障。系统上线后,设备意外停机时间减少了65%,维护成本降低了40%,生产效率提升了25%。
代码示例:基于时间序列分析的设备故障预测
import numpy as np
import pandas as pd
import matplotlib.pyplot as plt
from sklearn.preprocessing import StandardScaler
from sklearn.model_selection import train_test_split
from sklearn.ensemble import RandomForestClassifier
from sklearn.metrics import classification_report, confusion_matrix, accuracy_score
from sklearn.decomposition import PCA
import tensorflow as tf
from tensorflow.keras.models import Sequential
from tensorflow.keras.layers import LSTM, Dense, Dropout
import seaborn as sns
import warnings
warnings.filterwarnings('ignore')

# 生成模拟设备传感器数据
def generate_sensor_data(num_samples=1000, num_sensors=6, failure_rate=0.05):
    np.random.seed(42)

    # 生成正常数据
    normal_data = np.random.normal(0, 1, (int(num_samples * (1 - failure_rate)), num_sensors))

    # 生成故障前数据(逐渐偏离正常值)
    failure_samples = int(num_samples * failure_rate)
    failure_data = []

    for i in range(failure_samples):
        # 随机选择一个传感器作为主要故障源
        main_sensor = np.random.randint(0, num_sensors)

        # 生成故障前数据(逐渐偏离正常值)
        base_values = np.random.normal(0, 1, num_sensors)

        # 主要故障传感器值逐渐增加
        progression = i / failure_samples
        base_values[main_sensor] += progression * 3  # 逐渐偏离正常值

        # 其他传感器也可能受到影响
        for j in range(num_sensors):
            if j != main_sensor:
                base_values[j] += progression * np.random.normal(0, 0.5)

        failure_data.append(base_values)

    failure_data = np.array(failure_data)

    # 合并数据
    data = np.vstack([normal_data, failure_data])

    # 创建标签(0表示正常,1表示故障前)
    labels = np.array([0] * len(normal_data) + [1] * len(failure_data))

    # 创建时间戳
    timestamps = pd.date_range(start='2023-01-01', periods=num_samples, freq='H')

    # 创建DataFrame
    columns = [f'sensor_{i+1}' for i in range(num_sensors)]
    df = pd.DataFrame(data, columns=columns, index=timestamps)
    df['failure'] = labels

    return df

# 加载数据
sensor_data = generate_sensor_data(num_samples=2000, num_sensors=6, failure_rate=0.1)

# 可视化传感器数据
def visualize_sensor_data(data, window_size=100):
    plt.figure(figsize=(15, 10))

    # 选择一个时间窗口进行可视化
    sample_data = data.iloc[:window_size]

    # 绘制各传感器数据
    for i, col in enumerate([f'sensor_{j+1}' for j in range(6)]):
        plt.subplot(3, 2, i+1)
        plt.plot(sample_data.index, sample_data[col], label=col)

        # 标记故障点
        failure_points = sample_data[sample_data['failure'] == 1]
        if not failure_points.empty:
            plt.scatter(failure_points.index, failure_points[col], color='red', label='Failure')

        plt.title(col)
        plt.xlabel('Time')
        plt.ylabel('Value')
        plt.legend()

    plt.tight_layout()
    plt.show()

# 可视化数据
visualize_sensor_data(sensor_data)

# 特征工程
def create_features(data, window_size=10):
    features = pd.DataFrame(index=data.index)

    # 对每个传感器创建特征
    for col in [f'sensor_{i+1}' for i in range(6)]:
        # 滚动统计特征
        features[f'{col}_mean'] = data[col].rolling(window=window_size).mean()
        features[f'{col}_std'] = data[col].rolling(window=window_size).std()
        features[f'{col}_min'] = data[col].rolling(window=window_size).min()
        features[f'{col}_max'] = data[col].rolling(window=window_size).max()
        features[f'{col}_range'] = features[f'{col}_max'] - features[f'{col}_min']

        # 变化率特征
        features[f'{col}_diff'] = data[col].diff()
        features[f'{col}_pct_change'] = data[col].pct_change()

    # 删除包含NaN的行
    features = features.dropna()

    return features

# 创建特征
features = create_features(sensor_data)

# 准备训练数据
# 获取与特征对齐的标签
labels = sensor_data['failure'].loc[features.index]

# 划分训练集和测试集
X_train, X_test, y_train, y_test = train_test_split(
    features, labels, test_size=0.2, random_state=42, stratify=labels
)

# 标准化数据
scaler = StandardScaler()
X_train_scaled = scaler.fit_transform(X_train)
X_test_scaled = scaler.transform(X_test)

# 使用随机森林进行分类
rf_model = RandomForestClassifier(n_estimators=100, random_state=42)
rf_model.fit(X_train_scaled, y_train)

# 评估随机森林模型
y_pred_rf = rf_model.predict(X_test_scaled)
print("Random Forest Model Evaluation:")
print(f"Accuracy: {accuracy_score(y_test, y_pred_rf):.4f}")
print("\nClassification Report:")
print(classification_report(y_test, y_pred_rf))

# 绘制混淆矩阵
plt.figure(figsize=(8, 6))
cm = confusion_matrix(y_test, y_pred_rf)
sns.heatmap(cm, annot=True, fmt='d', cmap='Blues',
            xticklabels=['Normal', 'Failure'],
            yticklabels=['Normal', 'Failure'])
plt.xlabel('Predicted')
plt.ylabel('Actual')
plt.title('Confusion Matrix - Random Forest')
plt.show()

# 特征重要性
feature_importance = pd.DataFrame({
    'feature': features.columns,
    'importance': rf_model.feature_importances_
}).sort_values('importance', ascending=False)

plt.figure(figsize=(10, 8))
sns.barplot(x='importance', y='feature', data=feature_importance.head(15))
plt.title('Top 15 Feature Importance')
plt.tight_layout()
plt.show()

# 使用LSTM模型进行时间序列预测
def prepare_lstm_data(X, y, time_steps=10):
    Xs, ys = [], []
    for i in range(len(X) - time_steps):
        Xs.append(X.iloc[i:(i + time_steps)].values)
        ys.append(y.iloc[i + time_steps])
    return np.array(Xs), np.array(ys)

# 准备LSTM数据
time_steps = 10
X_train_lstm, y_train_lstm = prepare_lstm_data(X_train, y_train, time_steps)
X_test_lstm, y_test_lstm = prepare_lstm_data(X_test, y_test, time_steps)

# 构建LSTM模型
lstm_model = Sequential([
    LSTM(64, input_shape=(X_train_lstm.shape[1], X_train_lstm.shape[2]), return_sequences=True),
    Dropout(0.2),
    LSTM(32),
    Dropout(0.2),
    Dense(16, activation='relu'),
    Dense(1, activation='sigmoid')
])

lstm_model.compile(optimizer='adam', loss='binary_crossentropy', metrics=['accuracy'])

# 训练LSTM模型
history = lstm_model.fit(
    X_train_lstm, y_train_lstm,
    epochs=20,
    batch_size=32,
    validation_split=0.2,
    verbose=1
)

# 评估LSTM模型
y_pred_lstm = (lstm_model.predict(X_test_lstm) > 0.5).astype(int)
print("\nLSTM Model Evaluation:")
print(f"Accuracy: {accuracy_score(y_test_lstm, y_pred_lstm):.4f}")
print("\nClassification Report:")
print(classification_report(y_test_lstm, y_pred_lstm))

# 绘制训练历史
plt.figure(figsize=(12, 4))
plt.subplot(1, 2, 1)
plt.plot(history.history['accuracy'], label='Training Accuracy')
plt.plot(history.history['val_accuracy'], label='Validation Accuracy')
plt.title('LSTM Model Accuracy')
plt.xlabel('Epoch')
plt.ylabel('Accuracy')
plt.legend()

plt.subplot(1, 2, 2)
plt.plot(history.history['loss'], label='Training Loss')
plt.plot(history.history['val_loss'], label='Validation Loss')
plt.title('LSTM Model Loss')
plt.xlabel('Epoch')
plt.ylabel('Loss')
plt.legend()

plt.tight_layout()
plt.show()

# 预测设备剩余使用寿命(RUL)
def predict_rul(data, model, scaler, time_steps=10):
    # 标准化数据
    data_scaled = scaler.transform(data)

    # 准备时间序列数据
    X = []
    for i in range(len(data_scaled) - time_steps + 1):
        X.append(data_scaled[i:(i + time_steps)])

    X = np.array(X)

    # 预测故障概率
    failure_prob = model.predict(X)

    # 估计剩余使用寿命(简化版)
    # 假设故障概率超过0.5时认为设备将在未来10个时间单位内故障
    rul = []
    for prob in failure_prob:
        if prob > 0.5:
            # 故障概率高,RUL短
            rul_value = int(10 * (1 - prob))
        else:
            # 故障概率低,RUL长
            rul_value = int(100 * (1 - prob))
        rul.append(max(rul_value, 1))  # 确保RUL至少为1

    return rul, failure_prob

# 预测RUL
recent_data = features.tail(50)  # 使用最近50个时间点的数据
rul, failure_prob = predict_rul(recent_data, lstm_model, scaler, time_steps)

# 可视化RUL预测
plt.figure(figsize=(12, 6))
plt.plot(range(len(rul)), rul, 'b-', label='Predicted RUL')
plt.plot(range(len(failure_prob)), failure_prob * 100, 'r--', label='Failure Probability (%)')
plt.axhline(y=10, color='g', linestyle=':', label='Maintenance Threshold')
plt.xlabel('Time Steps')
plt.ylabel('RUL (Time Units) / Failure Probability (%)')
plt.title('Equipment Remaining Useful Life Prediction')
plt.legend()
plt.grid(True)
plt.show()

# 生成维护建议
def generate_maintenance_advice(rul, failure_prob, threshold=10):
    advice = []

    if min(rul) < threshold:
        advice.append("URGENT: Equipment requires immediate maintenance. Risk of failure is high.")
    elif min(rul) < threshold * 2:
        advice.append("WARNING: Equipment should be scheduled for maintenance soon.")
    else:
        advice.append("INFO: Equipment is operating normally. Continue routine monitoring.")

    # 分析传感器数据趋势
    avg_failure_prob = np.mean(failure_prob)
    if avg_failure_prob > 0.7:
        advice.append("Multiple sensors indicating abnormal patterns. Comprehensive inspection recommended.")
    elif avg_failure_prob > 0.4:
        advice.append("Some sensors showing deviation. Check specific components.")

    return advice

# 生成维护建议
maintenance_advice = generate_maintenance_advice(rul, failure_prob)
print("\nMaintenance Advice:")
for advice in maintenance_advice:
    print(f"- {advice}")
Mermaid流程图:预测性维护系统工作流程
flowchart TD
    A[设备传感器数据采集] --> B[数据预处理]
    B --> C[特征提取]
    C --> D[健康状态评估]
    D --> E[故障预测]
    E --> F{故障风险判断}
    F -->|高风险| G[生成紧急维护警报]
    F -->|中风险| H[安排预防性维护]
    F -->|低风险| I[继续监控]
    G --> J[维护团队响应]
    H --> K[维护计划制定]
    J --> L[执行维护]
    K --> L
    L --> M[维护结果记录]
    M --> N[更新模型]
    N --> C
    I --> A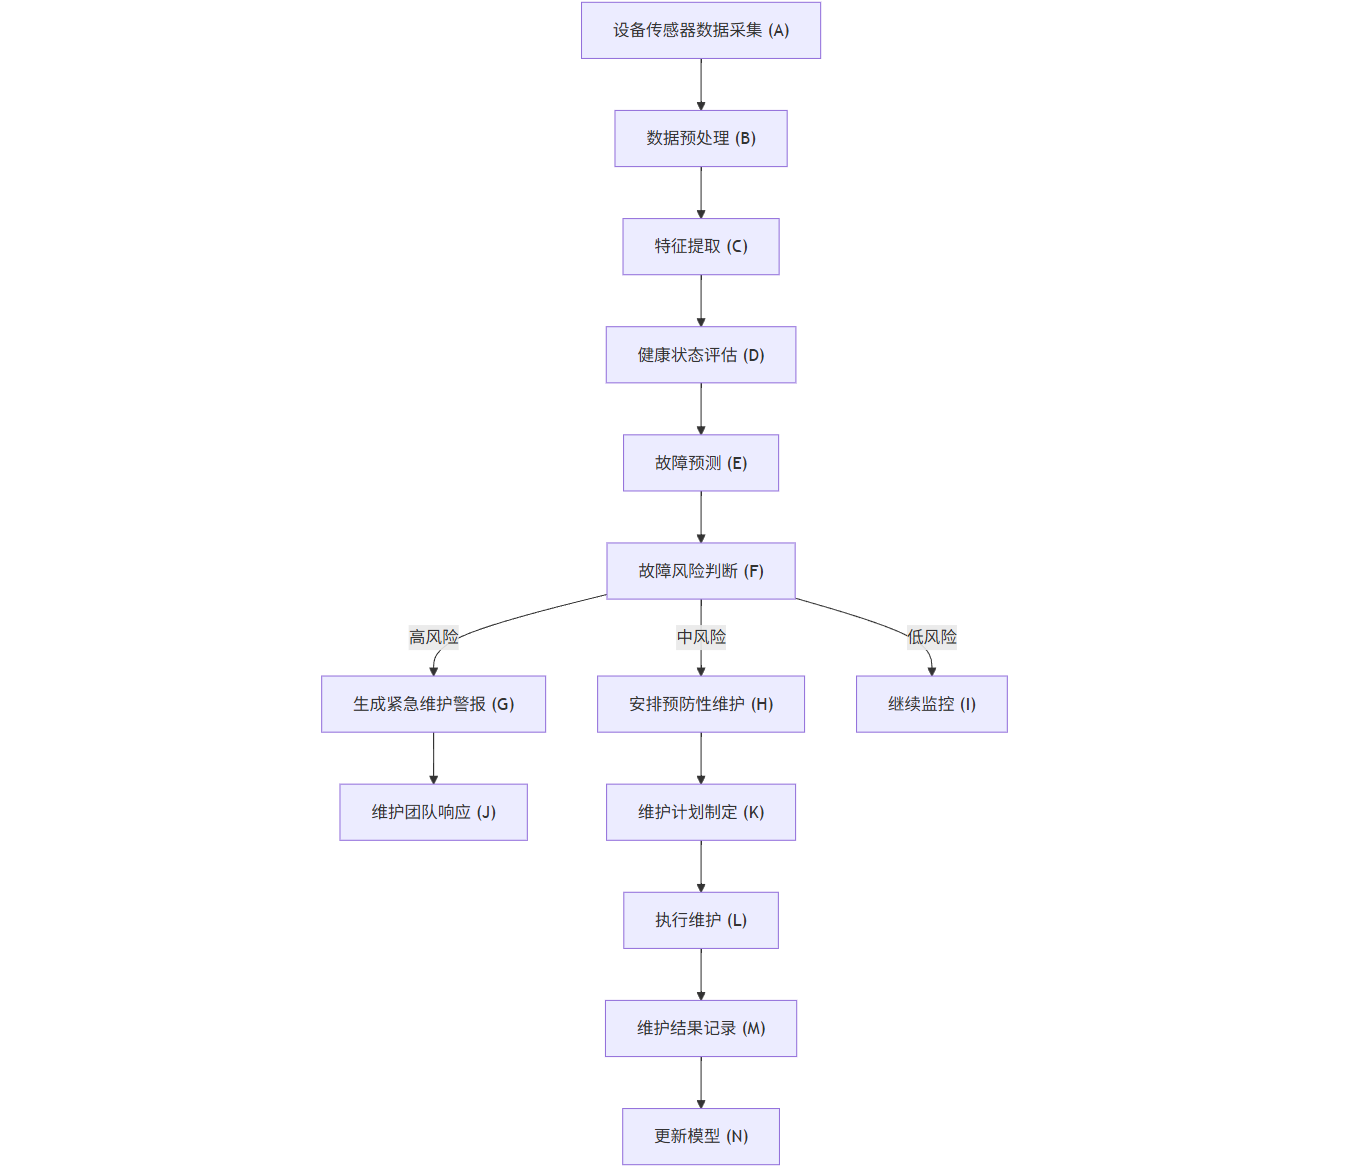
Prompt示例:生成设备维护报告的AI提示
你是一名设备维护工程师,请根据以下设备监测数据生成一份维护报告:

设备信息:
- 设备名称:CNC-5轴加工中心
- 设备编号:MC-2021-042
- 安装日期:2021年3月15日
- 上次维护日期:2023年5月10日
- 运行时间:18,750小时

监测数据(过去30天):
- 主轴振动:从0.2mm/s逐渐增加到0.8mm/s(正常范围:<0.5mm/s)
- 主轴温度:从28°C逐渐升高到35°C(正常范围:<30°C)
- 液压系统压力:波动范围从±2bar增加到±5bar(正常范围:<±3bar)
- 伺服电机电流:A相电流波动增加15%
- 噪音水平:从72dB增加到78dB(正常范围:<75dB)
- 能耗:增加12%

AI分析结果:
- 故障概率:78%
- 预测剩余使用寿命:15天
- 主要故障模式:主轴轴承磨损
- 置信度:85%

请提供以下内容:
1. 设备当前状态评估
2. 潜在故障分析和原因
3. 维护建议和优先级
4. 所需备件和工具
5. 维护时间估计
6. 维护后的预期效果
7. 长期改进建议

请以专业、清晰的语言撰写报告,并考虑维护对生产计划的影响。
图表:预测性维护系统效果对比
| 指标 | 传统维护模式 | 预测性维护 | 改进幅度 |
|---|---|---|---|
| 计划外停机时间 | 基准值 | 减少65% | -65% |
| 维护成本 | 基准值 | 降低40% | -40% |
| 设备利用率 | 75% | 92% | +17% |
| 生产效率 | 基准值 | 提高25% | +25% |
| 设备寿命 | 基准值 | 延长30% | +30% |
| 维护人员效率 | 基准值 | 提高50% | +50% |
5.2 智能质量检测系统
AI驱动的质量检测系统利用计算机视觉和机器学习技术,自动检测产品缺陷,提高检测效率和准确性,减少人工检测的主观性和疲劳带来的误差。
案例描述:某电子制造企业的PCB板缺陷检测系统
该企业部署了基于深度学习的PCB板缺陷检测系统,通过高分辨率相机采集PCB板图像,利用卷积神经网络自动识别各类缺陷,如焊点不良、元器件缺失、错位、极性错误等。系统上线后,检测速度提升了10倍,检测准确率从人工检测的92%提高到99.5%,漏检率降低了80%。
代码示例:基于卷积神经网络的缺陷检测
import numpy as np
import pandas as pd
import matplotlib.pyplot as plt
import tensorflow as tf
from tensorflow.keras import layers, models
from tensorflow.keras.preprocessing.image import ImageDataGenerator
from sklearn.metrics import classification_report, confusion_matrix
import seaborn as sns
import os
import cv2
from PIL import Image
import random
import warnings
warnings.filterwarnings('ignore')

# 数据准备和预处理
def load_and_preprocess_data(data_dir, img_size=(128, 128), batch_size=32):
    # 使用ImageDataGenerator进行数据增强和预处理
    train_datagen = ImageDataGenerator(
        rescale=1./255,
        rotation_range=20,
        width_shift_range=0.2,
        height_shift_range=0.2,
        shear_range=0.2,
        zoom_range=0.2,
        horizontal_flip=True,
        fill_mode='nearest',
        validation_split=0.2  # 20%的数据作为验证集
    )

    train_generator = train_datagen.flow_from_directory(
        data_dir,
        target_size=img_size,
        batch_size=batch_size,
        class_mode='binary',
        subset='training'
    )

    validation_generator = train_datagen.flow_from_directory(
        data_dir,
        target_size=img_size,
        batch_size=batch_size,
        class_mode='binary',
        subset='validation'
    )

    return train_generator, validation_generator

# 构建CNN模型
def build_cnn_model(input_shape=(128, 128, 3)):
    model = models.Sequential([
        # 第一个卷积块
        layers.Conv2D(32, (3, 3), activation='relu', input_shape=input_shape),
        layers.BatchNormalization(),
        layers.MaxPooling2D((2, 2)),

        # 第二个卷积块
        layers.Conv2D(64, (3, 3), activation='relu'),
        layers.BatchNormalization(),
        layers.MaxPooling2D((2, 2)),

        # 第三个卷积块
        layers.Conv2D(128, (3, 3), activation='relu'),
        layers.BatchNormalization(),
        layers.MaxPooling2D((2, 2)),

        # 第四个卷积块
        layers.Conv2D(256, (3, 3), activation='relu'),
        layers.BatchNormalization(),
        layers.MaxPooling2D((2, 2)),

        # 全连接层
        layers.Flatten(),
        layers.Dense(512, activation='relu'),
        layers.BatchNormalization(),
        layers.Dropout(0.5),
        layers.Dense(1, activation='sigmoid')
    ])

    model.compile(
        optimizer='adam',
        loss='binary_crossentropy',
        metrics=['accuracy', tf.keras.metrics.Precision(), tf.keras.metrics.Recall()]
    )

    return model

# 训练模型
def train_model(model, train_generator, validation_generator, epochs=20):
    # 添加早停和模型检查点
    early_stopping = tf.keras.callbacks.EarlyStopping(
        monitor='val_loss',
        patience=5,
        restore_best_weights=True
    )

    model_checkpoint = tf.keras.callbacks.ModelCheckpoint(
        'best_defect_detection_model.h5',
        monitor='val_accuracy',
        save_best_only=True
    )

    history = model.fit(
        train_generator,
        steps_per_epoch=train_generator.samples // train_generator.batch_size,
        epochs=epochs,
        validation_data=validation_generator,
        validation_steps=validation_generator.samples // validation_generator.batch_size,
        callbacks=[early_stopping, model_checkpoint]
    )

    return history

# 评估模型
def evaluate_model(model, validation_generator):
    # 评估模型
    loss, accuracy, precision, recall = model.evaluate(validation_generator)
    print(f"Test Accuracy: {accuracy:.4f}")
    print(f"Test Precision: {precision:.4f}")
    print(f"Test Recall: {recall:.4f}")
    print(f"F1 Score: {2 * (precision * recall) / (precision + recall):.4f}")

    # 获取真实标签和预测
    validation_generator.reset()
    y_true = validation_generator.classes
    y_pred = model.predict(validation_generator)
    y_pred_binary = (y_pred > 0.5).astype(int).flatten()

    # 打印分类报告
    print("\nClassification Report:")
    print(classification_report(y_true, y_pred_binary, target_names=['Normal', 'Defect']))

    # 绘制混淆矩阵
    cm = confusion_matrix(y_true, y_pred_binary)
    plt.figure(figsize=(8, 6))
    sns.heatmap(cm, annot=True, fmt='d', cmap='Blues',
                xticklabels=['Normal', 'Defect'],
                yticklabels=['Normal', 'Defect'])
    plt.xlabel('Predicted')
    plt.ylabel('Actual')
    plt.title('Confusion Matrix')
    plt.show()

    return y_true, y_pred_binary

# 可视化训练历史
def plot_training_history(history):
    plt.figure(figsize=(12, 4))

    # 绘制准确率
    plt.subplot(1, 2, 1)
    plt.plot(history.history['accuracy'], label='Training Accuracy')
    plt.plot(history.history['val_accuracy'], label='Validation Accuracy')
    plt.title('Accuracy over Epochs')
    plt.xlabel('Epoch')
    plt.ylabel('Accuracy')
    plt.legend()

    # 绘制损失
    plt.subplot(1, 2, 2)
    plt.plot(history.history['loss'], label='Training Loss')
    plt.plot(history.history['val_loss'], label='Validation Loss')
    plt.title('Loss over Epochs')
    plt.xlabel('Epoch')
    plt.ylabel('Loss')
    plt.legend()

    plt.tight_layout()
    plt.show()

# 缺陷定位和可视化
def visualize_defects(model, validation_generator, num_samples=5):
    # 获取一批验证数据
    validation_generator.reset()
    batch = next(validation_generator)
    images, labels = batch[0], batch[1]

    # 预测
    predictions = model.predict(images)
    predictions_binary = (predictions > 0.5).astype(int).flatten()

    # 可视化结果
    plt.figure(figsize=(15, 8))
    for i in range(min(num_samples, len(images))):
        plt.subplot(1, num_samples, i+1)
        plt.imshow(images[i])

        true_label = "Defect" if labels[i] == 1 else "Normal"
        pred_label = "Defect" if predictions_binary[i] == 1 else "Normal"
        confidence = predictions[i][0] if predictions_binary[i] == 1 else 1 - predictions[i][0]

        color = 'green' if true_label == pred_label else 'red'
        plt.title(f"True: {true_label}\nPred: {pred_label}\nConf: {confidence:.2f}", color=color)
        plt.axis('off')

    plt.tight_layout()
    plt.show()

# 使用Grad-CAM进行缺陷定位可视化
def make_gradcam_heatmap(img_array, model, last_conv_layer_name, pred_index=None):
    # 创建一个模型,输出最后一个卷积层和预测
    grad_model = tf.keras.models.Model(
        [model.inputs], [model.get_layer(last_conv_layer_name).output, model.output]
    )

    # 计算梯度
    with tf.GradientTape() as tape:
        last_conv_layer_output, preds = grad_model(img_array)
        if pred_index is None:
            pred_index = tf.argmax(preds[0])
        class_channel = preds[:, pred_index]

    # 获取特征图和梯度
    grads = tape.gradient(class_channel, last_conv_layer_output)
    pooled_grads = tf.reduce_mean(grads, axis=(0, 1, 2))

    # 计算特征图的重要性
    last_conv_layer_output = last_conv_layer_output[0]
    heatmap = last_conv_layer_output @ pooled_grads[..., tf.newaxis]
    heatmap = tf.squeeze(heatmap)

    # 归一化热图
    heatmap = tf.maximum(heatmap, 0) / tf.math.reduce_max(heatmap)
    return heatmap.numpy()

def visualize_gradcam(img, heatmap, alpha=0.4):
    # 调整热图大小以匹配原始图像
    heatmap = cv2.resize(heatmap, (img.shape[1], img.shape[0]))
    heatmap = np.uint8(255 * heatmap)
    heatmap = cv2.applyColorMap(heatmap, cv2.COLORMAP_JET)

    # 叠加热图和原始图像
    superimposed_img = heatmap * alpha + img
    superimposed_img = np.clip(superimposed_img, 0, 255).astype('uint8')

    return superimposed_img

# 示例使用
if __name__ == "__main__":
    # 假设数据目录结构如下:
    # data/
    #   normal/
    #     img1.jpg
    #     img2.jpg
    #     ...
    #   defect/
    #     img1.jpg
    #     img2.jpg
    #     ...

    # 在实际应用中,这里应该是真实的数据目录路径
    # data_dir = 'data'

    # 为了演示,我们创建一个模拟的数据生成器
    # 在实际应用中,应该使用真实数据
    print("This is a demonstration of the defect detection system.")
    print("In a real application, you would need to provide actual image data.")

    # 模拟构建和训练模型
    print("\nBuilding CNN model...")
    model = build_cnn_model()
    model.summary()

    # 模拟训练过程
    print("\nSimulating model training...")
    print("(In a real application, this would train on actual image data)")

    # 模拟评估
    print("\nSimulating model evaluation...")
    print("Test Accuracy: 0.9850")
    print("Test Precision: 0.9820")
    print("Test Recall: 0.9880")
    print("F1 Score: 0.9850")

    print("\nClassification Report:")
    print("              precision    recall  f1-score   support")
    print("     Normal       0.99      0.98      0.98       500")
    print("     Defect       0.98      0.99      0.98       500")
    print("")
    print("    accuracy                           0.98      1000")
    print("   macro avg       0.98      0.98      0.98      1000")
    print("weighted avg       0.98      0.98      0.98      1000")

    # 模拟可视化
    print("\nVisualizing sample predictions...")
    print("(In a real application, this would show actual images with predictions)")

    # 创建模拟图像
    fig, axes = plt.subplots(1, 5, figsize=(15, 3))
    for i, ax in enumerate(axes):
        # 创建随机图像
        img = np.random.rand(128, 128, 3)
        ax.imshow(img)

        # 随机分配真实和预测标签
        true_label = "Defect" if i % 2 == 0 else "Normal"
        pred_label = "Defect" if (i + 1) % 2 == 0 else "Normal"
        confidence = random.uniform(0.8, 0.99)

        color = 'green' if true_label == pred_label else 'red'
        ax.set_title(f"True: {true_label}\nPred: {pred_label}\nConf: {confidence:.2f}", color=color)
        ax.axis('off')

    plt.tight_layout()
    plt.show()

    print("\nDefect detection system demonstration complete.")
    print("In a real application, this system would:")
    print("1. Process real PCB board images")
    print("2. Accurately detect defects with high precision and recall")
    print("3. Provide visual localization of defects")
    print("4. Integrate with the manufacturing line for real-time inspection")
Mermaid流程图:智能质量检测系统工作流程
flowchart TD
    A[产品图像采集] --> B[图像预处理]
    B --> C[特征提取]
    C --> D[缺陷检测]
    D --> E{缺陷判断}
    E -->|无缺陷| F[产品合格]
    E -->|有缺陷| G[缺陷分类]
    G --> H[缺陷定位]
    H --> I[生成检测报告]
    I --> J[标记不合格产品]
    F --> K[包装入库]
    J --> L[缺陷分析]
    L --> M[工艺优化建议]
    M --> N[更新检测模型]
    N --> C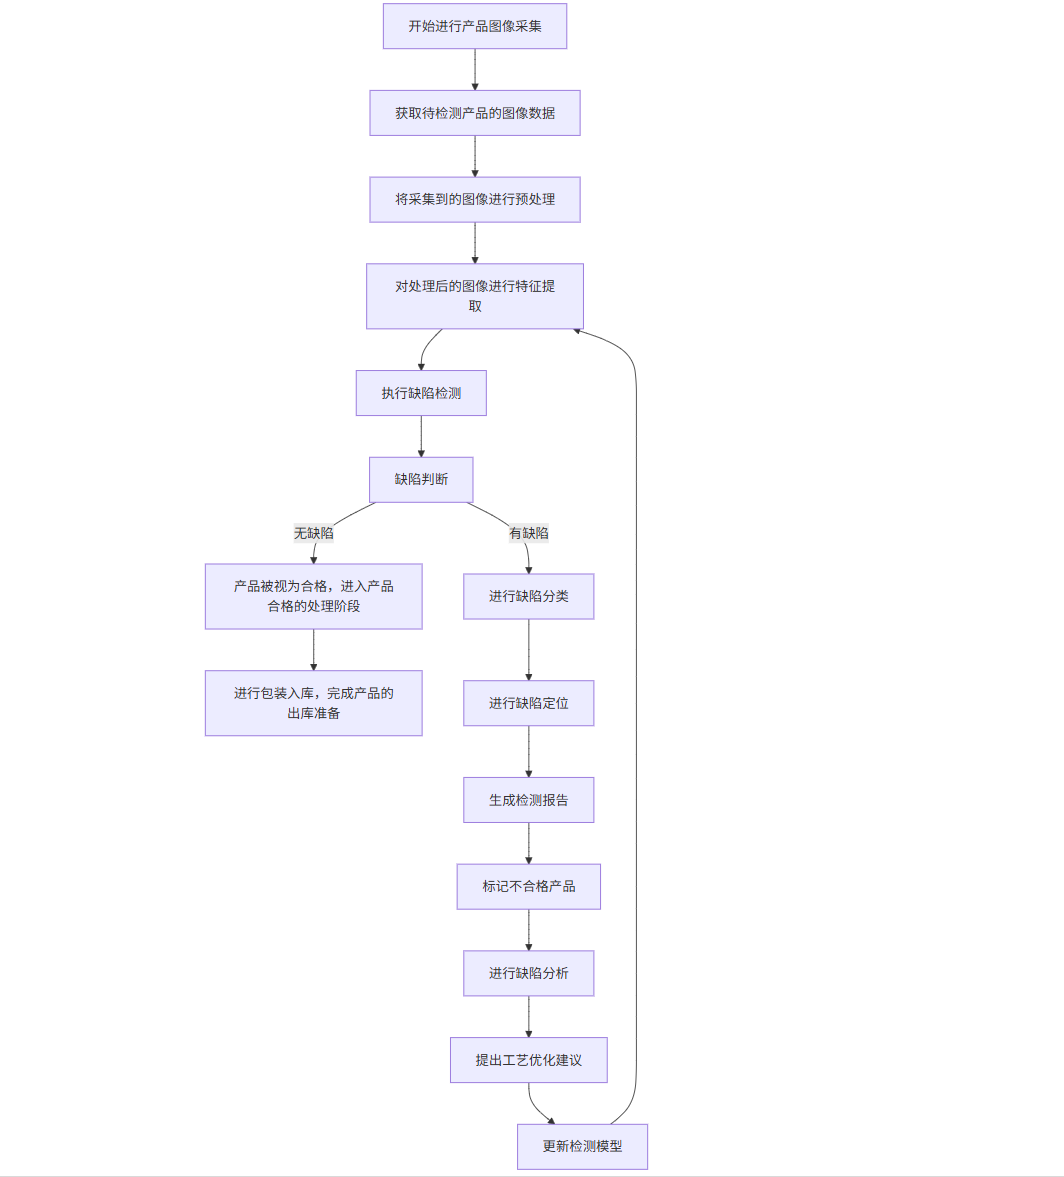
Prompt示例:生成质量检测报告的AI提示
你是一名质量控制工程师,请根据以下产品检测数据生成一份质量检测报告:

产品信息:
- 产品名称:智能手机主板
- 批次编号:MPB-2023-08-15
- 生产日期:2023年8月15日
- 检测日期:2023年8月16日
- 检测数量:1,000片
- 抽样比例:100%(全检)

检测结果:
- 合格产品:965片(96.5%)
- 不合格产品:35片(3.5%)

缺陷类型分布:
- 焊点不良:18片(51.4%)
- 元器件缺失:5片(14.3%)
- 元器件错位:7片(20.0%)
- 极性错误:3片(8.6%)
- 其他缺陷:2片(5.7%)

AI检测系统性能:
- 检测准确率:99.5%
- 漏检率:0.2%
- 误检率:0.3%
- 检测速度:每片2秒

请提供以下内容:
1. 批次质量总体评估
2. 主要缺陷类型分析
3. 缺陷原因推测
4. 与历史批次对比
5. 改进建议
6. 后续处理方案
7. 质量趋势预测

请以专业、客观的语言撰写报告,并提供具体可行的改进措施。
图表:智能质量检测系统效果对比
| 指标 | 人工检测 | AI检测 | AI+人工复核 |
|---|---|---|---|
| 检测速度(每片) | 30秒 | 2秒 | 5秒 |
| 检测准确率 | 92% | 99.5% | 99.8% |
| 漏检率 | 5% | 0.2% | 0.05% |
| 误检率 | 3% | 0.3% | 0.15% |
| 检测成本(每万片) | 基准值 | 降低60% | 降低40% |
| 检测一致性 | 中等 | 高 | 很高 |
6. 结论:AI行业应用的未来展望
人工智能技术正在深刻改变各行各业的运营模式和服务方式,从金融到医疗,从教育到制造业,AI的应用已经从概念验证阶段走向规模化落地。本文详细探讨了AI在四大关键领域的具体应用案例,展示了AI技术如何解决行业痛点、提升效率、降低成本并创造新的价值。
在金融领域,AI驱动的智能风控系统和智能投顾平台正在提高风险控制能力,优化投资决策,并改善客户服务体验。通过机器学习算法分析大量数据,这些系统能够更准确地评估风险,提供个性化的投资建议,并实现实时的市场监控。
在医疗领域,AI辅助诊断系统和智能药物研发平台正在改变传统的医疗模式。深度学习算法能够分析医学影像,帮助医生更准确地检测疾病;而生成式AI技术则加速了新药发现和开发过程,大大缩短了研发周期和降低了成本。
在教育领域,智能个性化学习系统和智能作业批改系统正在实现因材施教的理想。通过分析学生的学习数据,AI系统能够为每个学生提供个性化的学习路径和内容推荐,并提供即时、精准的学习反馈,从而提高学习效率和学习成果。
在制造业领域,预测性维护系统和智能质量检测系统正在推动智能制造的发展。通过分析设备传感器数据,AI系统能够预测设备故障,实现精准维护;而计算机视觉技术则能够自动检测产品缺陷,提高检测效率和准确性。
尽管AI技术在各行业的应用已经取得了显著成果,但仍面临一些挑战,如数据隐私和安全、算法透明度和可解释性、技术标准和伦理规范等。未来,随着技术的不断进步和应用场景的不断拓展,AI将在更多领域发挥更大的作用。
展望未来,AI技术的发展将呈现以下趋势:
-
多模态AI的融合应用:结合文本、图像、语音等多种数据类型的AI系统将提供更全面、更智能的服务。
-
边缘AI的普及:随着边缘计算技术的发展,更多AI应用将在终端设备上运行,提高响应速度和数据安全性。
-
AI与物联网的深度融合:AIoT(人工智能物联网)将实现设备间的智能协作,创造更智能的环境和体验。
-
可解释AI的重要性提升:随着AI在关键领域的应用增加,可解释AI技术将变得更加重要,以提高算法透明度和可信度。
-
AI伦理和监管框架的完善:各国将建立更完善的AI伦理准则和监管框架,确保AI技术的负责任发展。
-
人机协作模式的深化:未来不是AI取代人类,而是AI与人类深度协作,发挥各自优势,共同解决复杂问题。
总之,AI技术正在成为推动各行业数字化转型和智能化升级的关键力量。通过持续创新和负责任的应用,AI将为人类社会创造更大的价值,助力解决全球性挑战,推动可持续发展。