一、部署Prometheus
部署Prometheus和Grafana是一个常见的监控需求。我们需要特别注意镜像包与cpu架构的兼容性。
以下是完整的部署步骤:
本次演示部署环境:
macbook
prometheus v3.4.0
grafana v12.0.1
二进制包安装方式
1. 下载安装
首先,创建一个目录来存放配置文件:
bash
mkdir prometheus-grafana
cd prometheus-grafana
下载prometheus安装包( 根据自己cpu架构选择相应安装包)
plain
wget https://github.com/prometheus/prometheus/releases/download/v3.4.0/prometheus-3.4.0.darwin-arm64.tar.gz
bash
tar xvfz prometheus-3.4.0.darwin-arm64.tar.gz
mv prometheus-3.4.0.darwin-arm64 prometheus-3.4.0
cd prometheus-3.4.0
./prometheus --help 查看其选项的帮助信息
bash
./prometheus --help
usage: prometheus [<flags>]

The Prometheus monitoring server

. . .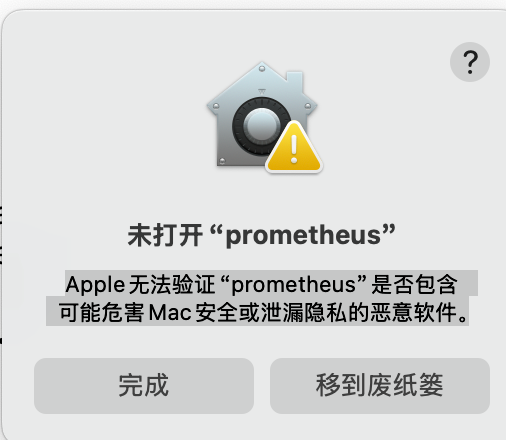
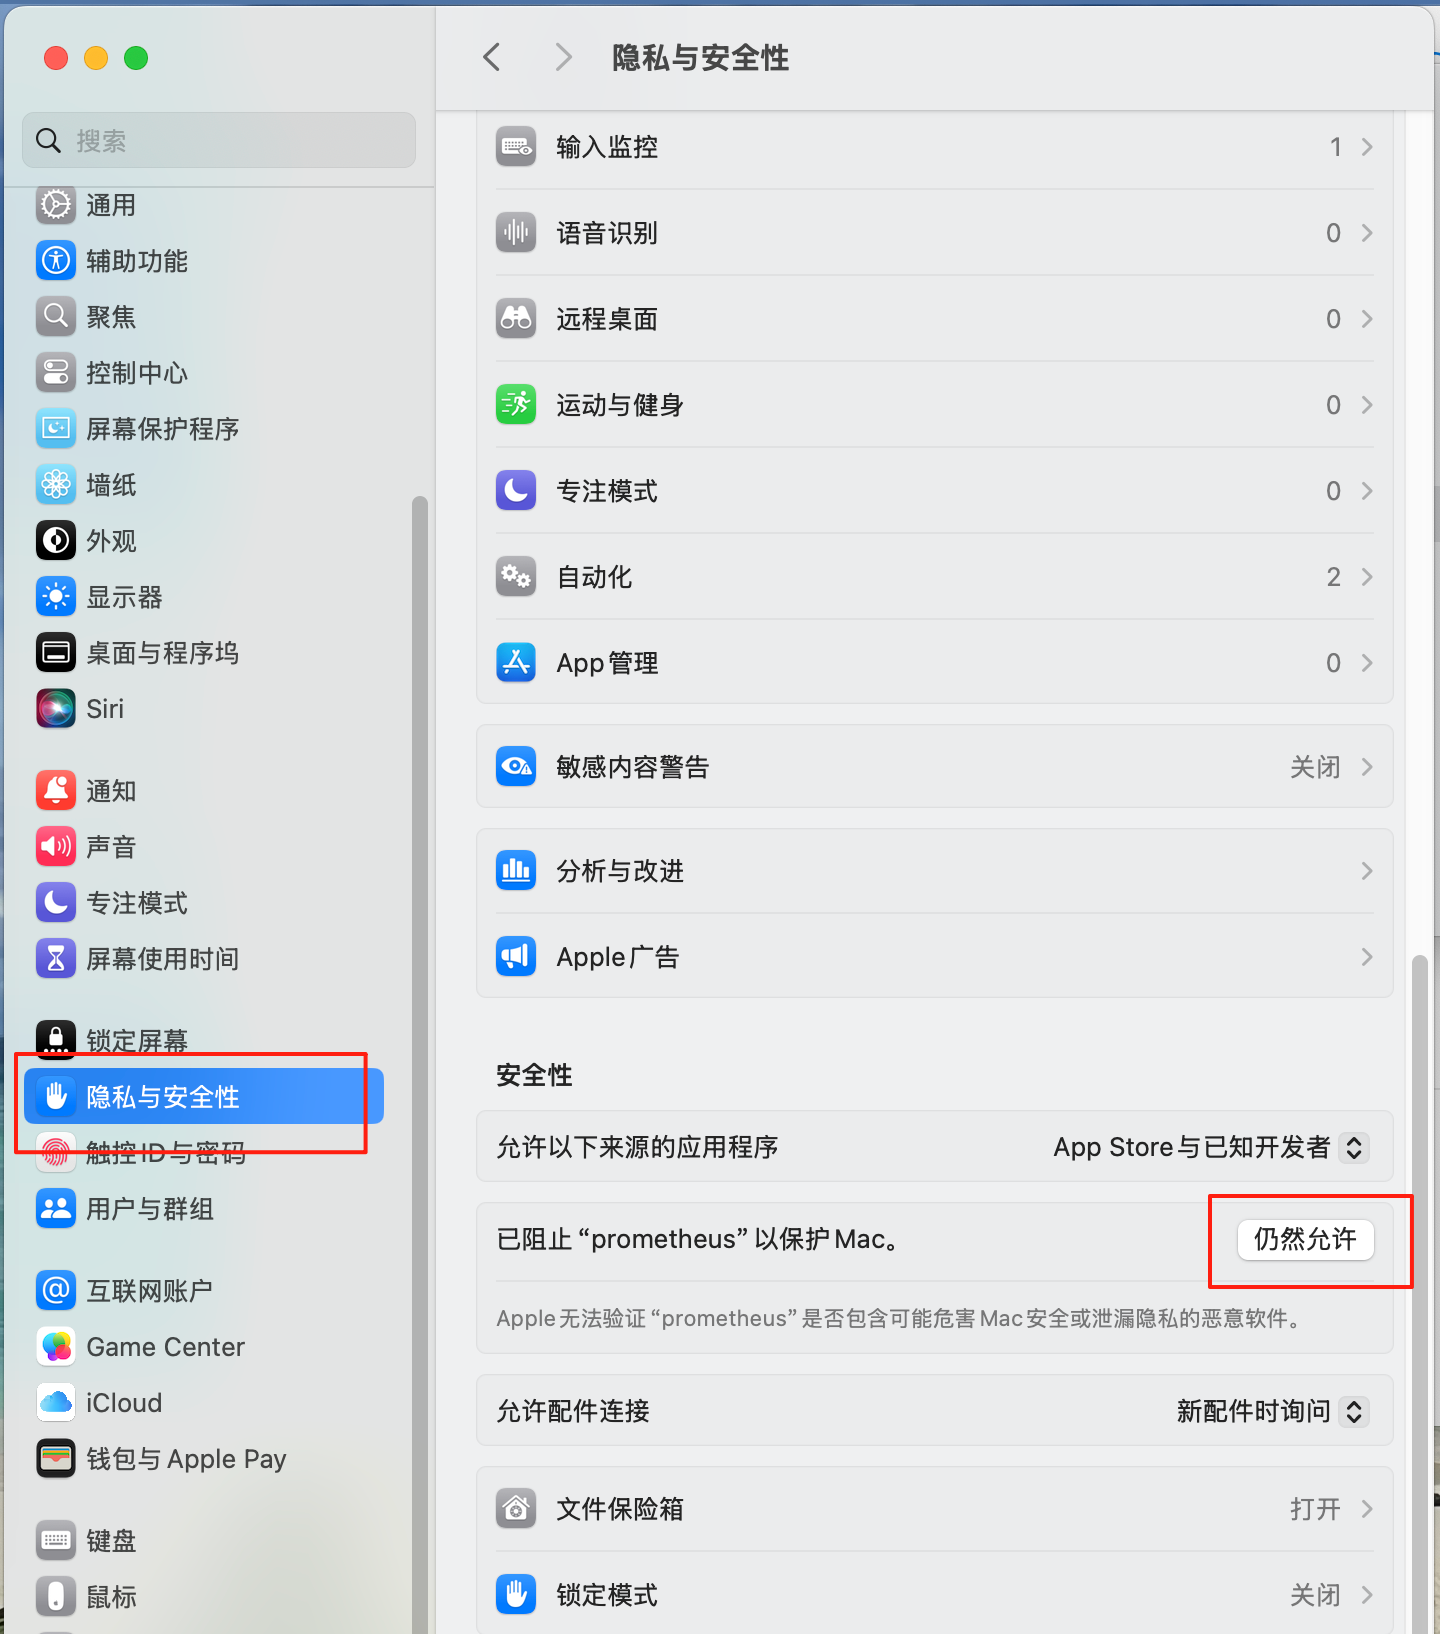
- 打开安全性与隐私设置:依次点击 "苹果菜单" - "系统设置" - "隐私与安全性",在 "安全性" 选项卡下,找到对应选项点击"仍然允许"
2. Prometheus配置文件
在启动 Prometheus 之前,让我们先进行配置
Prometheus 的配置是 YAML 格式的。Prometheus 解压包中包含一个名为 prometheus.yml 的示例配置文件,如下:
yaml
# my global config
global:
  scrape_interval: 15s # Set the scrape interval to every 15 seconds. Default is every 1 minute.
  evaluation_interval: 15s # Evaluate rules every 15 seconds. The default is every 1 minute.
  # scrape_timeout is set to the global default (10s).


# Alertmanager configuration
alerting:
  alertmanagers:
    - static_configs:
        - targets:
          # - alertmanager:9093

# Load rules once and periodically evaluate them according to the global 'evaluation_interval'.
rule_files:
  # - "first_rules.yml"
  # - "second_rules.yml"

# A scrape configuration containing exactly one endpoint to scrape:
# Here it's Prometheus itself.
scrape_configs:
  # The job name is added as a label `job=<job_name>` to any timeseries scraped from this config.
  - job_name: "prometheus"

    # metrics_path defaults to '/metrics'
    # scheme defaults to 'http'.

    static_configs:
      - targets: ["localhost:9090"]
       # The label name is added as a label `label_name=<label_value>` to any timeseries scraped from this config.
        labels:
          app: "prometheus"
示例配置文件中有四个配置块: global、 alerting 、 rule_files 和 scrape_configs。
global 块控制 Prometheus 服务器的全局配置。这里有两个选项。
scrape_interval 它控制 Prometheus 抓取目标的频率。您可以针对单个目标覆盖此设置。在这种情况下,全局设置是每 15 秒抓取一次。
evaluation_interval 选项控制 Prometheus 评估规则的频率。Prometheus 使用规则创建新的时间序列并生成告警。
query_log_file: /prometheus/query.log #定义查询日志的存放路径
是否开启查询日志, 从 2.16.0 版本开始,Prometheus 具备将引擎运行的所有查询记录到日志文件的能力。参考链接:https://prometheus.ac.cn/docs/guides/query-log/
alerting (Alertmanager 管理器的告警规则配置)
rule_files 块指定了我们希望 Prometheus 服务器加载的任何规则文件的位置。目前我们还没有规则。
scrape_configs 控制 Prometheus 监控哪些资源。
job_name : 监控标识名称
由于 Prometheus 本身也通过 HTTP 端点暴露自身的数据,它可以抓取并监控自身的健康状况。在默认配置中,有一个名为 prometheus 的作业,它抓取 Prometheus 服务器暴露的时间序列数据。该作业包含一个静态配置的目标,即 localhost 的端口 9090。Prometheus 期望在目标的 /metrics 路径下获取指标数据。因此,这个默认作业通过以下 URL 进行抓取:http://localhost:9090/metrics。
返回的时间序列数据将详细描述 Prometheus 服务器的状态和性能。
有关配置选项的完整规范,请参阅配置文档。
编辑prometheus.yml文件,配置Prometheus监控自身:
yaml
global:
  scrape_interval: 15s
  evaluation_interval: 15s

rule_files:
  # - "first.rules"
  # - "second.rules"

scrape_configs:
  - job_name: "prometheus"
    static_configs:
      - targets: ["localhost:9090"]
        labels:
          app: "prometheus"
3. 启动Prometheus
要使用我们新创建的配置文件启动 Prometheus,请切换到包含 Prometheus 二进制文件的目录并运行
bash
./prometheus --config.file=prometheus.yml启动完成后,可以通过http://localhost:9090访问Prometheus的UI界面
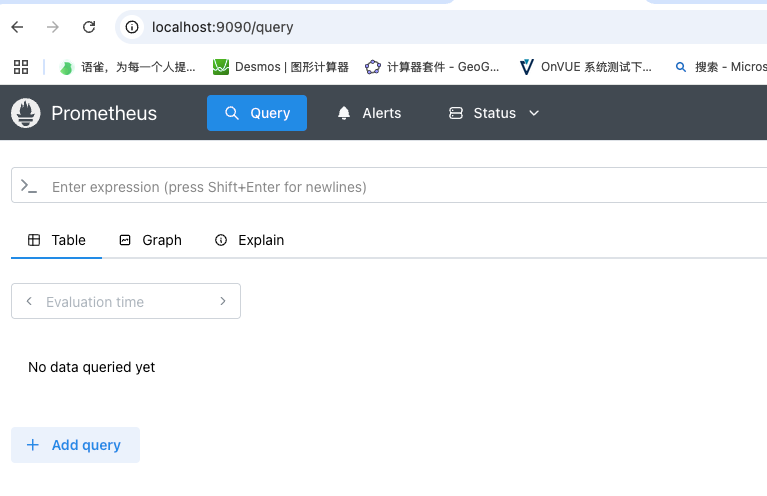
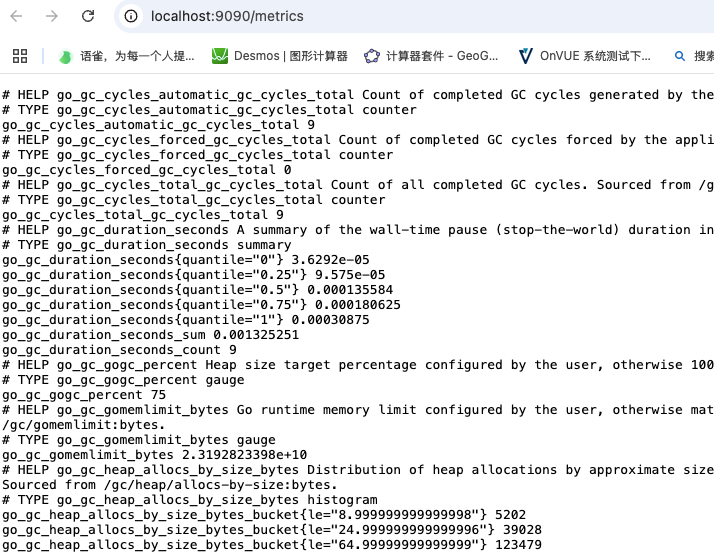
等待约 30 秒,让它从自身的 HTTP 指标端点收集数据, 通过访问其自身的指标端点来验证 Prometheus 是否正在提供关于自身的指标:http://localhost:9090/metrics。
使用容器安装方式
准备prometheus.yml文件
启用前准备prometheus.yml文件,放在当前目录下
配置Prometheus监控自身:
yaml
global:
  scrape_interval: 15s
  evaluation_interval: 15s

rule_files:
  # - "first.rules"
  # - "second.rules"

scrape_configs:
  - job_name: "prometheus"
    static_configs:
      - targets: ["localhost:9090"]
        labels:
          app: "prometheus"
启动prometheus容器
plain
docker run -d \
  --name prometheus \
  -p 9090:9090 \
  -v $(pwd)/prometheus.yml:/etc/prometheus/prometheus.yml \
  -v prometheus-data:/prometheus \
  prom/prometheus \
  --config.file=/etc/prometheus/prometheus.yml \
  --storage.tsdb.path=/prometheus \
  --web.enable-lifecycle
参数说明:
-v prometheus-data:/prometheus :创建命名卷保存时序数据,避免容器重启后数据丢失
--web.enable-lifecycle :
允许通过 HTTP 请求动态重载配置(无需重启容器)
可通过 curl -X POST http://localhost:9090/-/reload 触发
启动完成后,可以通过http://localhost:9090访问Prometheus的UI界面
Prometheus监控指标
指标的理解文章
https://frezc.github.io/2019/08/03/prometheus-metrics/
二、使用Node Exporter采集本地主机运行数据
下载安装
根据自己cpu架构进行选择相应包
plain
wget https://github.com/prometheus/node_exporter/releases/download/v1.9.1/node_exporter-1.9.1.darwin-arm64.tar.gz
tar -xzf node_exporter-1.9.1.darwin-arm64.tar.gz
mv node_exporter-1.9.1.darwin-arm64 node_exporter-1.9.1
启动node_exporter
plain
cd node_exporter-1.9.1
./node_exporter
你会看到类似这样的输出,表明 Node Exporter 正在运行并暴露端口 9100 上的指标
plain
time=2025-05-28T09:03:49.896Z level=INFO source=node_exporter.go:216 msg="Starting node_exporter" version="(version=1.9.1, branch=HEAD, revision=f2ec547b49af53815038a50265aa2adcd1275959)"
time=2025-05-28T09:03:49.896Z level=INFO source=node_exporter.go:217 msg="Build context" build_context="(go=go1.23.7, platform=darwin/arm64, user=root@07d03e612112, date=20250401-15:22:14, tags=unknown)"
time=2025-05-28T09:03:49.896Z level=INFO source=filesystem_common.go:265 msg="Parsed flag --collector.filesystem.mount-points-exclude" collector=filesystem flag=^/(dev)($|/)
time=2025-05-28T09:03:49.896Z level=INFO source=filesystem_common.go:294 msg="Parsed flag --collector.filesystem.fs-types-exclude" collector=filesystem flag=^devfs$
time=2025-05-28T09:03:49.896Z level=INFO source=node_exporter.go:135 msg="Enabled collectors"
.....
time=2025-05-28T09:03:49.897Z level=INFO source=tls_config.go:347 msg="Listening on" address=[::]:9100
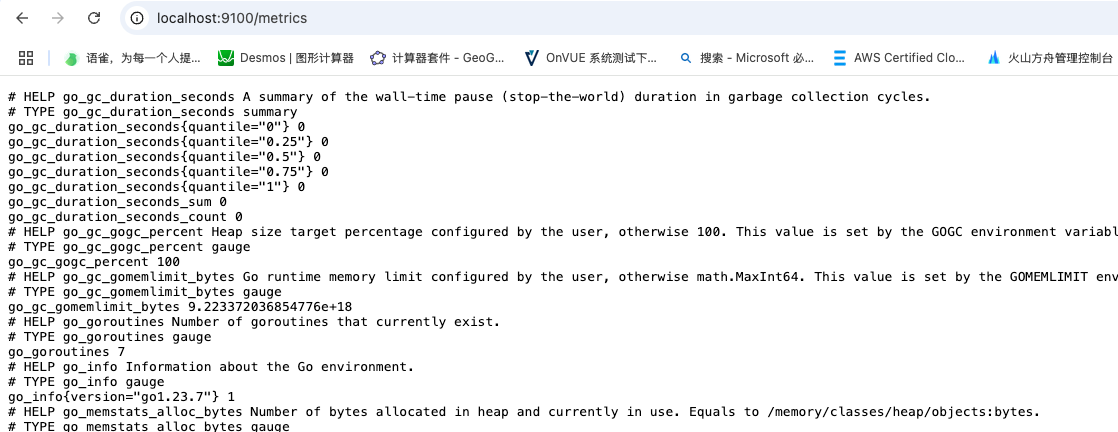
time=2025-05-28T09:03:49.897Z level=INFO source=tls_config.go:350 msg="TLS is disabled." http2=false address=[::]:9100你可以通过 cURL 访问 /metrics 端点来验证采集到的数据信息
浏览器中打开http://localhost:9100/metrics
(其中HELP用于解释当前指标的含义,TYPE则说明当前指标的数据类型。)
或者
plain
curl http://localhost:9100/metricsNode Exporter 现在正在暴露 Prometheus 可以抓取的指标,包括输出中更下方(以 node_ 为前缀)的各种系统指标数据。
查看有采集到那些指标数据
plain
curl http://localhost:9100/metrics | grep "node_"Prometheus 中的 Node Exporter 监控配置
你的本地运行的 Prometheus 实例需要正确配置才能访问 Node Exporter 指标。
在 prometheus.yml 配置中 添加一个 Prometheus 对 ** Node Exporter** 的监控任务如下:
plain
scrape_configs:
# 在这里添加一个job_name
  - job_name: "node"
    static_configs:
      - targets: ["localhost:9100"]
参数说明:
job_name: "node"
- 任务名称,用于标识该监控目标。
- 通常命名为 node,表示这是一个系统级监控任务。
static_configs
- 静态目标配置,直接指定要监控的端点地址。
- 相比动态服务发现(如 Consul、Kubernetes),这种方式适合固定 IP 的服务器。
targets: "**[**localhost:9100**](https://localhost:9100/)** "
- localhost:9100:Node Exporter 默认监听的地址和端口。
- Prometheus 会定期访问 http://localhost:9100/metrics 获取系统指标。
prometheus.yml 完整配置示例:
plain
global:
  scrape_interval: 15s
  evaluation_interval: 15s

rule_files:
  # - "first.rules"
  # - "second.rules"

scrape_configs:
  - job_name: "prometheus"
    static_configs:
      - targets: ["localhost:9090"]
        labels:
          app: "prometheus"

  - job_name: "node"
    static_configs:
      - targets: ["localhost:9100"]
重新启动prometheus
plain
./prometheus --config.file=prometheus.yml验证
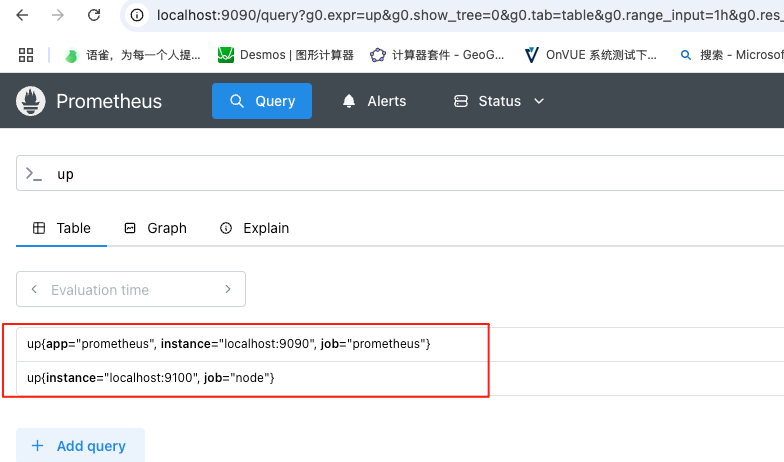
- Prometheus : 访问 http://localhost:9090, 如果输入"up"并且点击执行按钮以后,可以看到如下结果:
或者找到如下菜单查看状态信息
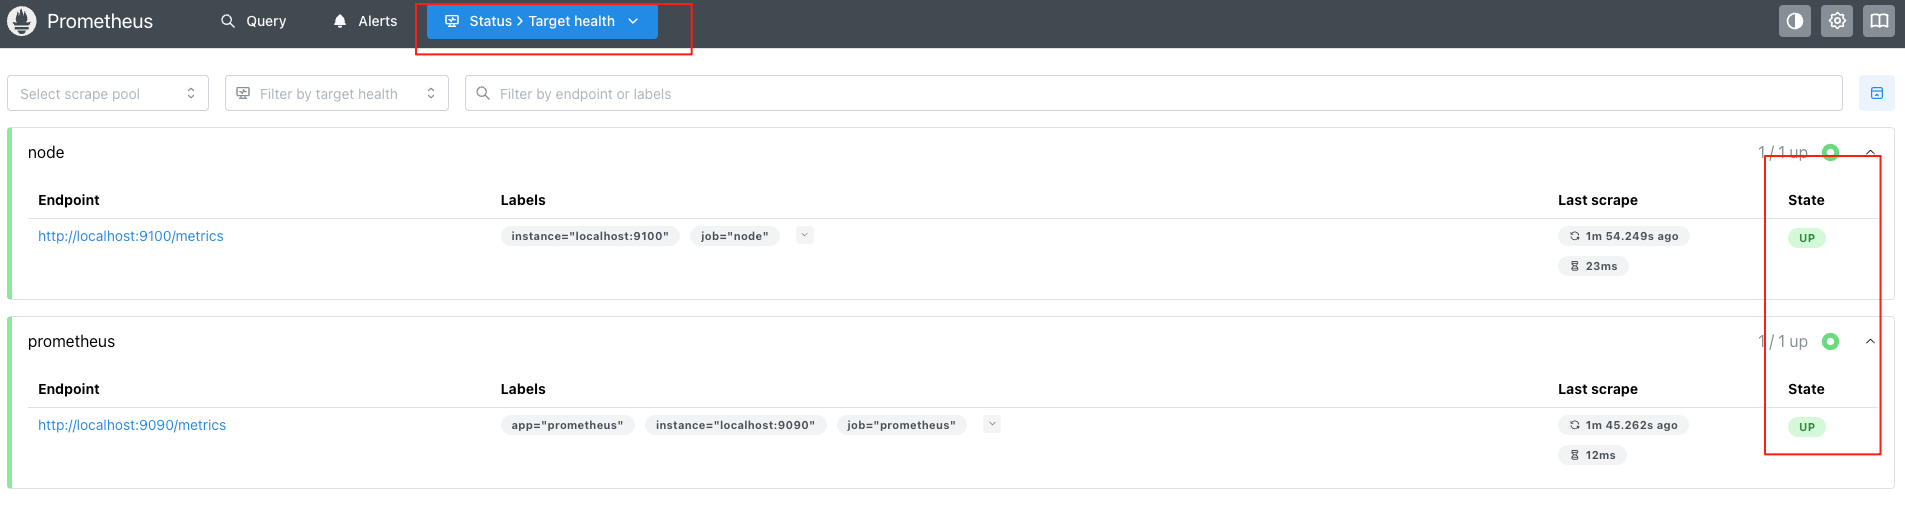
如果Prometheus能够正常从node exporter获取数据,则会看到以下结果:
plain
up{instance="localhost:9090",job="prometheus"}    1
up{instance="localhost:9100",job="node"}    1
其中"1"表示正常,反之"0"则为异常。
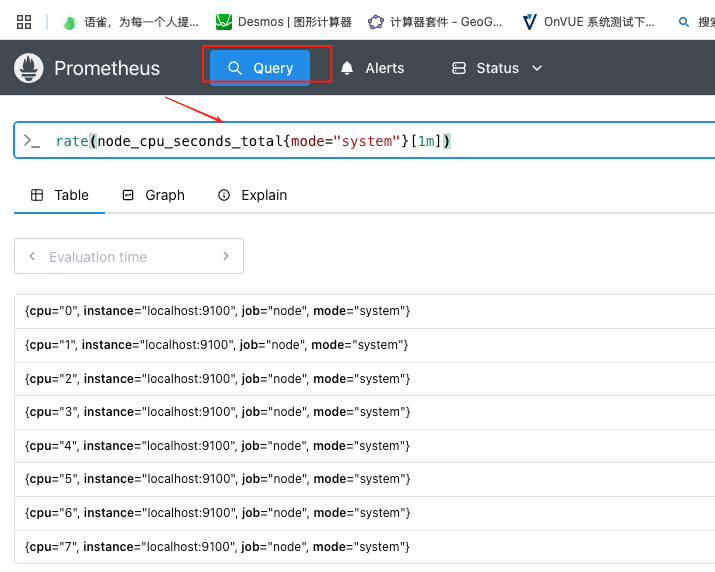
点击下面的链接可查看一些示例指标(数据表格形式)
| 指标 | 含义 |
|---|---|
| rate(node_cpu_seconds_total{mode="system"}1m) | 过去一分钟内,CPU 在系统模式(mode="system")下每秒花费的平均时间(以秒为单位) |
| node_filesystem_avail_bytes | 非 root 用户可用的文件系统空间(以字节为单位) |
| rate(node_network_receive_bytes_total1m) | 过去一分钟内,每秒接收的平均网络流量(以字节为单位) |
示例指标数据:(根据采集到的指标数据,可自定义想要查询的数据信息)
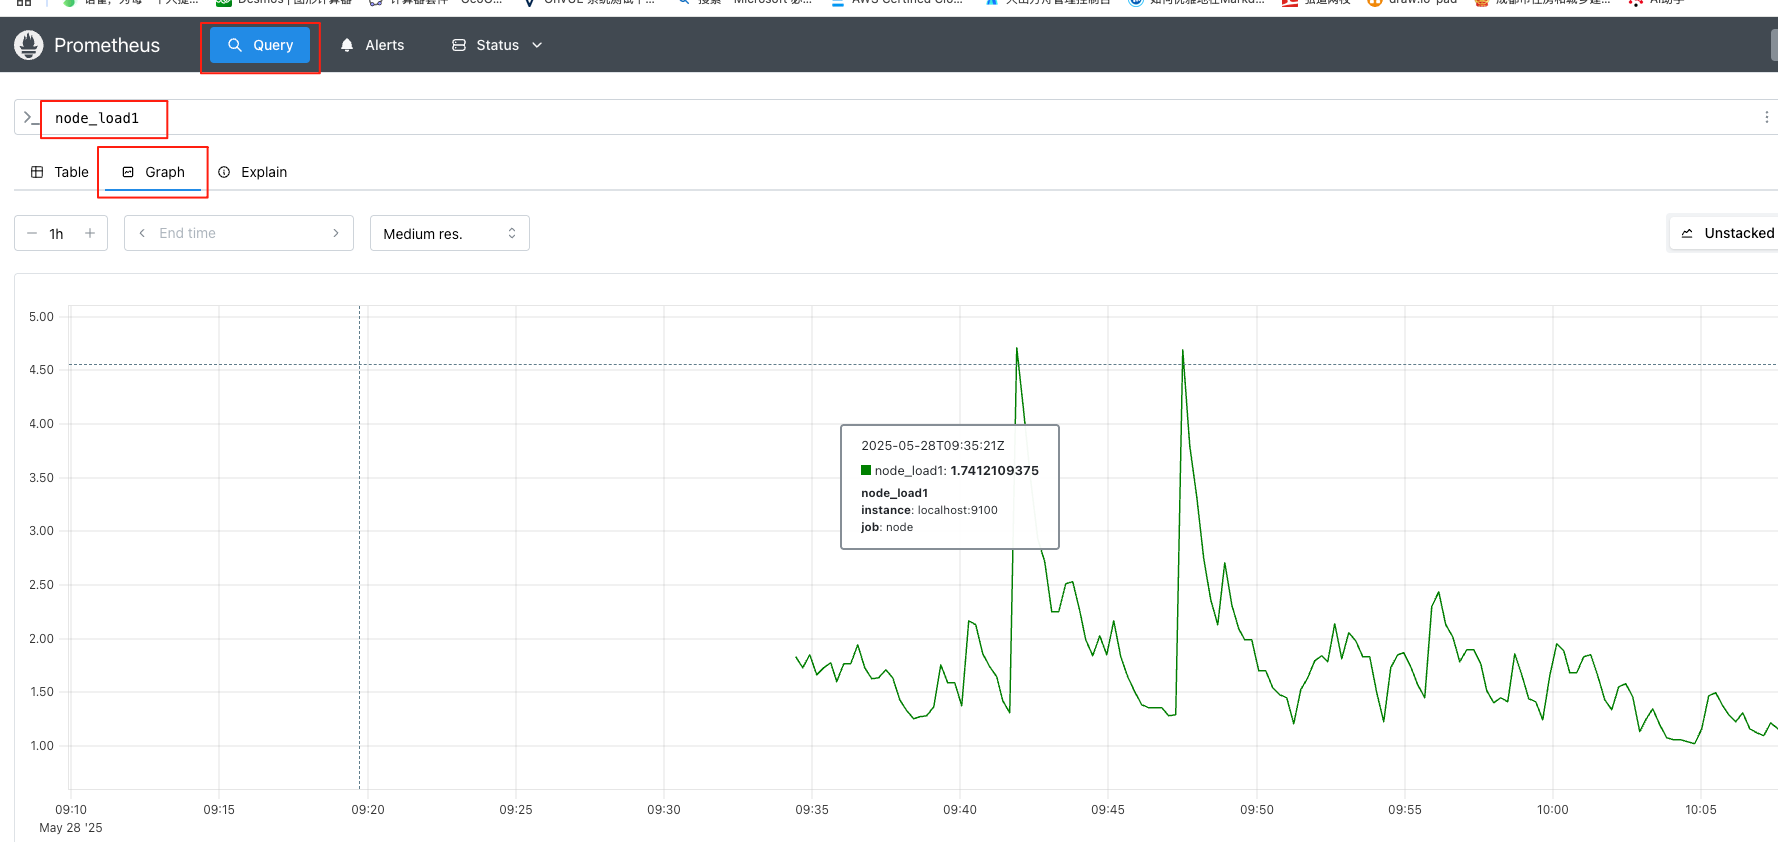
图表形式查询数据指标:
plain
curl http://localhost:9100/metrics | grep "node_load"
% Total % Received % Xferd Average Speed Time Time Time Current
Dload Upload Total Spent Left Speed
100 45209 0 45209 0 0 3979k 0 --:--:-- --:--:-- --:--:-- 4013k
# HELP node_load1 1m load average.
# TYPE node_load1 gauge
node_load1 1.1181640625
# HELP node_load15 15m load average.
# TYPE node_load15 gauge
node_load15 1.494140625
# HELP node_load5 5m load average.
# TYPE node_load5 gauge
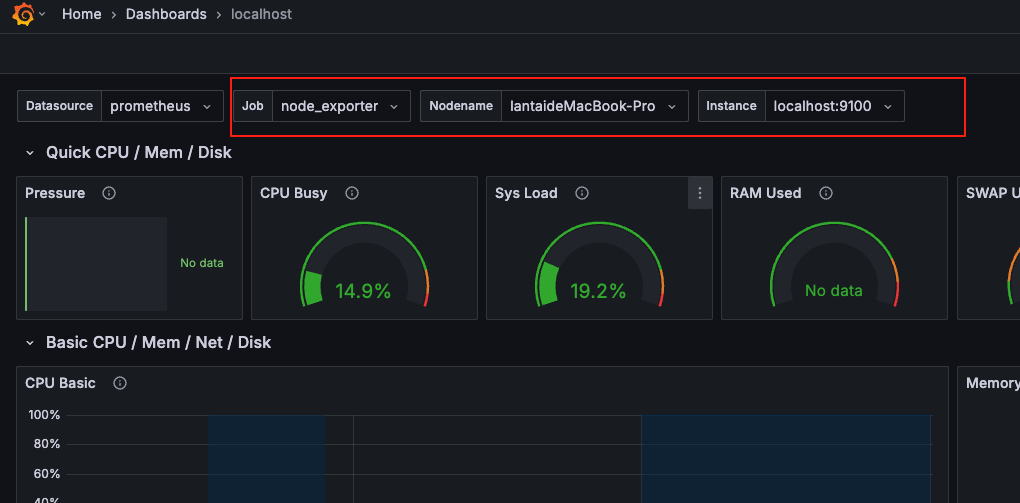
node_load5 1.306640625查询主机负载变化情况(1分钟平均负载)
通过 Graph面板,用户还能直接使用 PromQL实时查询监控数据
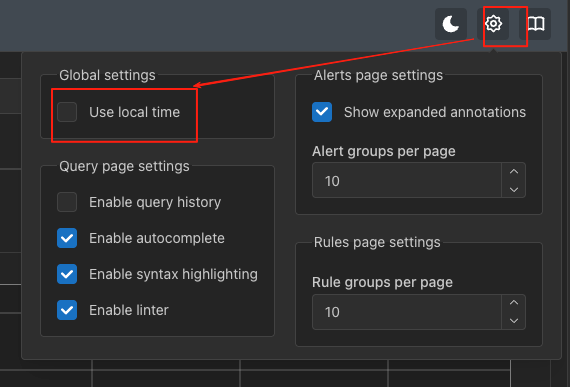
采用本地时间显示设置
三、使用mysql Exporter采集mysql数据
docker启动一个msyql
bash
docker run -d \
  --name mysql-server \
  -p 3306:3306 \
  -p 9104:9104 \
  -e MYSQL_DATABASE=test \
  -e MYSQL_ROOT_PASSWORD=test \
  -e MYSQL_USER=test \
  -e MYSQL_PASSWORD=test \
  mysql:8.0
下载mysql 的 msyql exporter的包
bash
# 确定容器架构 (通常是 amd64 或 arm64)
uname -m  # 返回 x86_64 或 aarch64
#
x86_64 → 下载 linux-amd64
aarch64 → 下载 linux-arm64
到 Prometheus mysqld_exporter 的 GitHub 仓库 查看下载相应架构版本
bash
wget https://github.com/prometheus/mysqld_exporter/releases/download/v0.17.2/mysqld_exporter-0.17.2.linux-arm64.tar.gz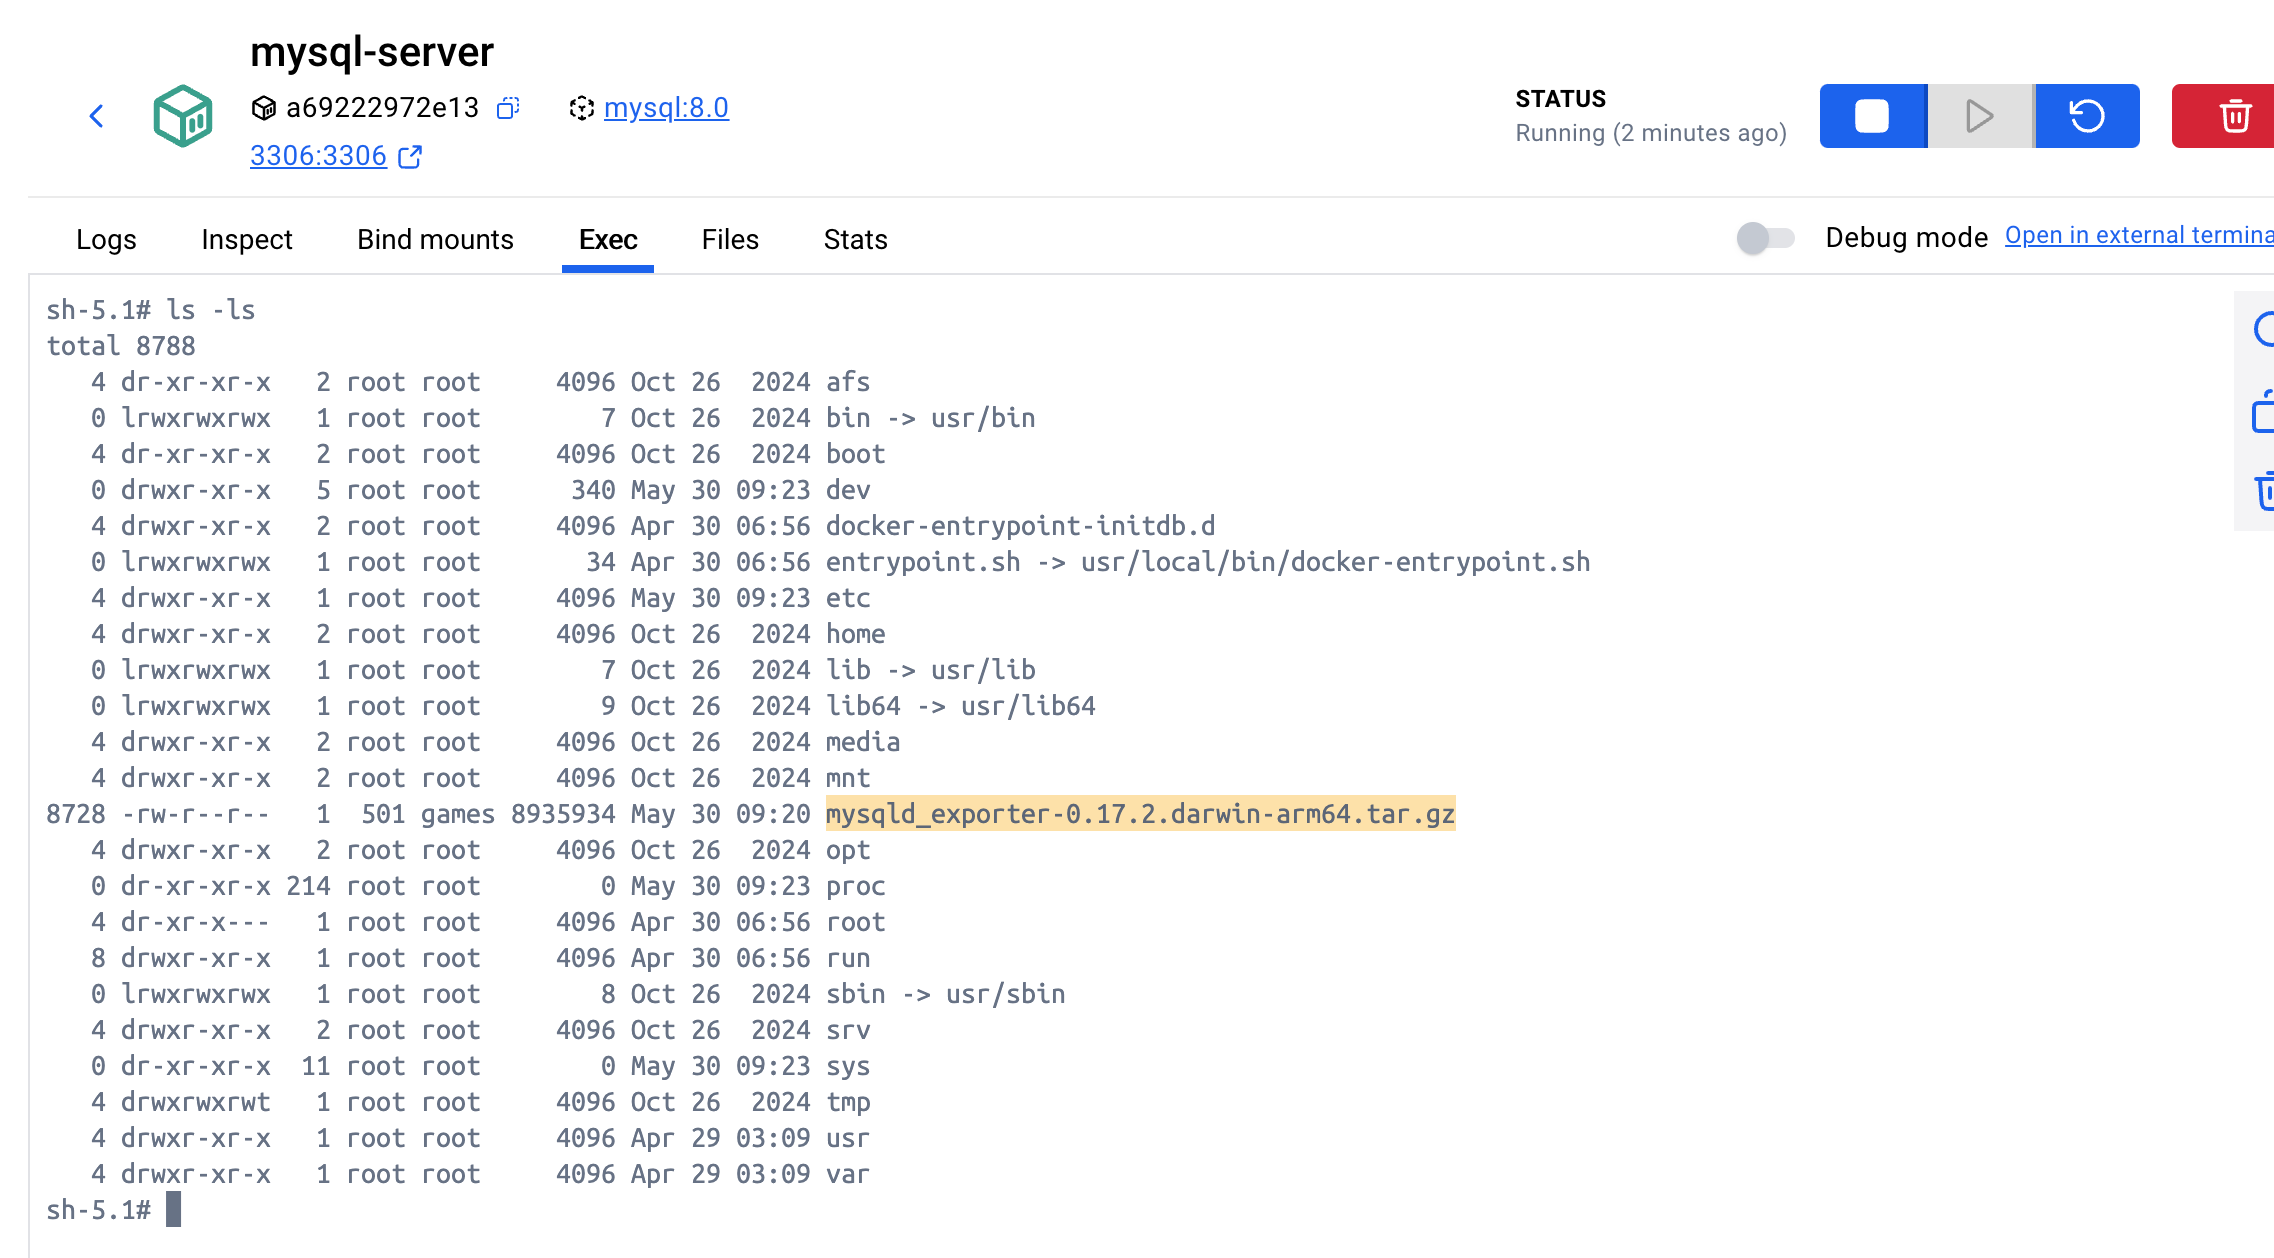
解压到指定目录
bash
tar xf mysqld_exporter-0.17.2.linux-arm64.tar.gz -C /usr/local/
cd /usr/local
mv mysqld_exporter-0.17.2.linux-arm64 mysqld_exporter
cd mysqld_exporter
使用最小权限(最佳实践)
创建专用采集数据的用户
bash
# 创建专用数据采集用户
sh-5.1# mysql -u root -p

CREATE USER 'repl_monitor'@'%' IDENTIFIED BY '123456';
GRANT REPLICATION CLIENT ON *.* TO 'repl_monitor'@'%';
GRANT SHOW DATABASES ON *.* TO 'repl_monitor'@'%';
GRANT PROCESS ON *.* TO 'repl_monitor'@'%';
FLUSH PRIVILEGES;- 定期轮换密码:为采集用户设置定期密码更换策略。
创建配置文件
bash
# 创建连接配置文件(填入之前创建的监控用户信息)
cat > .my.cnf << EOF
[client]
user=repl_monitor
password=123456
host=localhost
EOF

# 设置权限
chmod 600 .my.cnf
创建启动脚本
bash
cat > /usr/local/mysqld_exporter/run.sh << EOF
#!/bin/bash
#启动mysql exporter
/usr/local/mysqld_exporter/mysqld_exporter --config.my-cnf=/usr/local/mysqld_exporter/.my.cnf --web.listen-address=:9104
EOF

# 添加执行权限
chmod +x /usr/local/mysqld_exporter/run.sh
后台启动
bash
nohup /usr/local/mysqld_exporter/run.sh &验证 Exporter 是否正常运行
访问 http://localhost:9104/metrics,应看到 MySQL 相关指标。
为Prometheus添加mysql监控项
在 Prometheus 的配置文件 prometheus.yml 中添加 MySQL Exporter 的抓取任务。
在 scrape_configs 部分添加如下配置:
bash
  - job_name: "mysql"
    static_configs:
      - targets: ["localhost:9104"]
prometheus.yml 完整示例:
bash
global:
  scrape_interval: 15s
  evaluation_interval: 15s

rule_files:
  # - "first.rules"
  # - "second.rules"

scrape_configs:
  - job_name: "prometheus"
    static_configs:
      - targets: ["localhost:9090"]
        labels:
          app: "prometheus"

  - job_name: "node"
    static_configs:
      - targets: ["localhost:9100"]

  - job_name: "mysql"
    static_configs:
      - targets: ["localhost:9104"]
Prometheus中验证mysql监控项
- Prometheus : 访问 http://localhost:9090/targets,可以看到如下结果:最若边要是UP
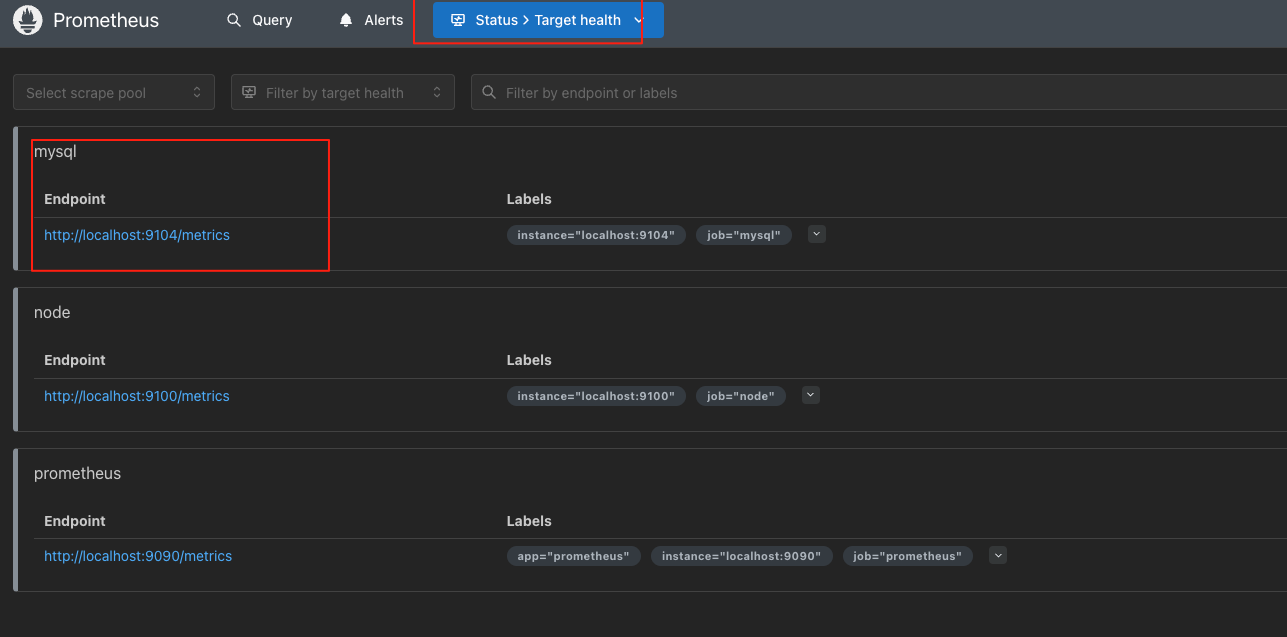
每次对接一种新的服务,就需要修改一下Prometheus的配置文件然后重新加载服务,这是一个很繁琐的事情,因此是不适合生产环境的大规模监控架构设计的。
基于文件的服务发现方式添加监控项
推荐将不同类型的服务(主机、数据库、应用)分开到不同的 job_name :
cat targets_mysql.yml
yaml
- targets: ["localhost:9104"]
  labels:
    app: "mysql_server"
    host_type: "container"
cat targets_node.yml
yaml
- targets: ["localhost:9100"]
  labels:
    app: "localhost"
    host_type: "physical
编辑 prometheus.yml 引用 targets_node.yml 与targets_mysql.yml 主机清单文件
原理:Prometheus 会按照指定的 refresh_interval(这里是 1 分钟)定期读取 targets.yml文件。
当这些主机清单文件文件内容发生变化,比如添加或删除了目标主机信息,Prometheus 会自动更新监控目标列表,无需重启服务 。
yaml
global:
  scrape_interval: 15s
  evaluation_interval: 15s

scrape_configs:
  - job_name: "prometheus"
    static_configs:
      - targets: ["localhost:9090"]
        labels:
          app: "prometheus"

  # 1. 主机类型的监控,单独一个主机清单定义文件
  - job_name: "node_exporter"
    file_sd_configs:
      - files:
        - "targets_node.yml"
        refresh_interval: 1m

  # 2. MySQL同类服务监控,单独一个主机清单定义文件
  - job_name: "mysql_exporter"
    file_sd_configs:
      - files:
        - "targets_mysql.yml"
        refresh_interval: 1m  # 可单独调整频率
启动Prometheus验证效果:
yaml
./prometheus --config.file=prometheus.yml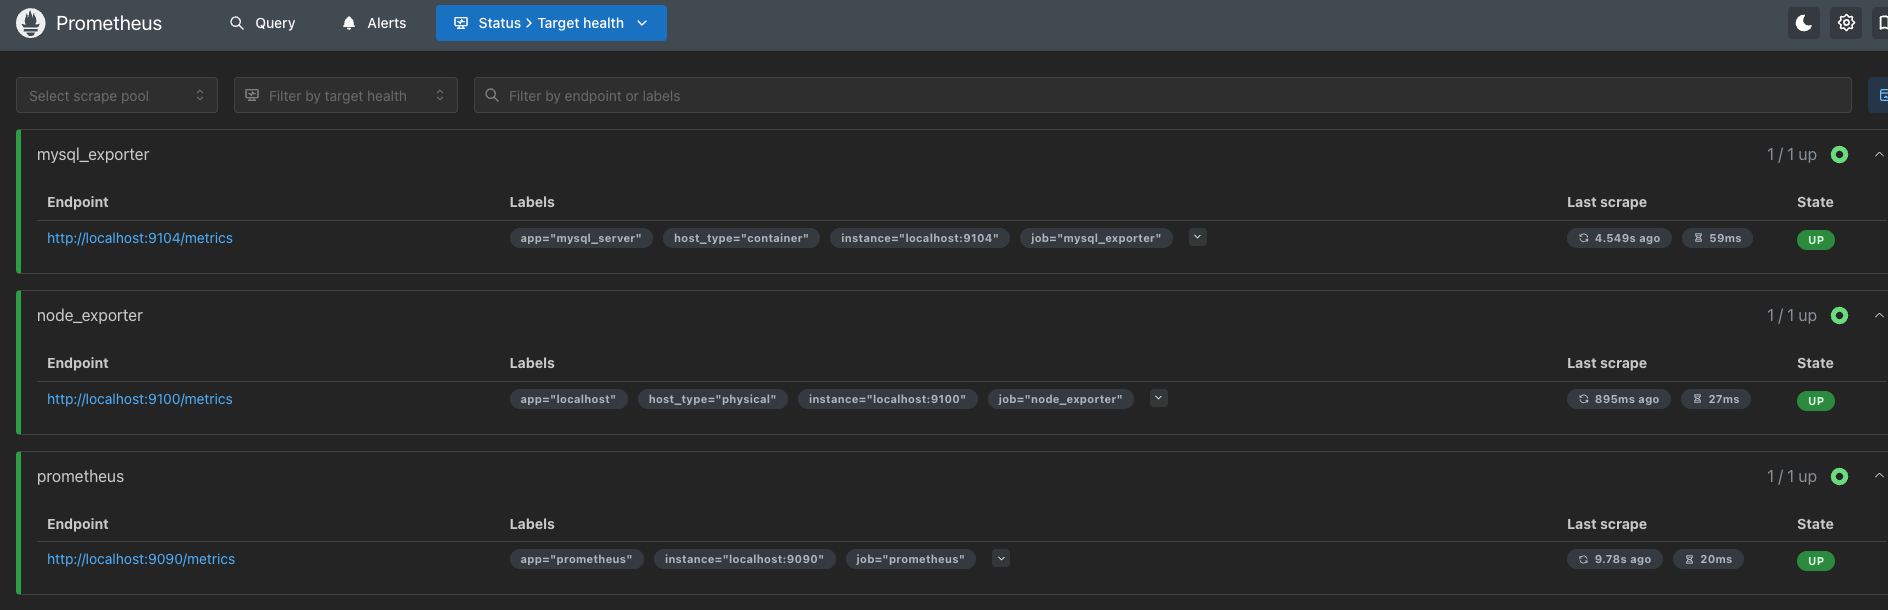
图形里面也好筛选查看具体那一台
Grafana中添加mysql数据源
前提配置好grafana,参考四
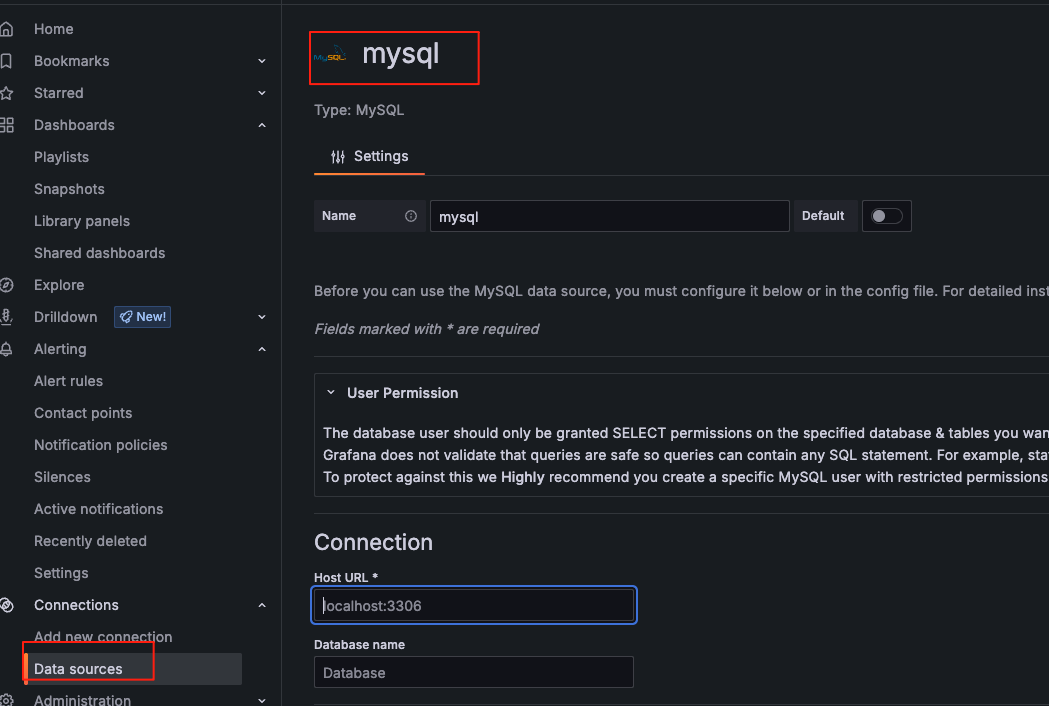
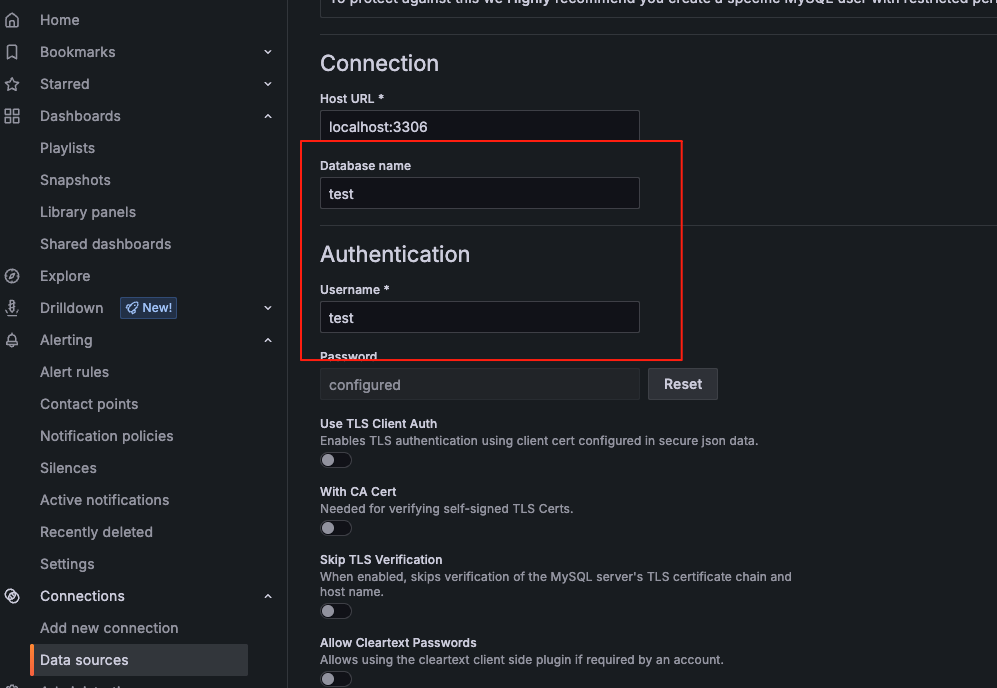
连接验证等配置(这里采用有连接test库权限的用户test)
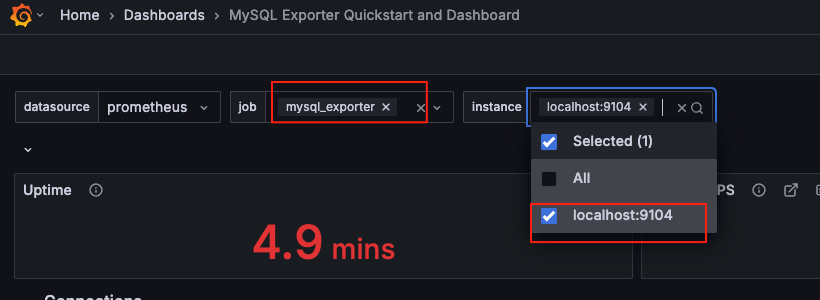
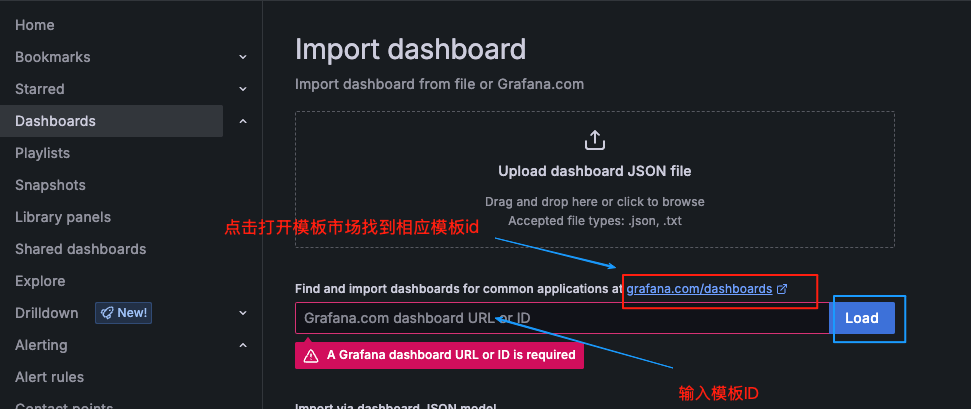
在dashboard中导入mysql图形模板
使用https://grafana.com/grafana/dashboards/14057-mysql/ 图形模板 输入14057
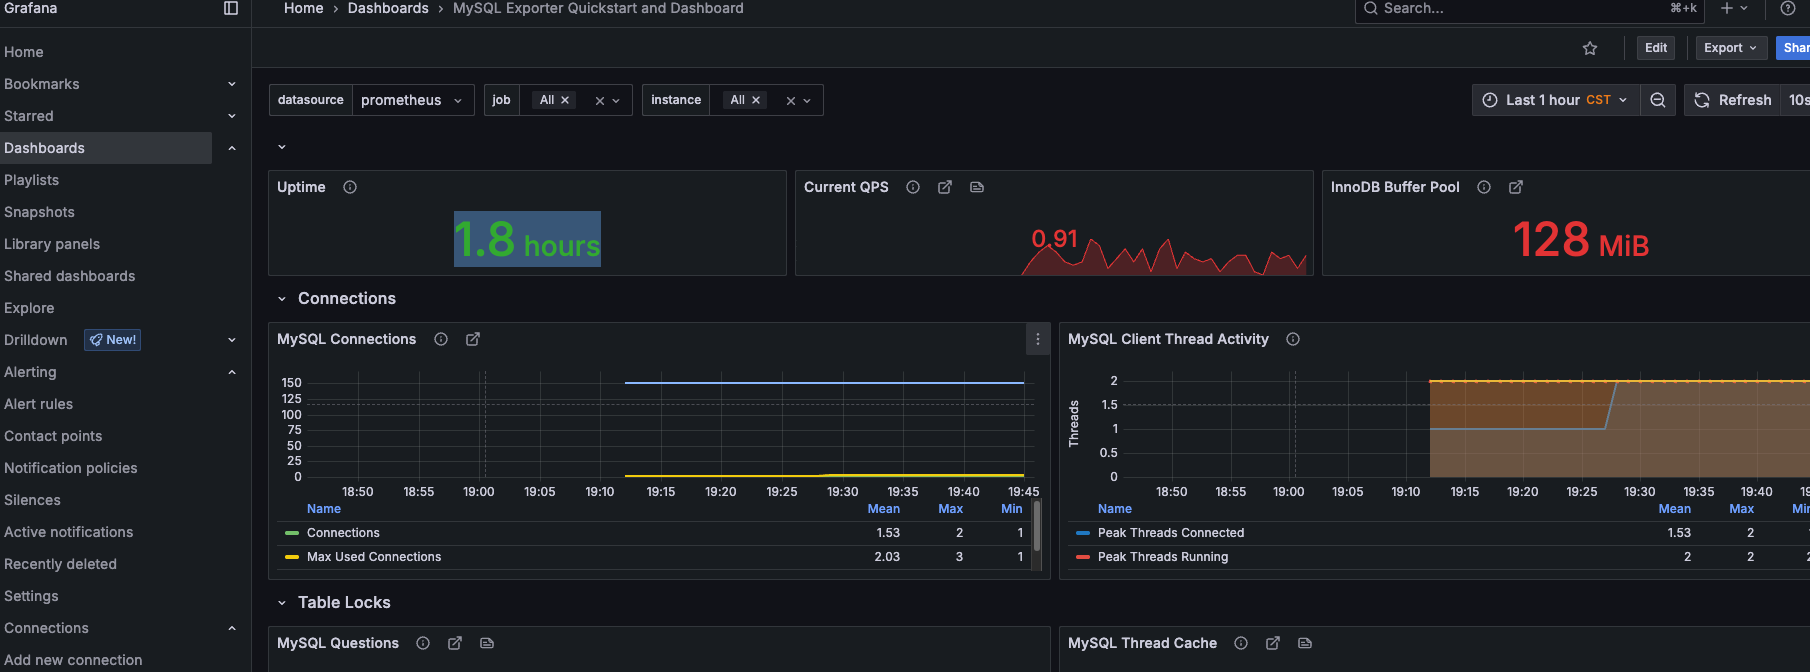
最终数据图形展示如下
四、使用Grafana创建可视化Dashboard
Prometheus UI提供了快速验证PromQL以及临时可视化支持的能力,而在大多数场景下引入监控系统通常还需要构建可以长期使用的监控数据可视化面板(Dashboard)。这时用户可以考虑使用第三方的可视化工具如Grafana,Grafana是一个开源的可视化平台,并且提供了对Prometheus的完整支持。
Install Grafana | Grafana documentation
在 RHEL 或 Fedora 上安装 Grafana
导入 GPG 密钥
plain
wget -q -O gpg.key https://rpm.grafana.com/gpg.key
sudo rpm --import gpg.key
创建包 /etc/yum.repos.d/grafana.repo
plain
[grafana]
name=grafana
baseurl=https://rpm.grafana.com
repo_gpgcheck=1
enabled=1
gpgcheck=1
gpgkey=https://rpm.grafana.com/gpg.key
sslverify=1
sslcacert=/etc/pki/tls/certs/ca-bundle.crt
安装 Grafana oss 开源版
plain
sudo dnf install grafana安装Grafana Enterprise(企业版)
plain
sudo dnf install grafana-enterprise在 macos上安装 Grafana
下载安装并启动
plain
brew update
brew install grafana
brew services start grafana
查看服务状态
bash
# 列出所有 Homebrew 服务
brew services list
# 查看 Grafana 详细状态
brew services info grafana
lsof -i :3000
启动/停止/重启服务
bash
brew services start grafana
brew services stop grafana
brew services restart grafana
Grafana仪表盘配置
访问:http://localhost:3000/login
输入默认凭证:
用户名:admin
密码:admin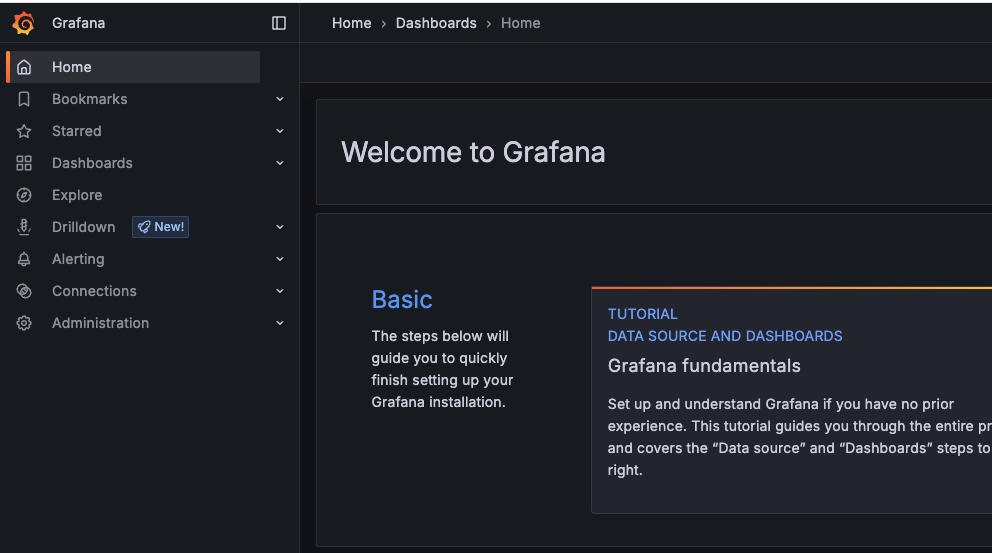
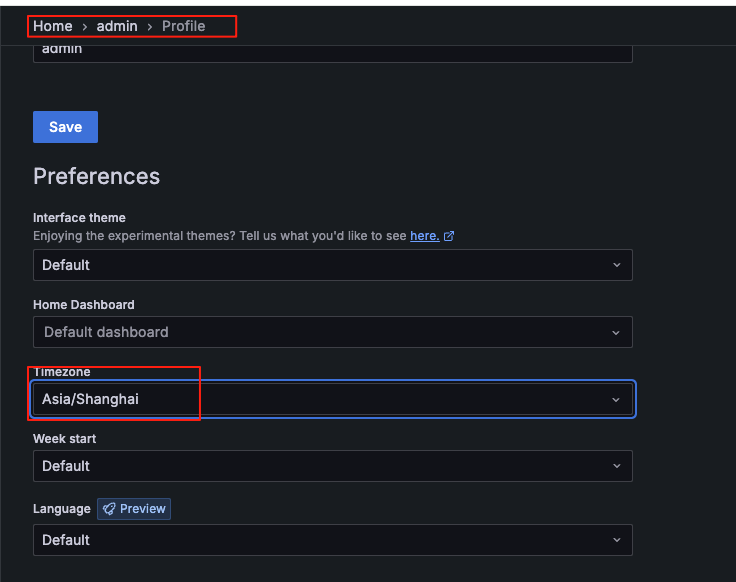
时区设置:
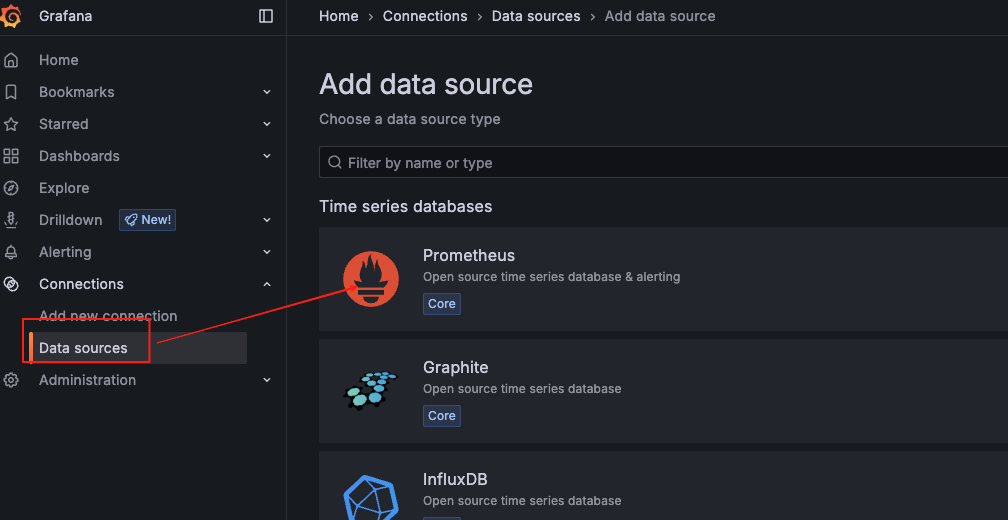
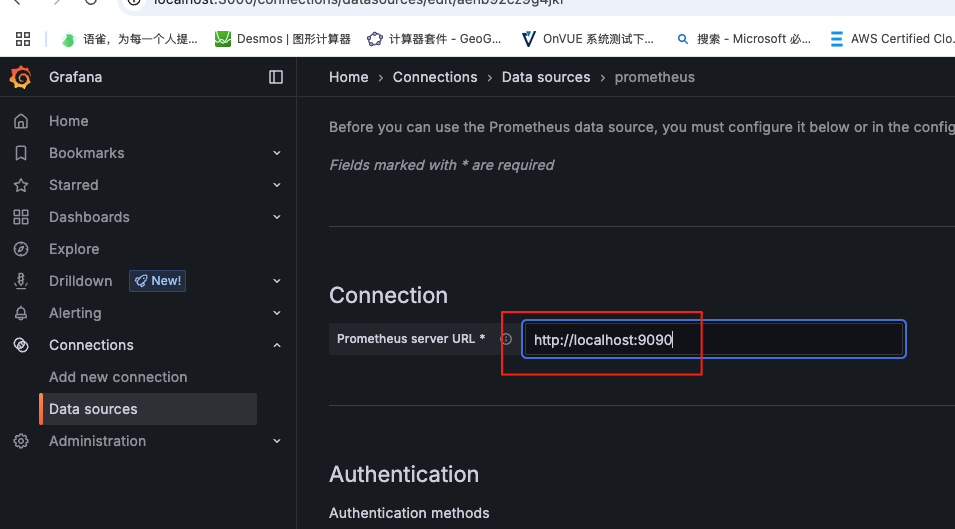
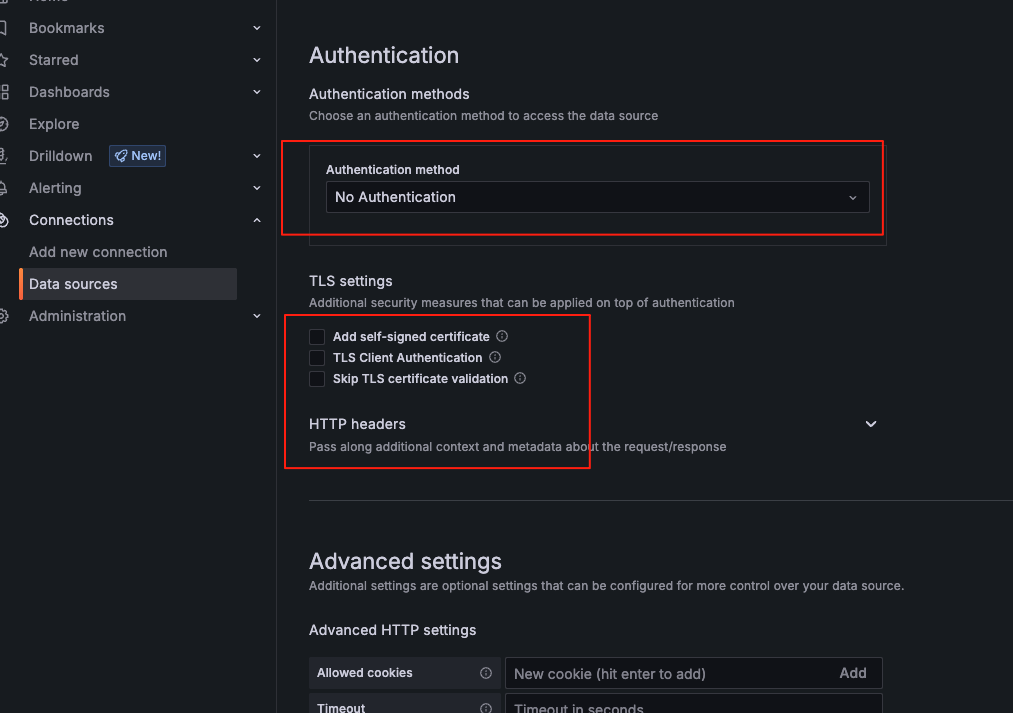
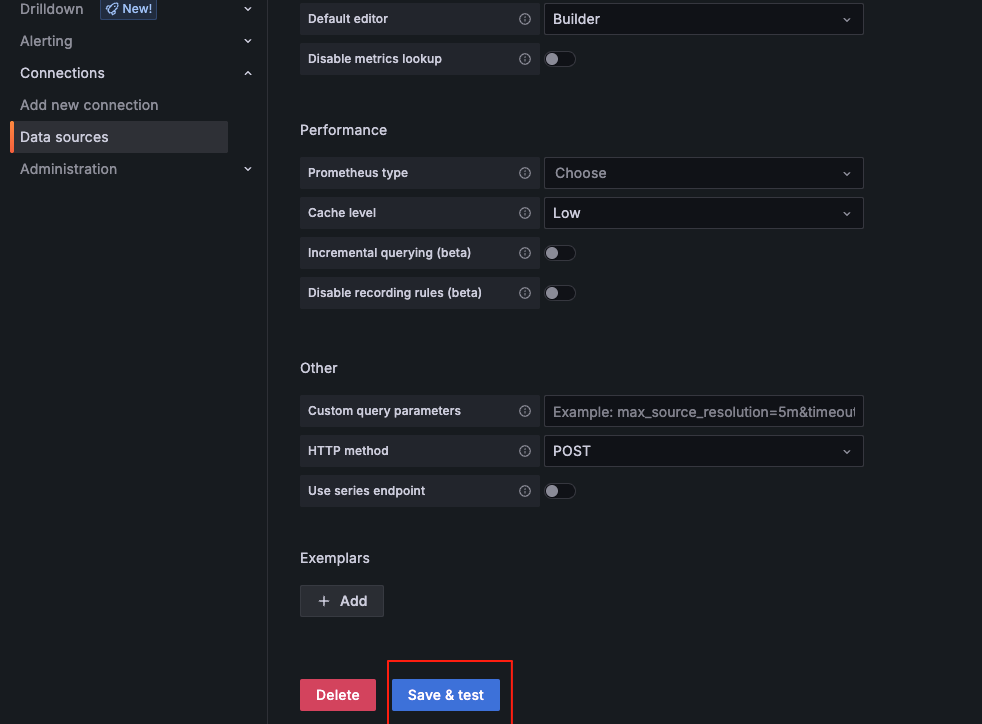
这里将添加Prometheus作为默认的数据源,如下图所示,指定数据源类型为Prometheus并且设置Prometheus的访问地址即可,在配置正确的情况下点击"Add"按钮,会提示连接成功的信息
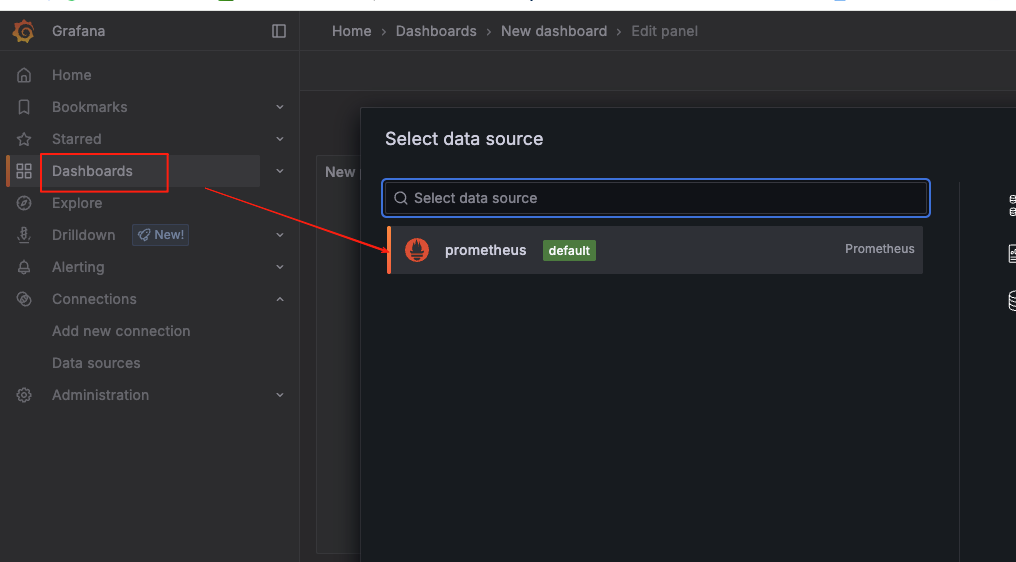
导入模板:
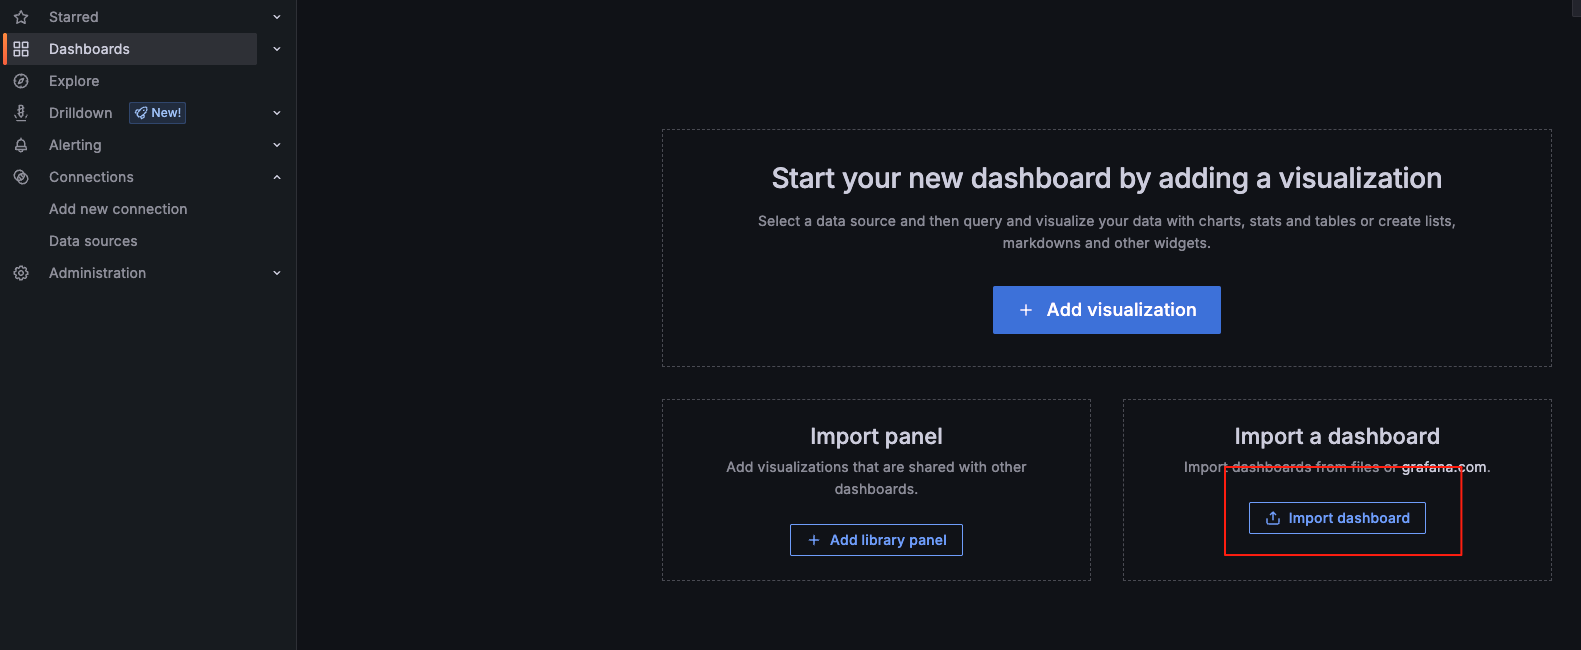
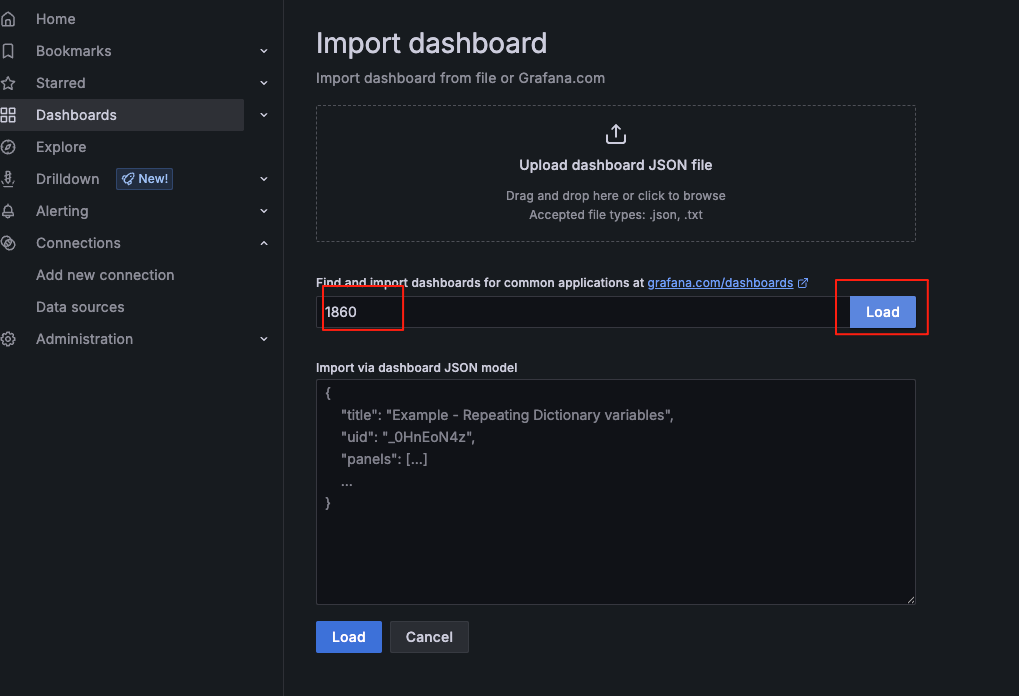
更多grafana模板: https://grafana.com/grafana/dashboards 搜索 相应 dashboards的id如1860
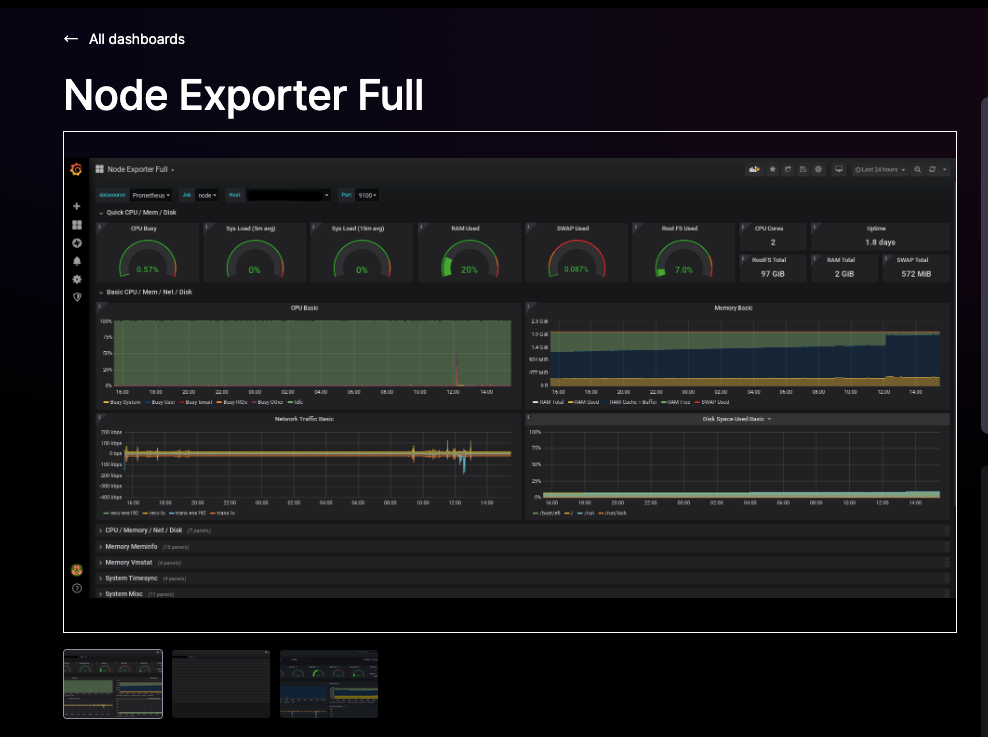
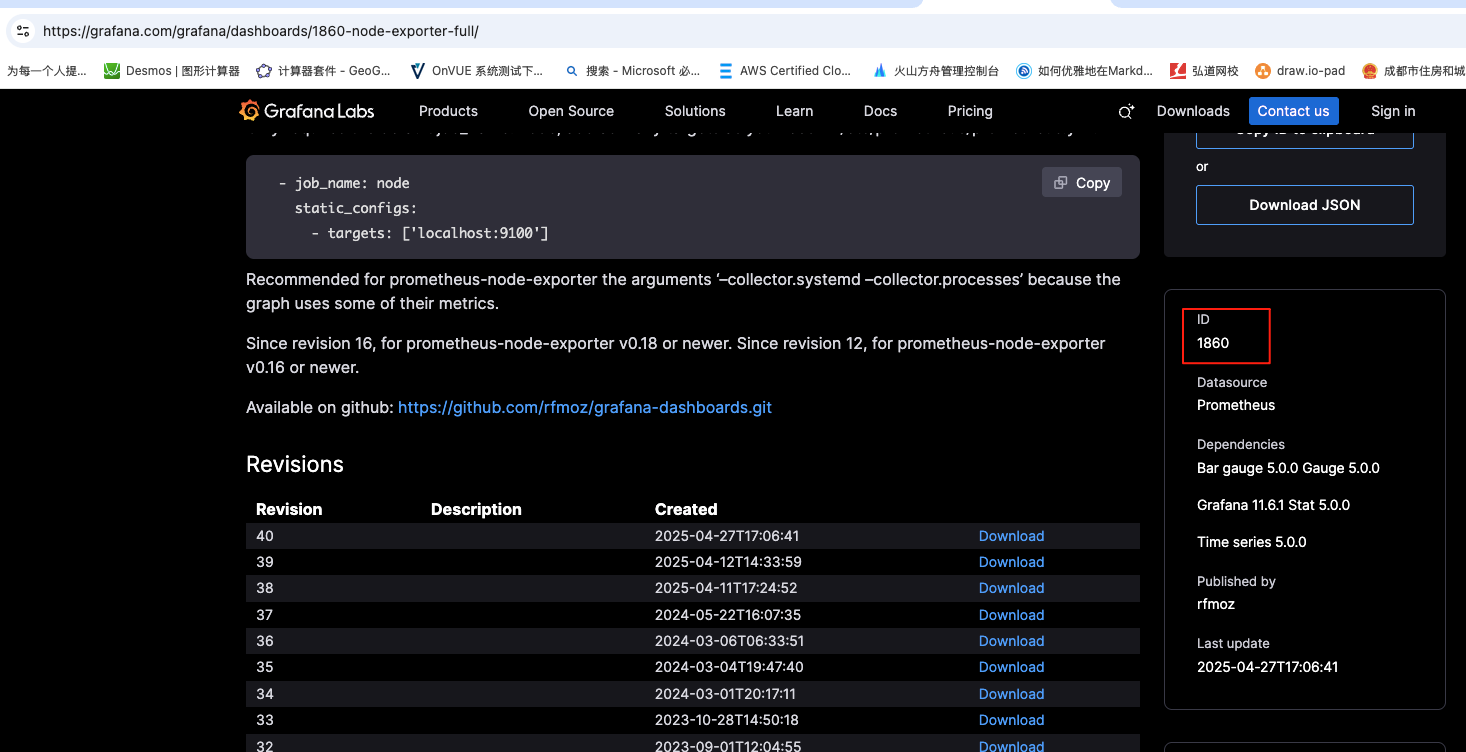
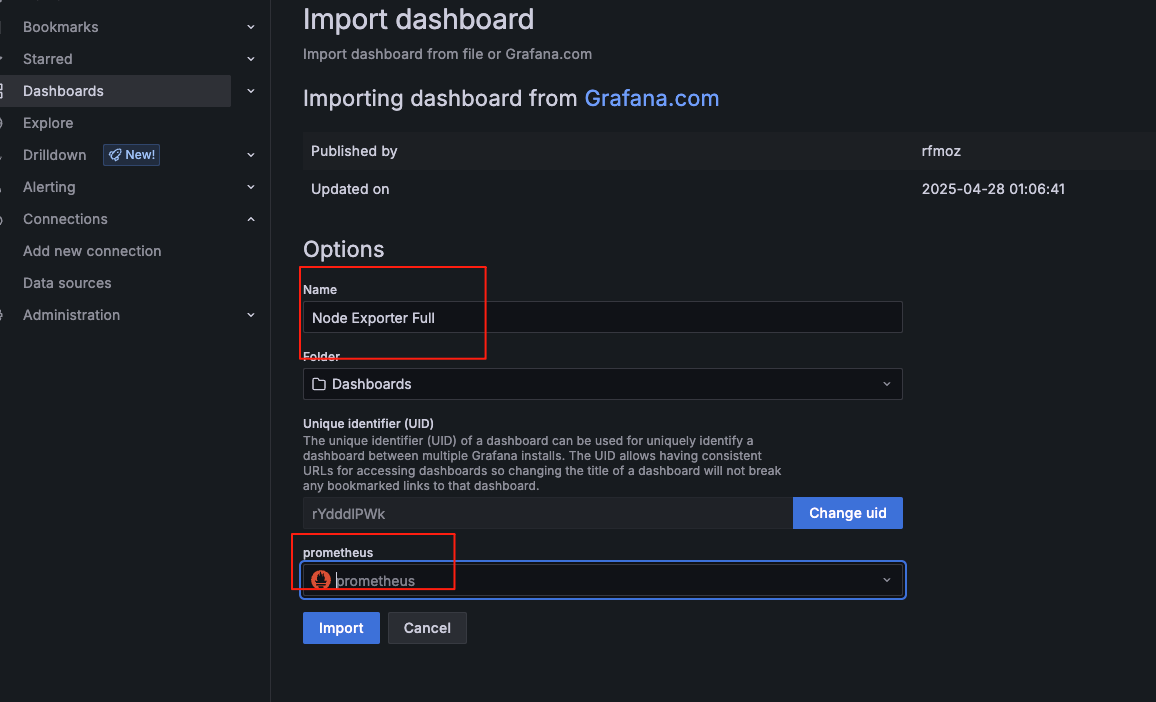
导入 1860模板
将 Grafana 设置为中文
Grafana 支持多语言界面,包括中文。您可以通过以下两种方式将其设置为中文:
登录 Grafana :访问 http://localhost:3000,使用管理员账号登录。
进入用户偏好设置 :
点击右上角头像 → 选择 Profile
修改语言 :
在 Language 下拉菜单中选择 中文 (简体)( Chinese (Simplified))。
保存并刷新 :
点击 Save preferences,页面会自动刷新为中文界面。
Grafana的监控指标
五、Grafana 报警规则的配置
报警规则配置参考链接:https://grafana.com/tutorials/alerting-get-started/
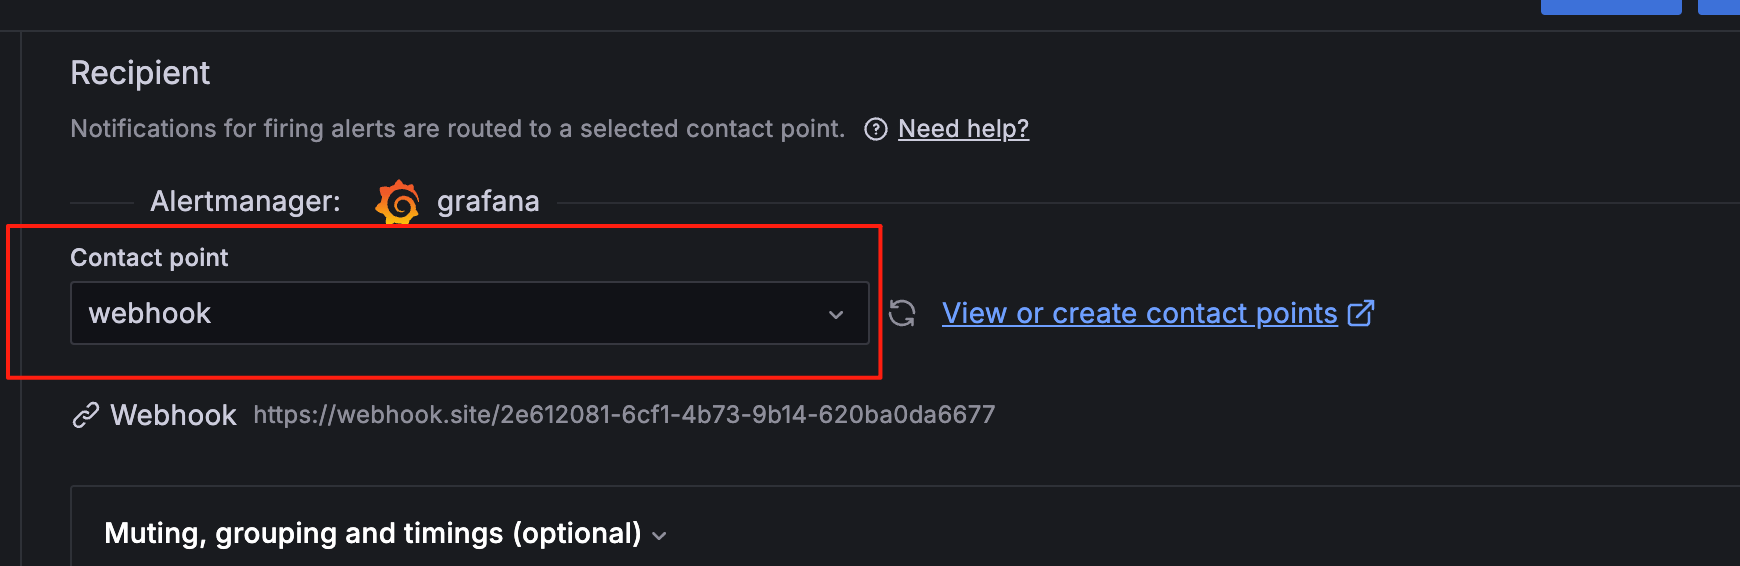
创建一个 Webhook 来接收报警信息:
在线webhook地址:https://webhook.site/
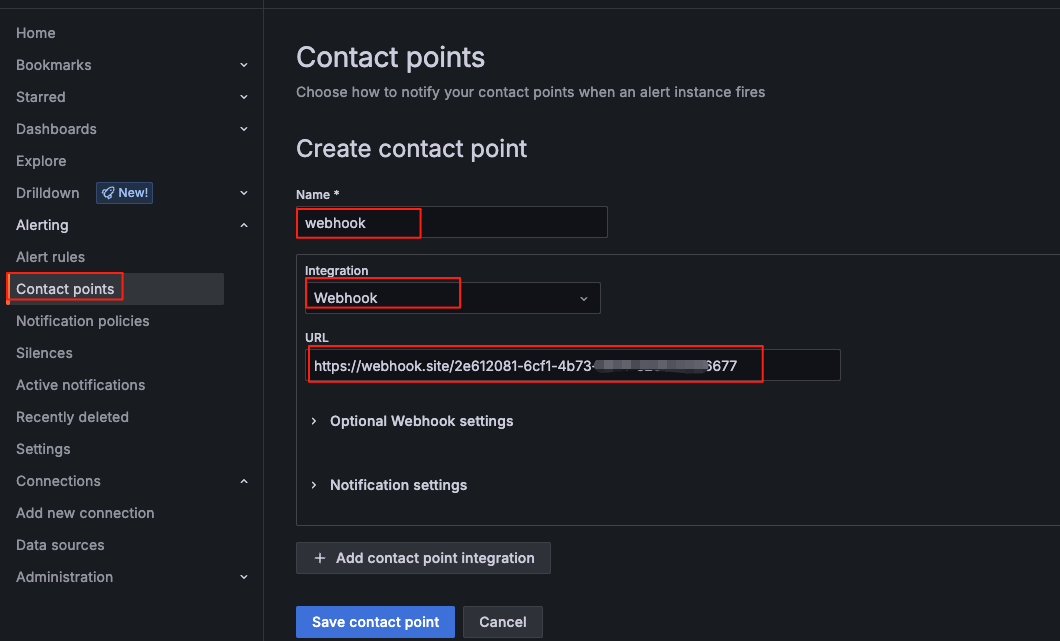
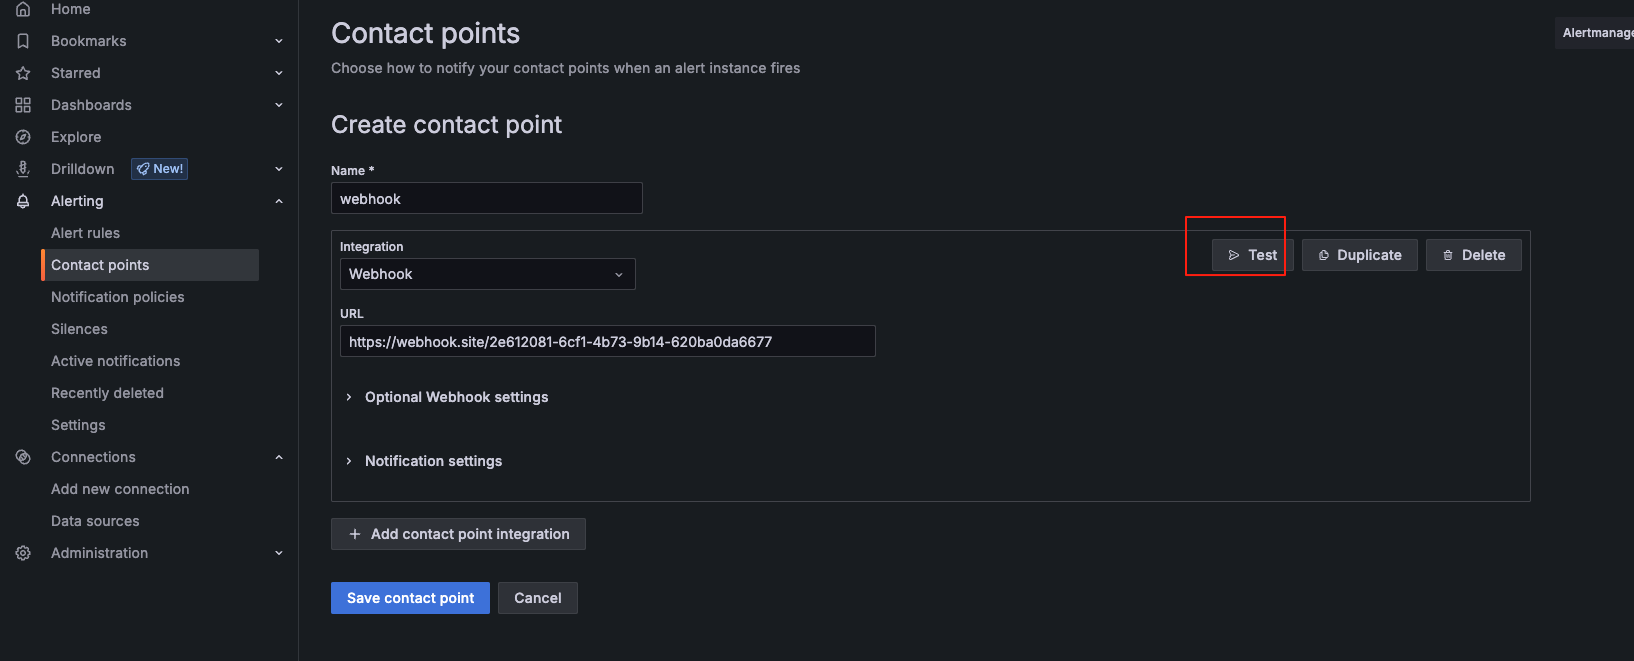
测试成功后--保存webhook配置
手工创建警报规则
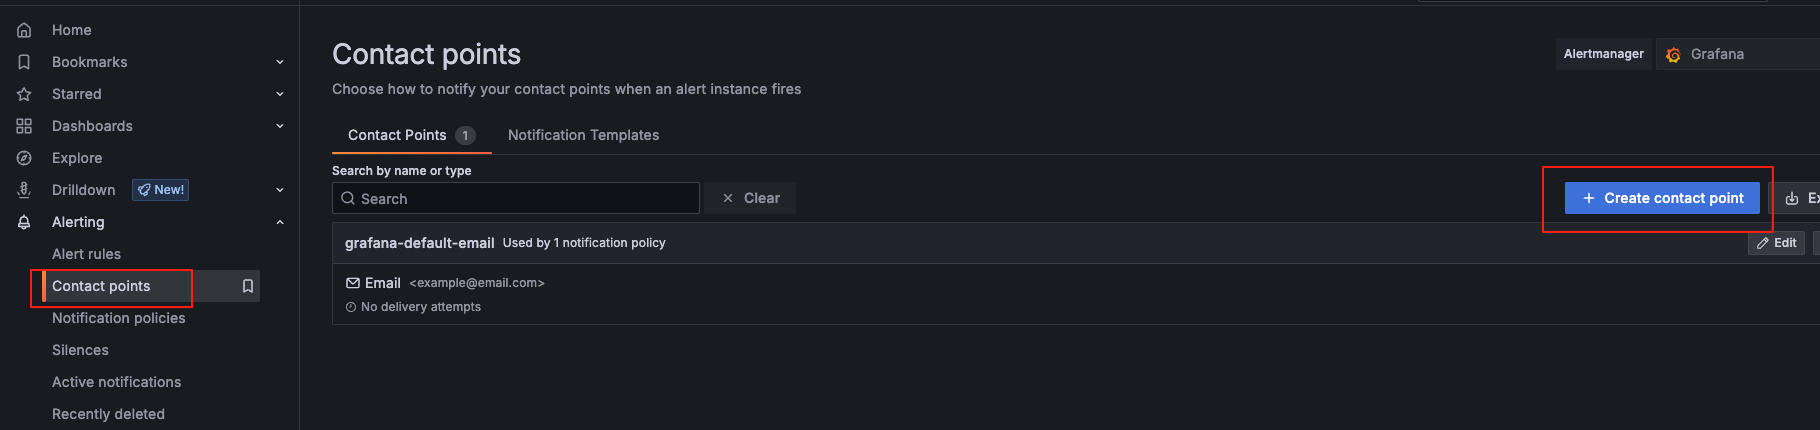
在 Grafana 中,导航到 Alerting > Alert rules 。
单击 + New alert rule(新建警报规则 )
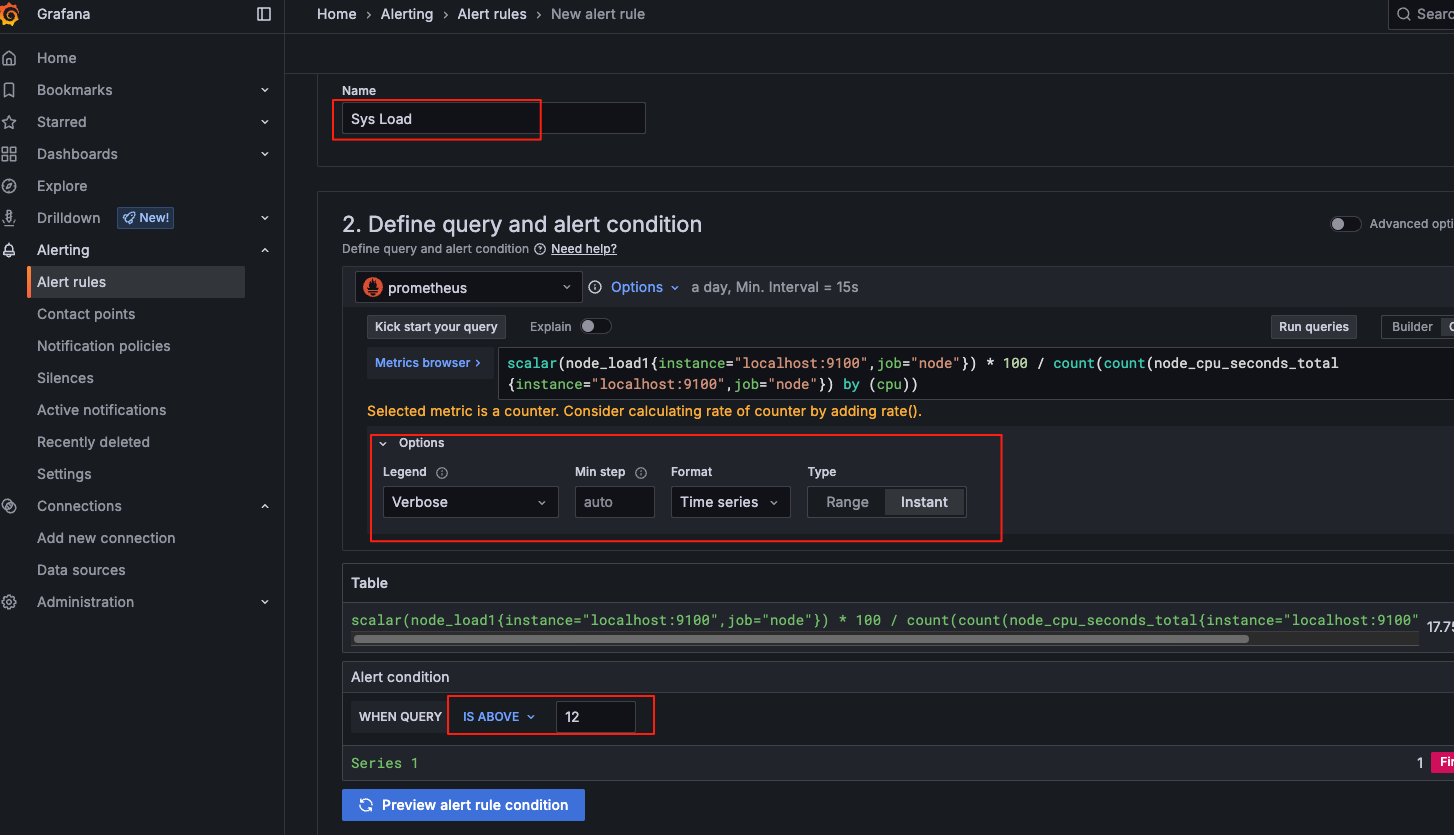
输入警报规则的警报规则名称。使其简短且具有描述性,因为它将显示在您的警报通知中。例如,database-metrics
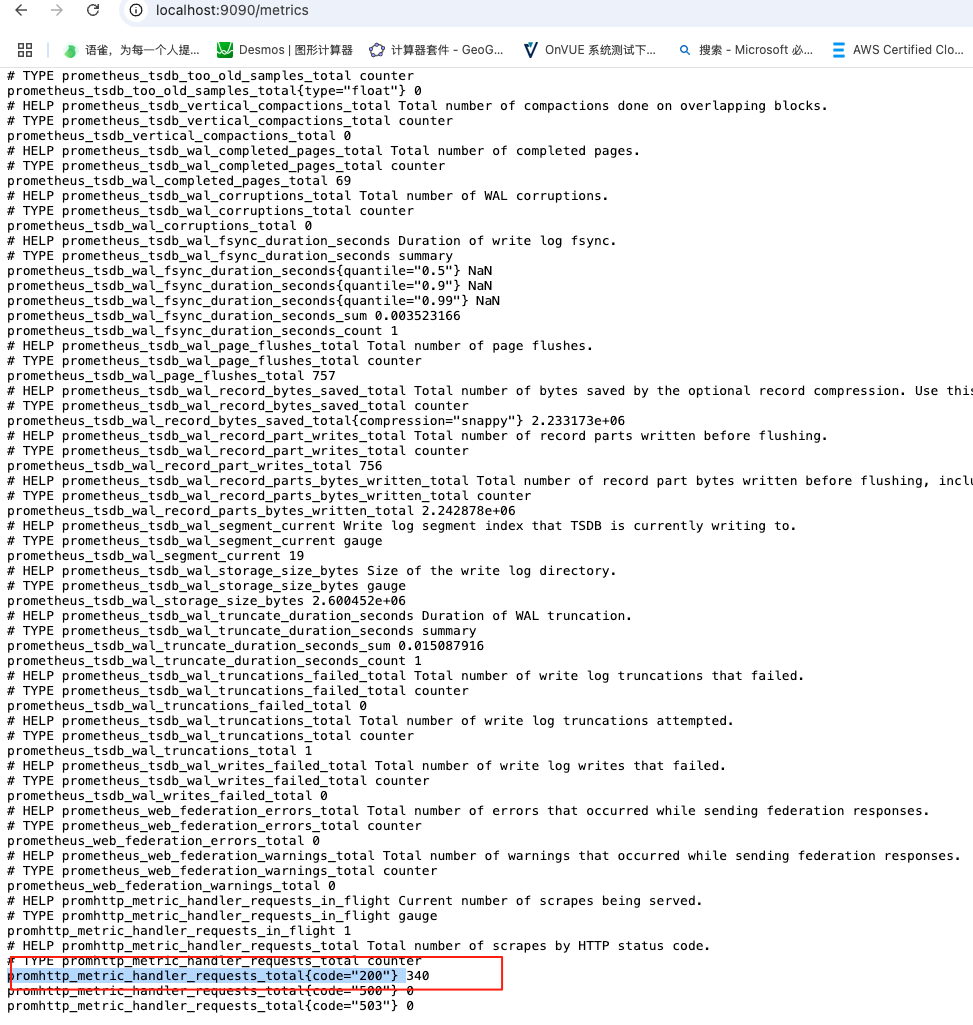
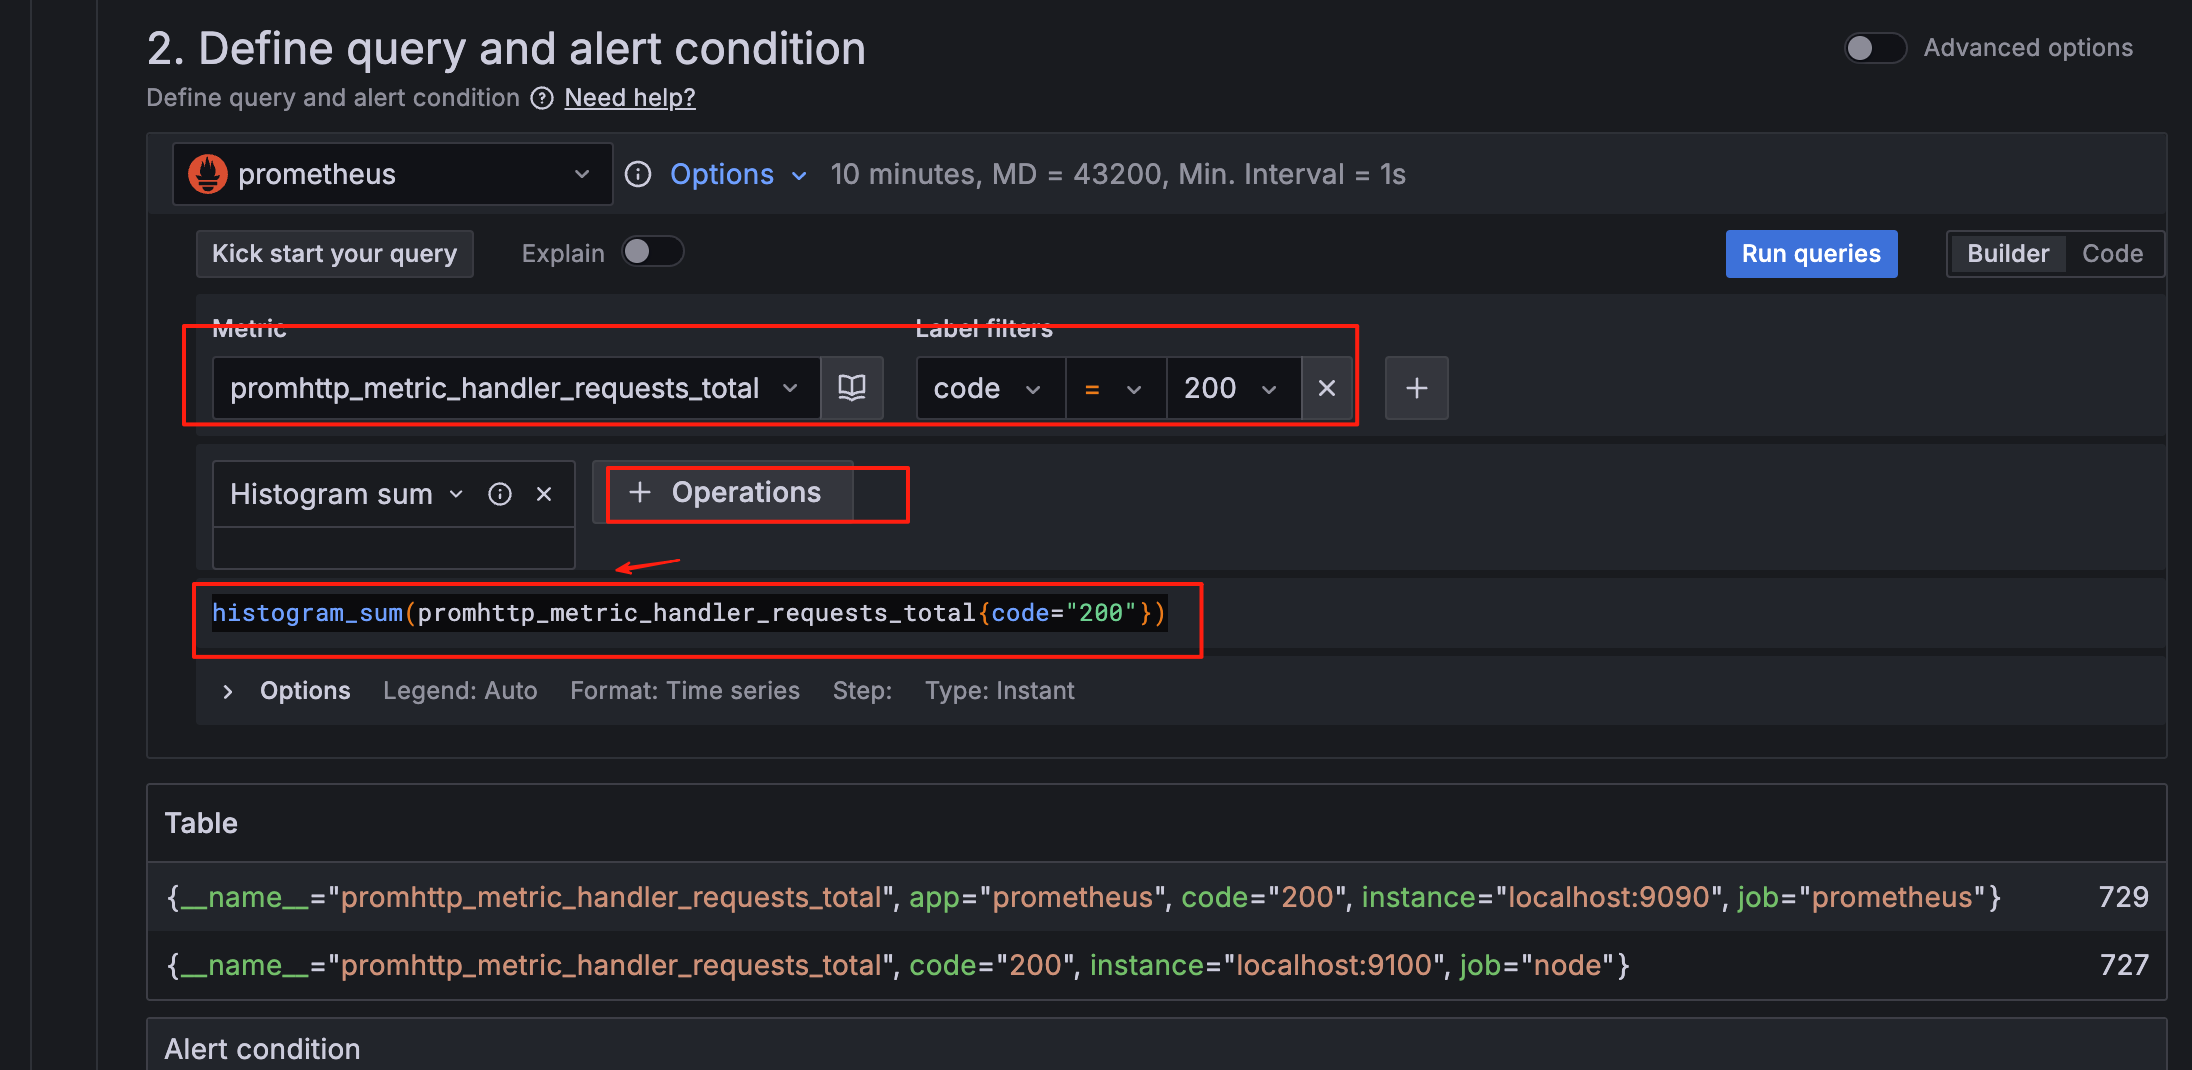
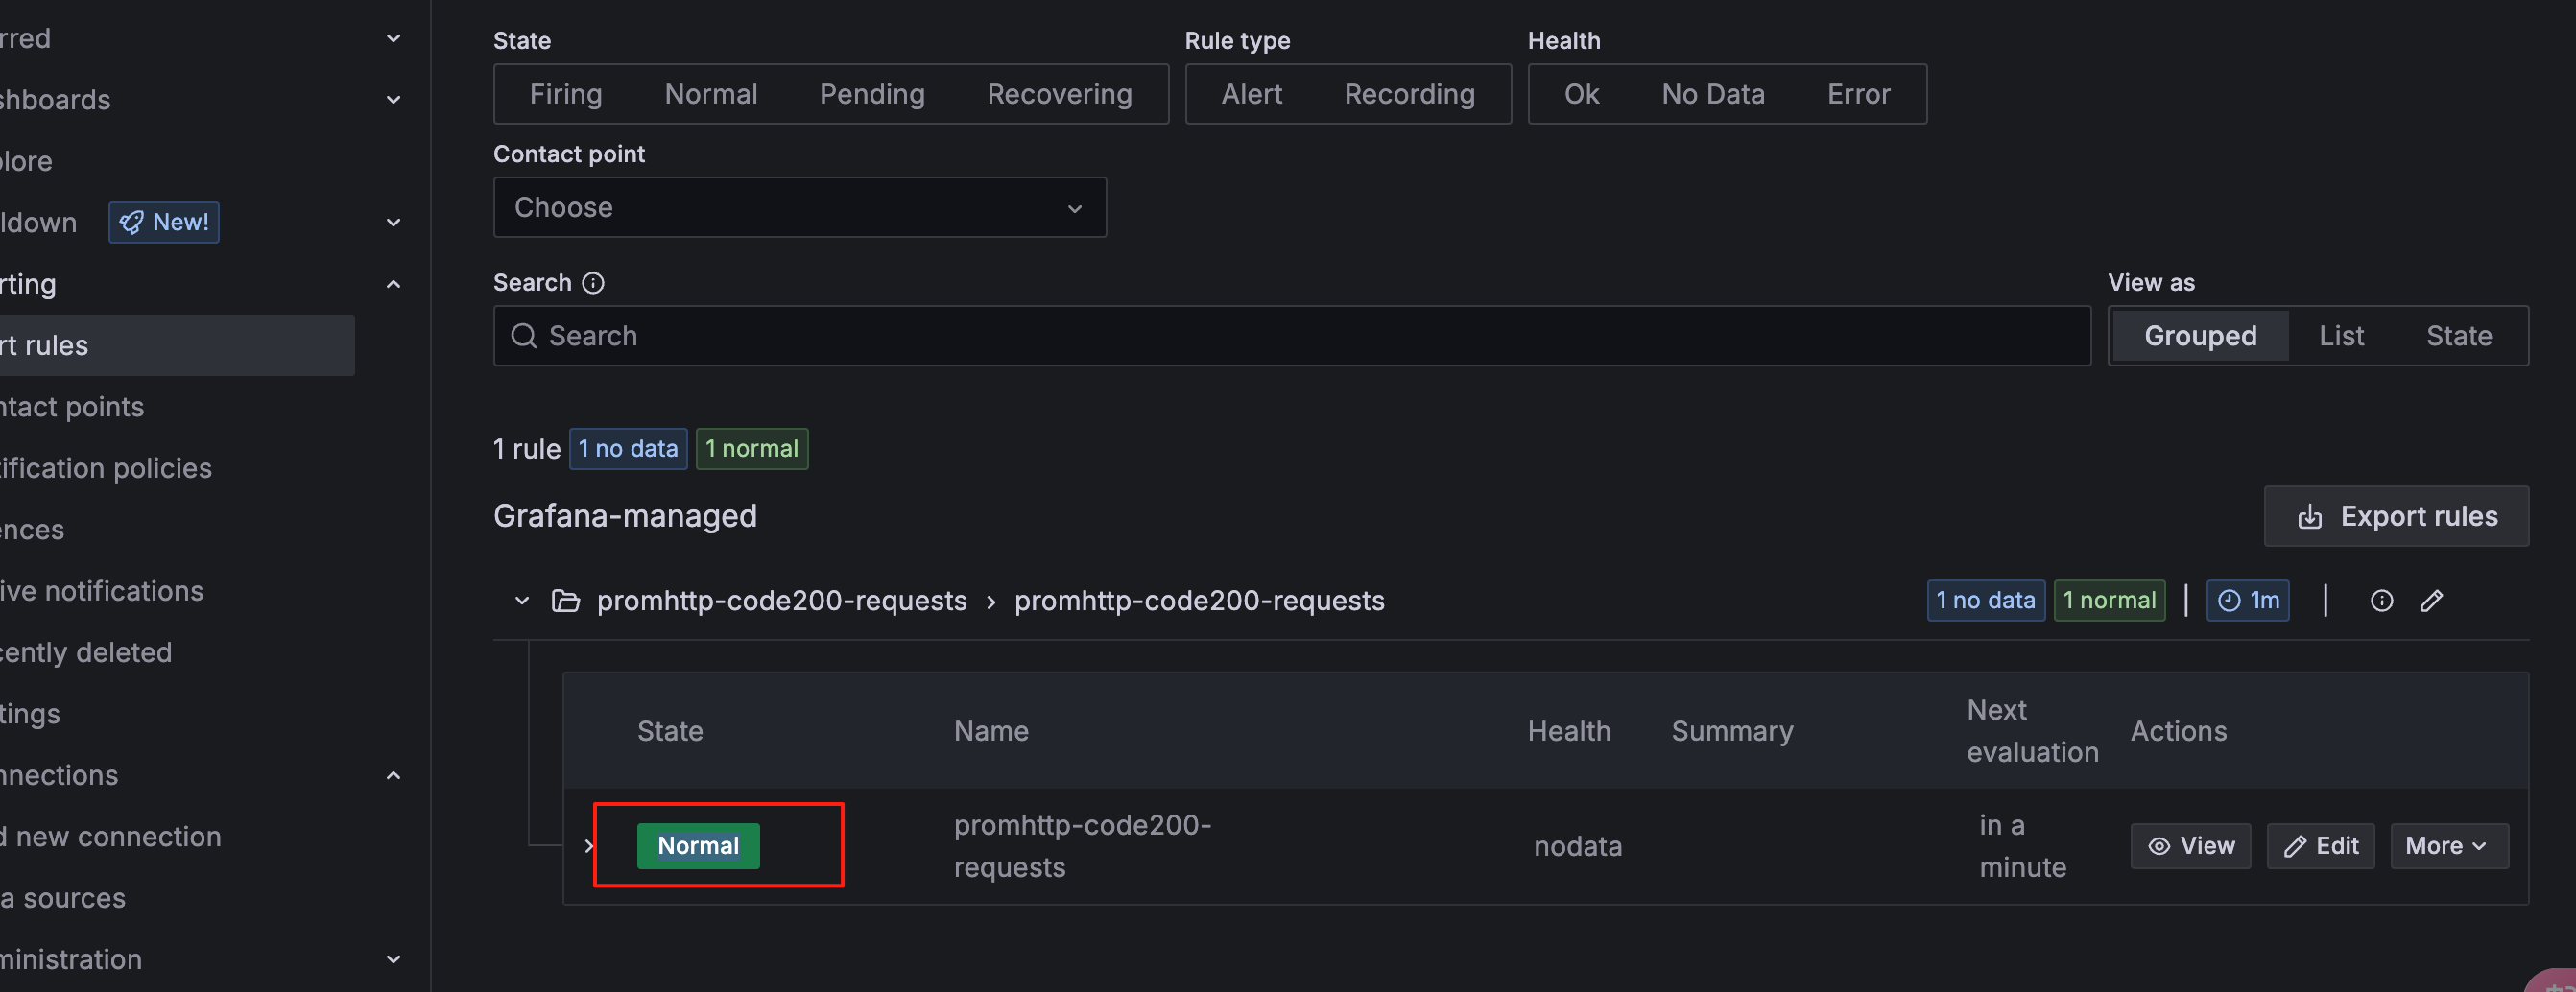
这里我们命名为promhttp-code200-requests,这里用promhttp_metric_handler_requests_total{code="200"} 的统计次数模拟报警
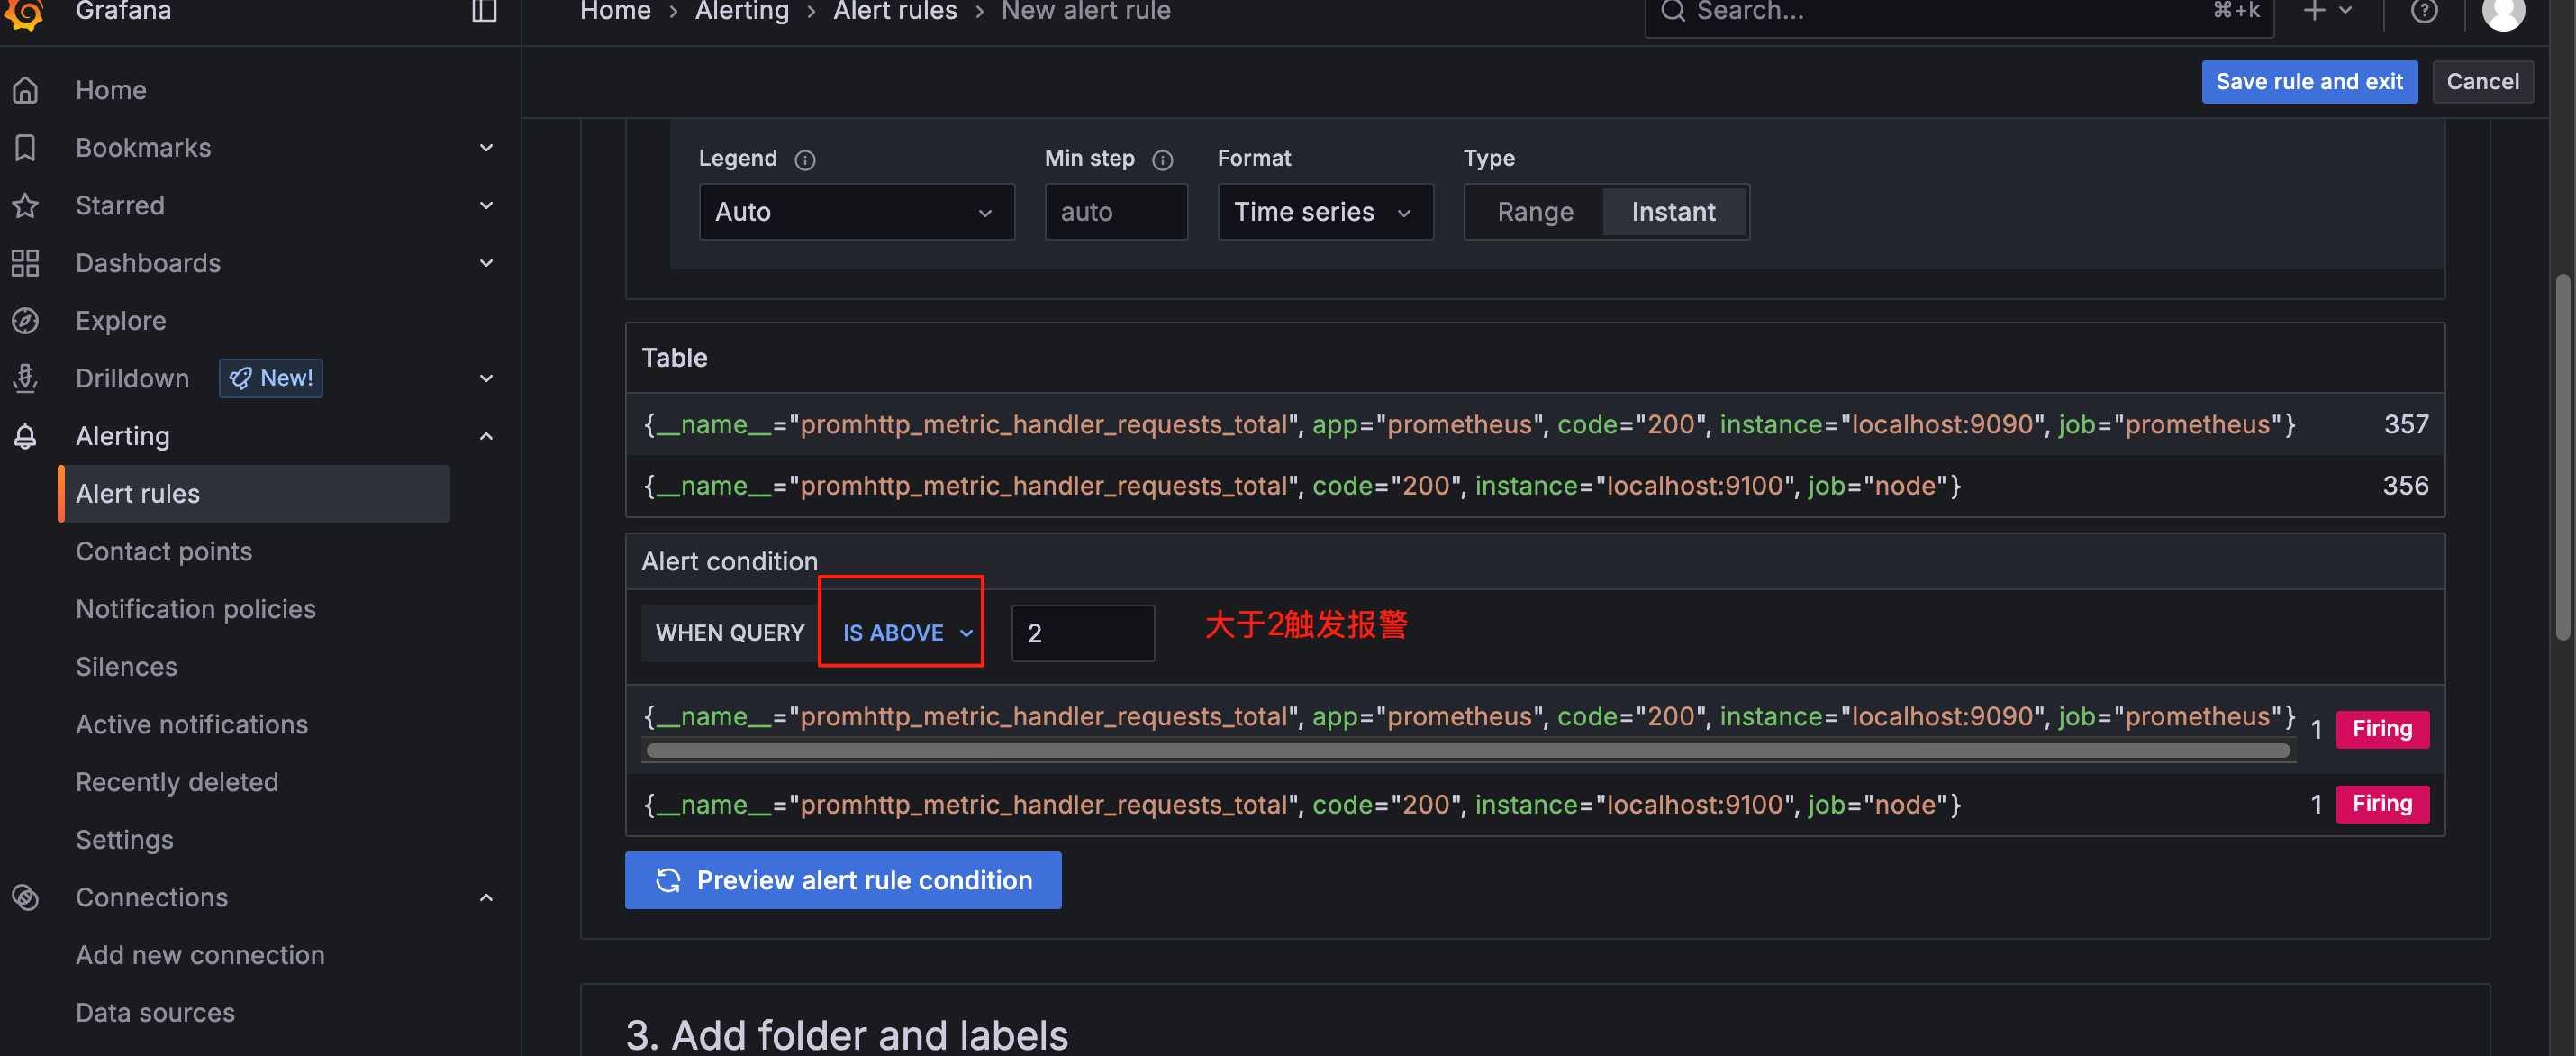
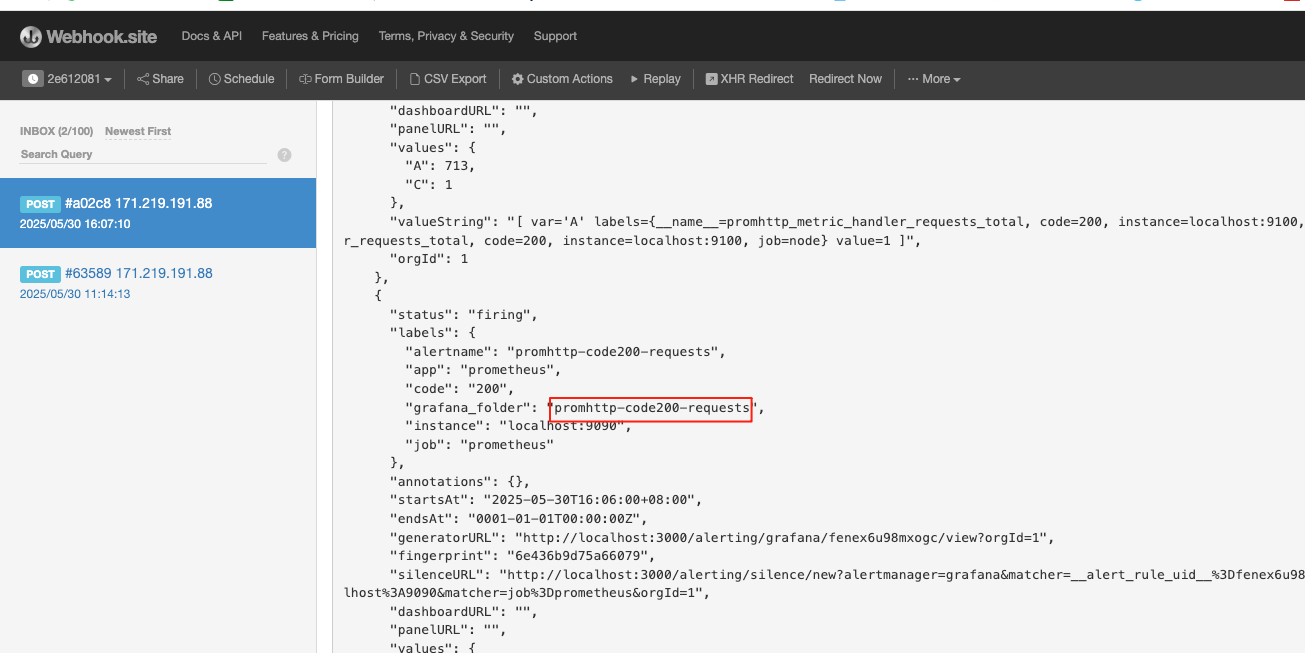
点击 save rule and exit 保存, "Firing" 状态表示规则已触发,产生了告警
等待一分钟后,下面状态表示已正常
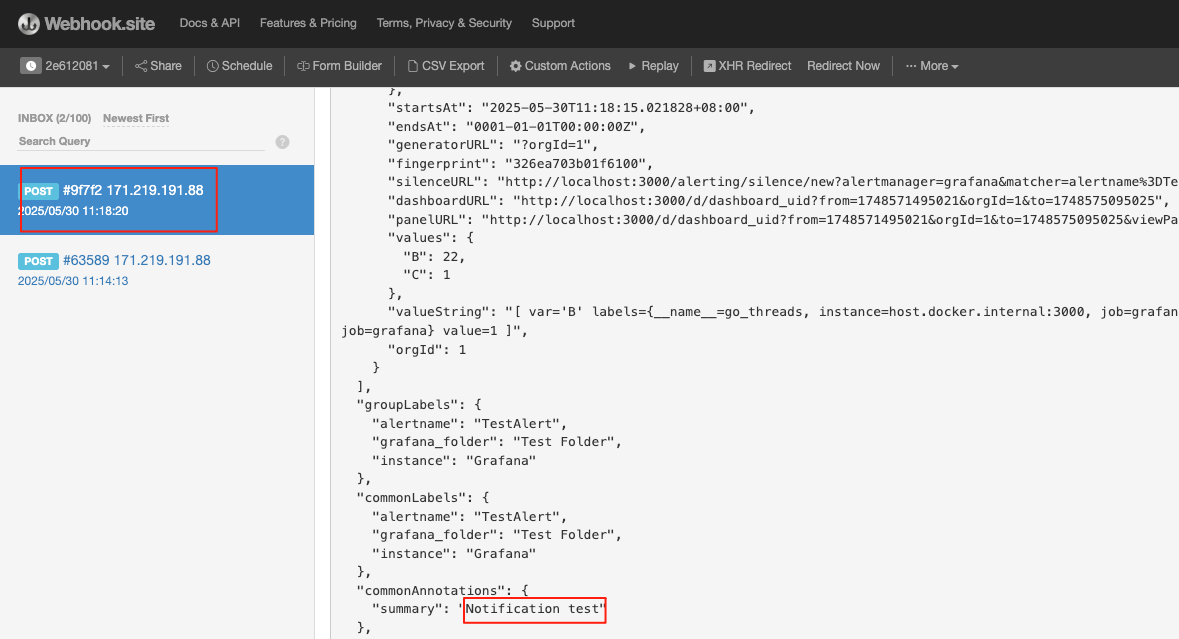
webhook已经收到警告信息
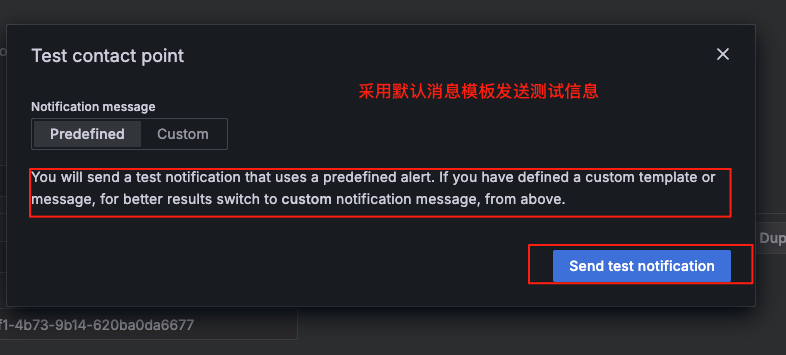
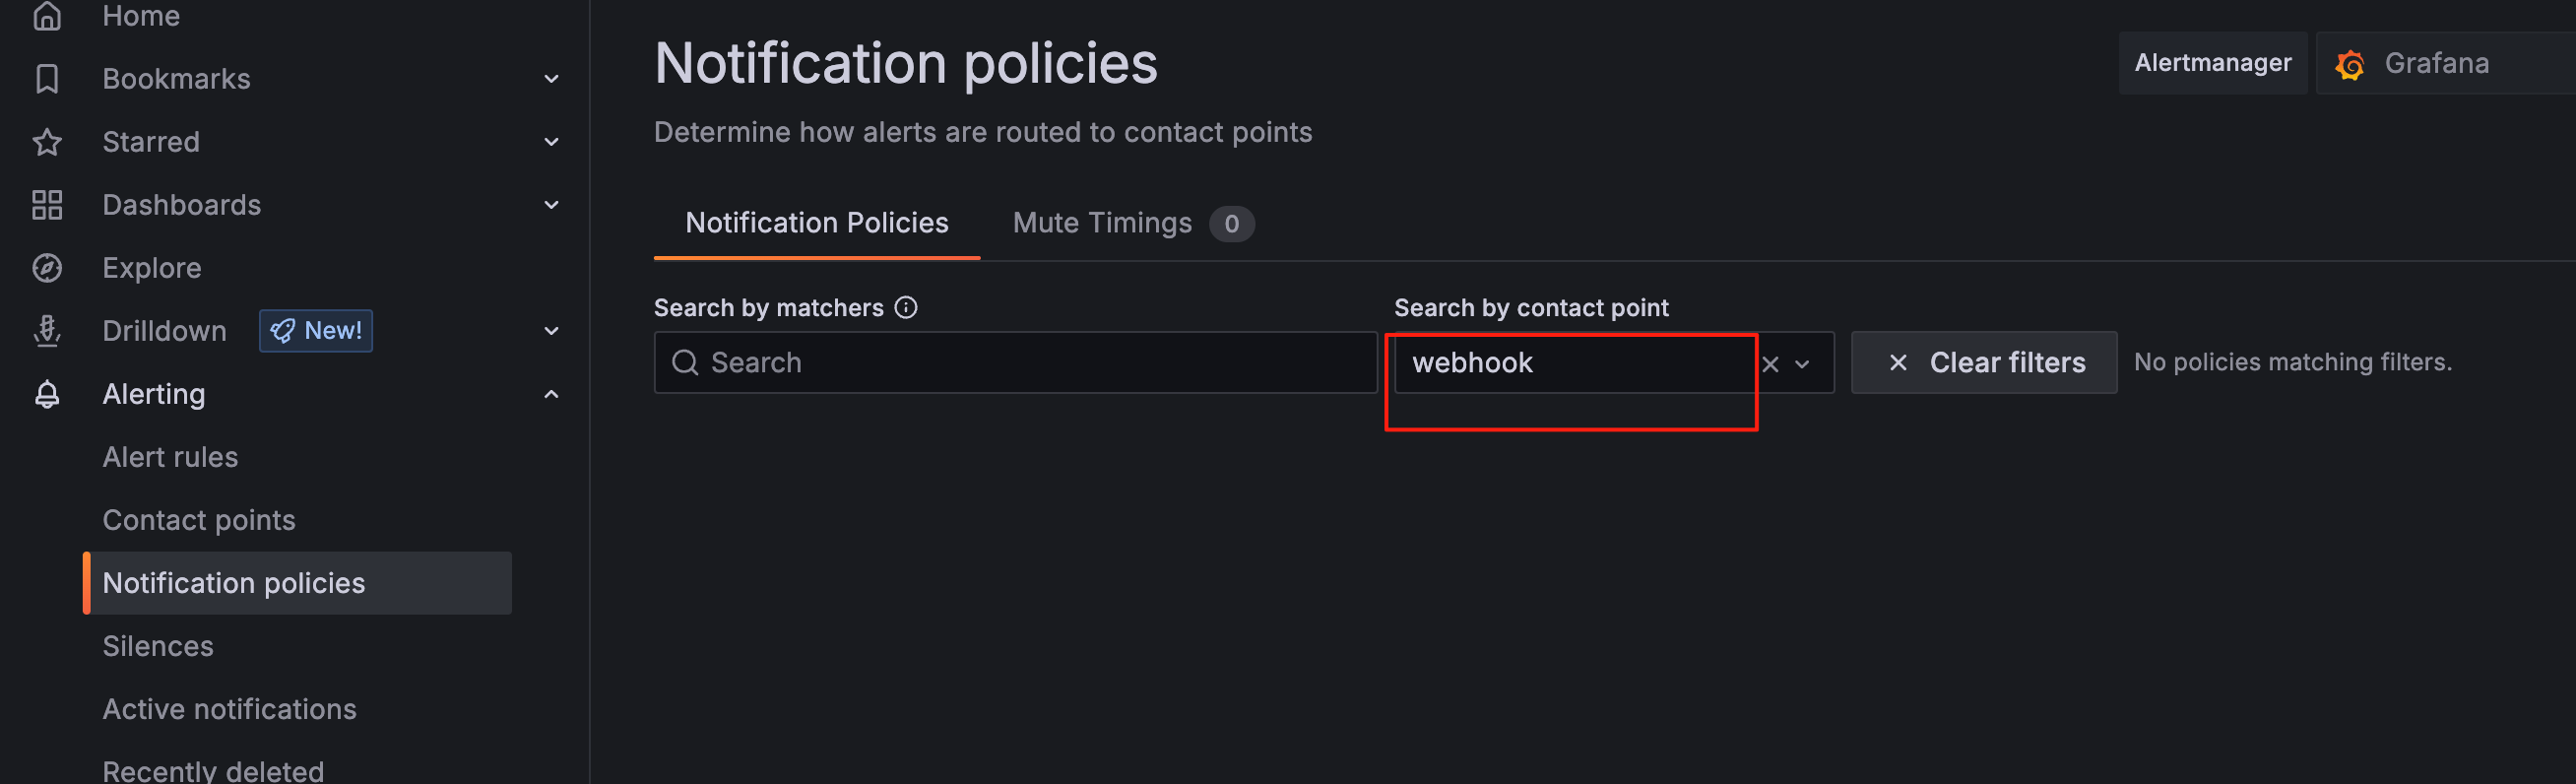
将webhook告警方式配置为默认方式
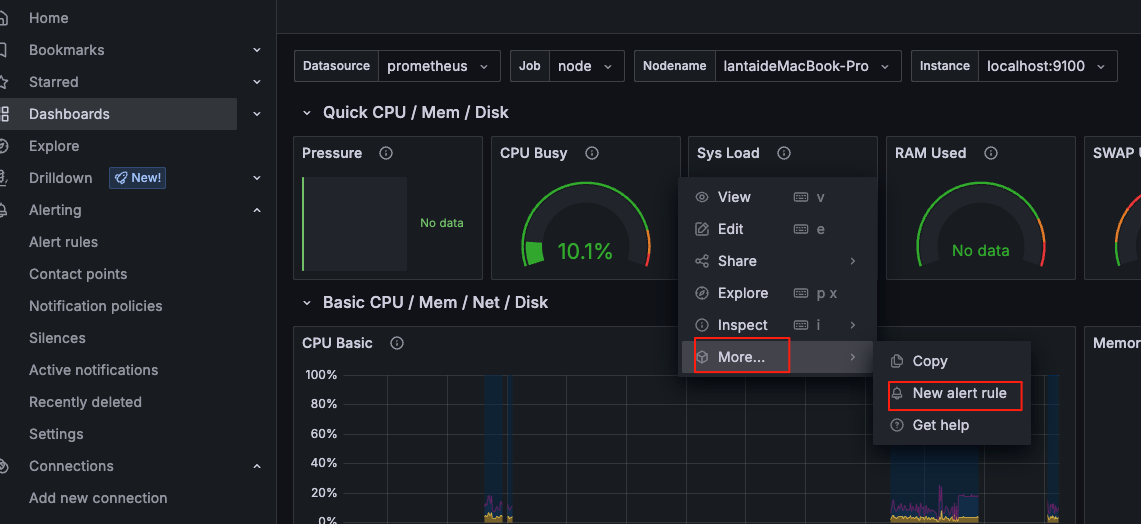
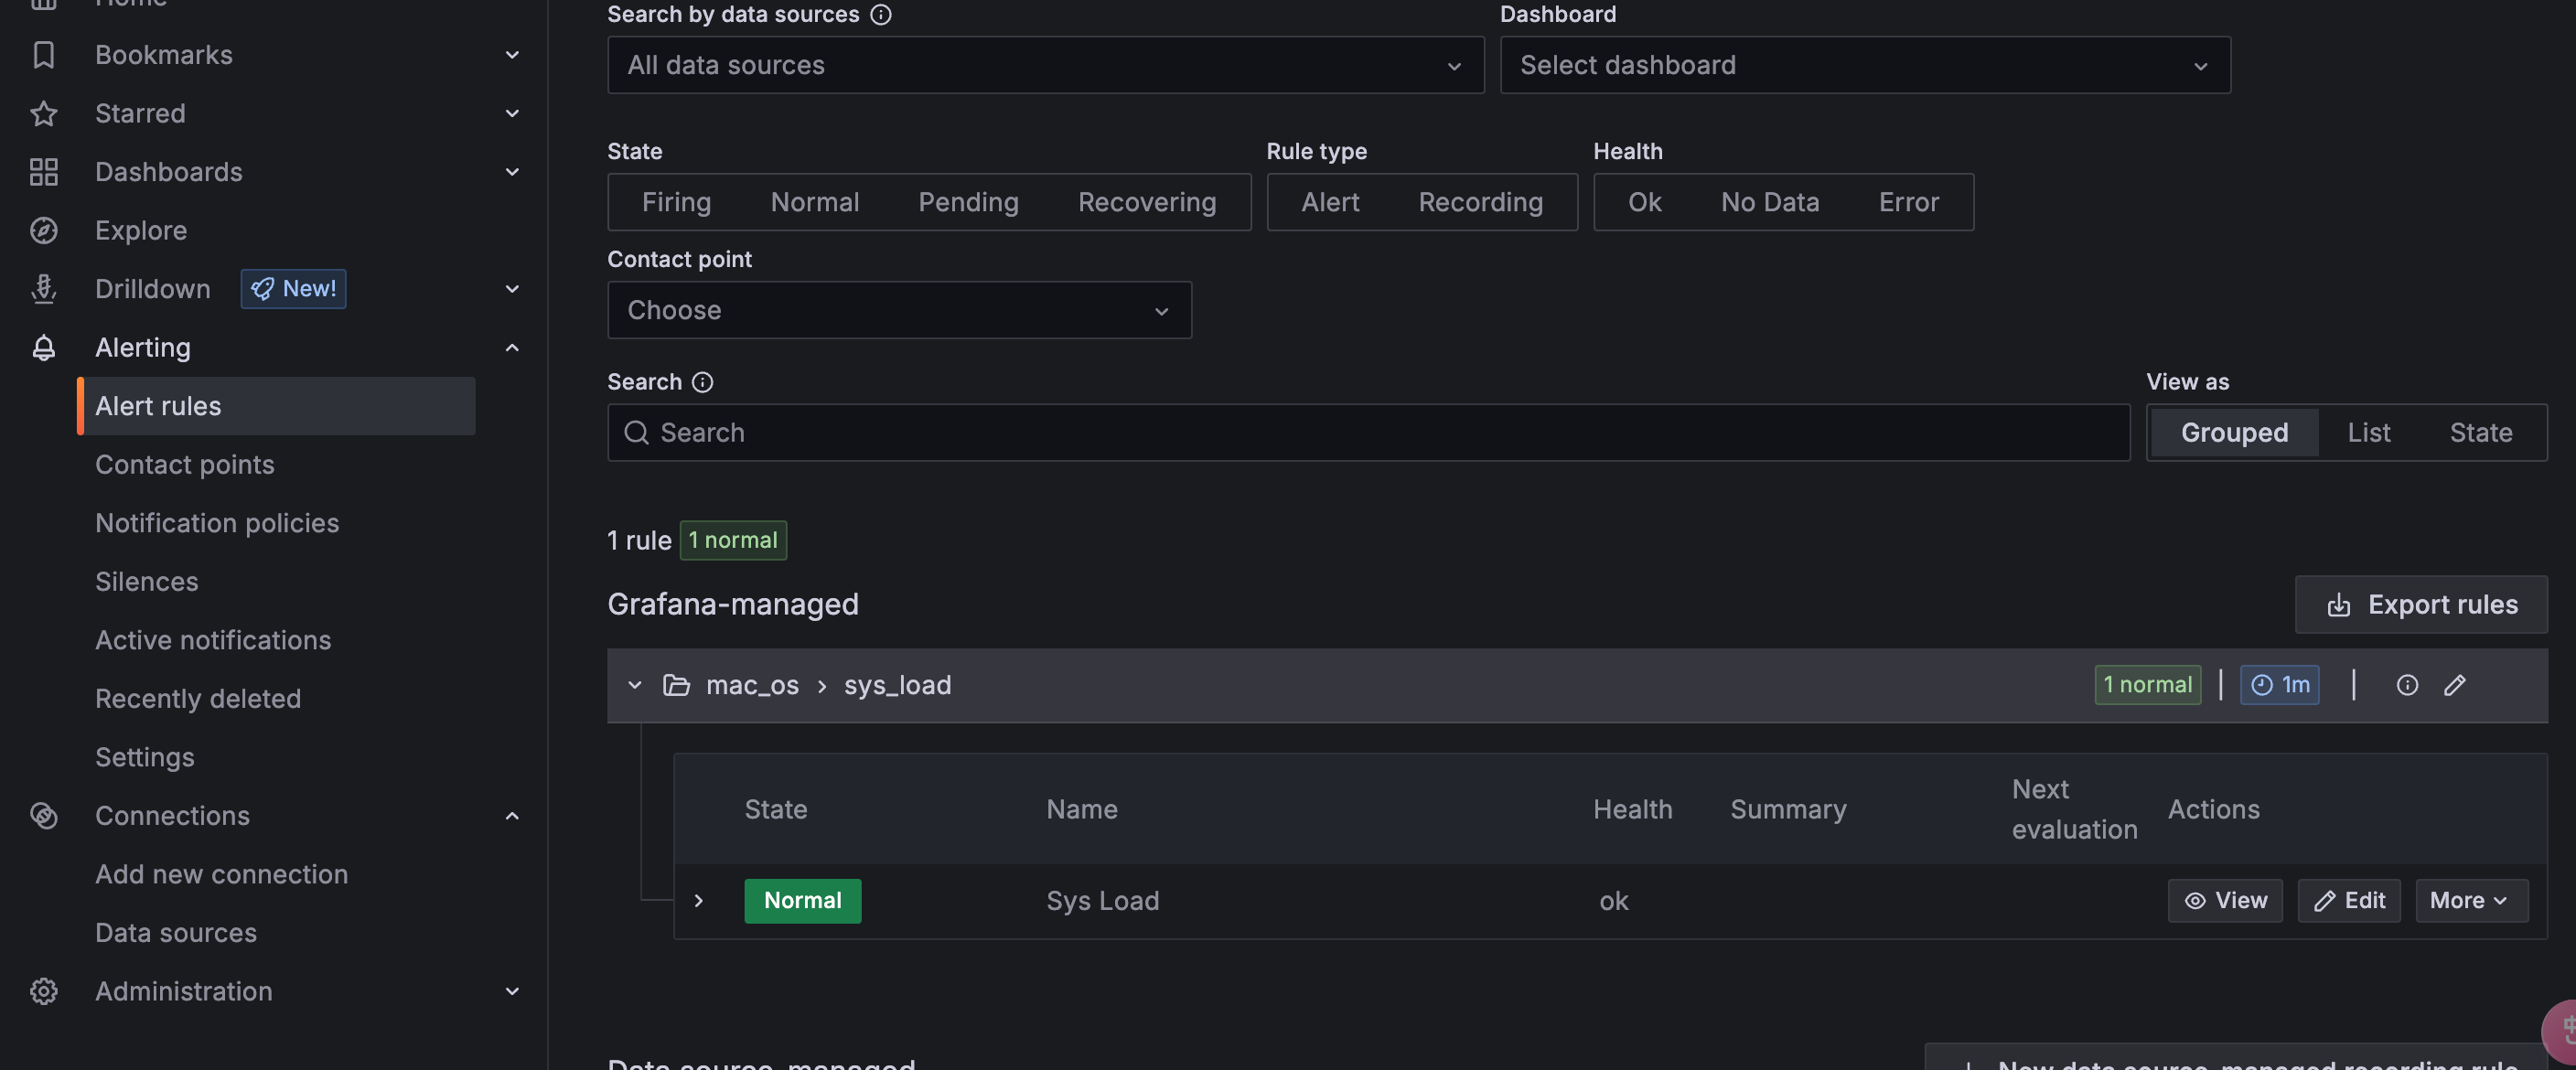
通过仪表盘创建警报规则
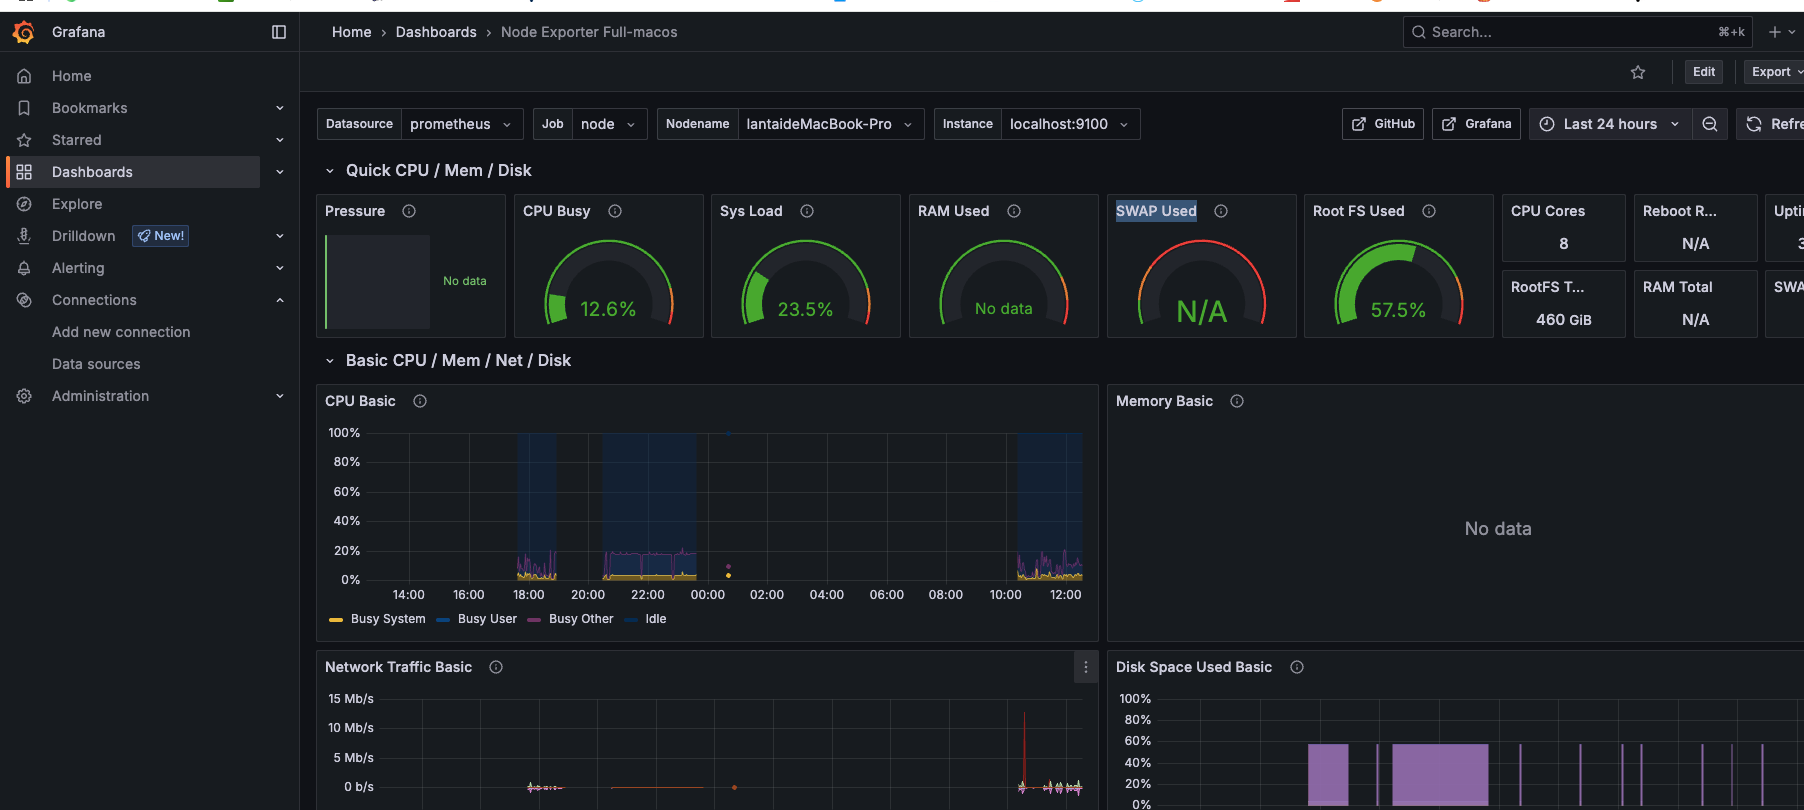
在监控面板中,点击相应监控指标的下拉按钮-->选择More--> New alert rule
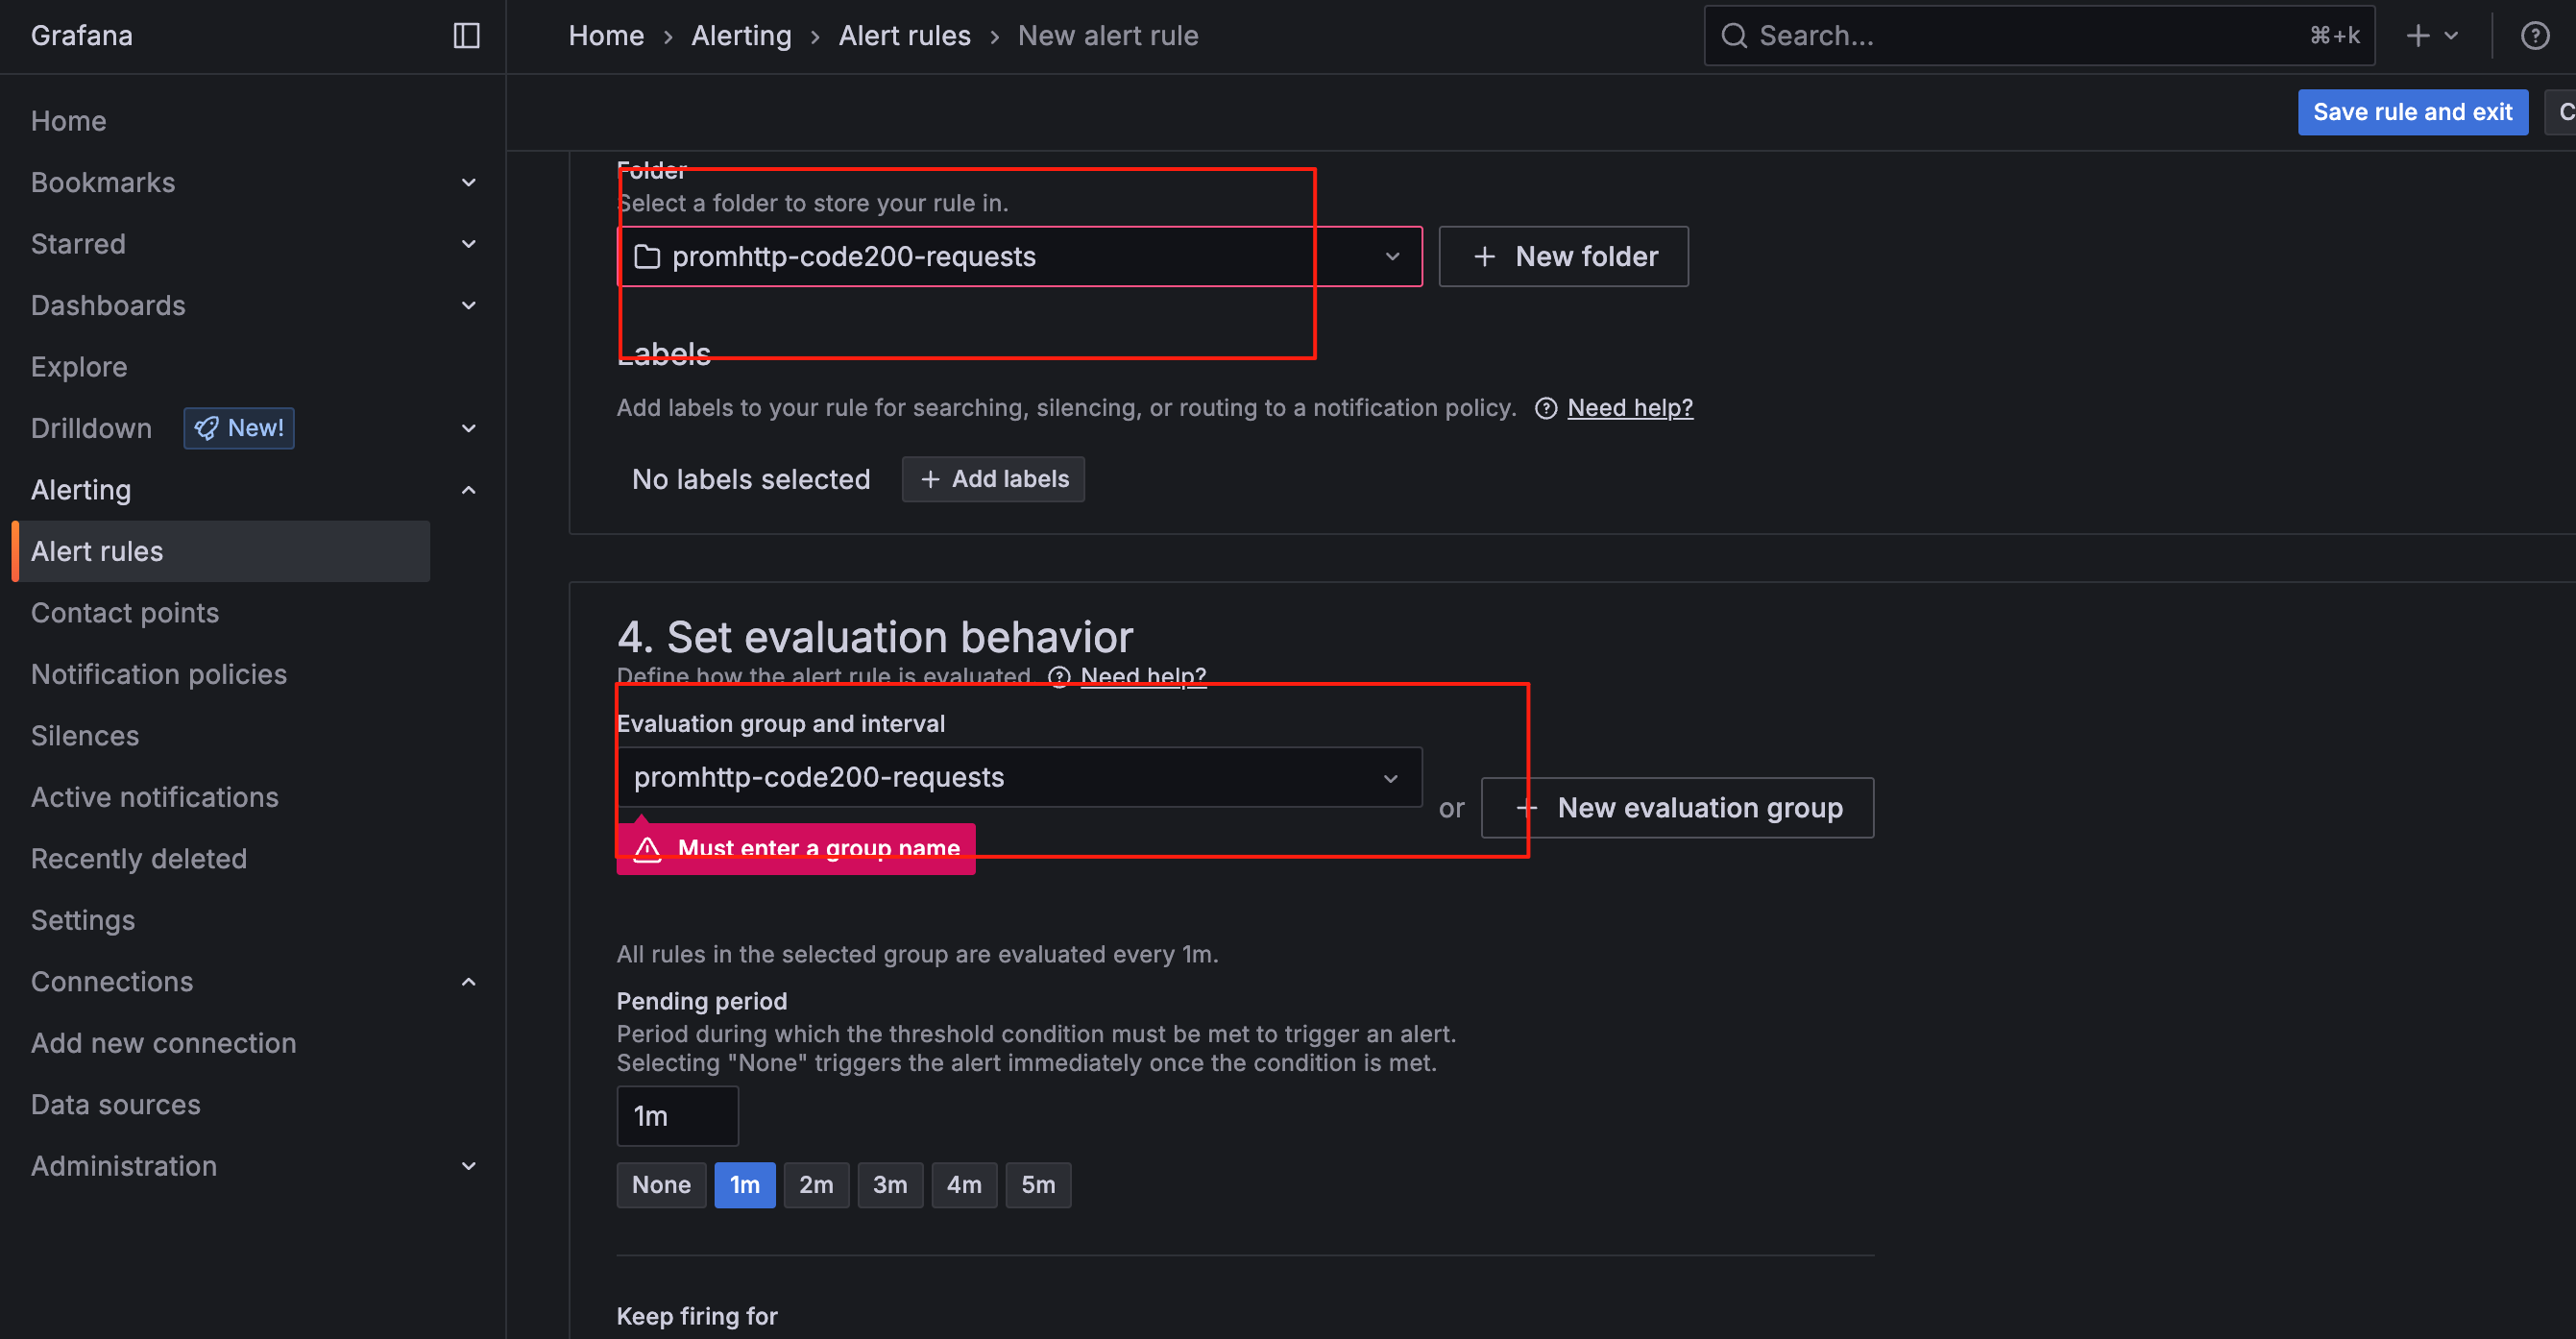
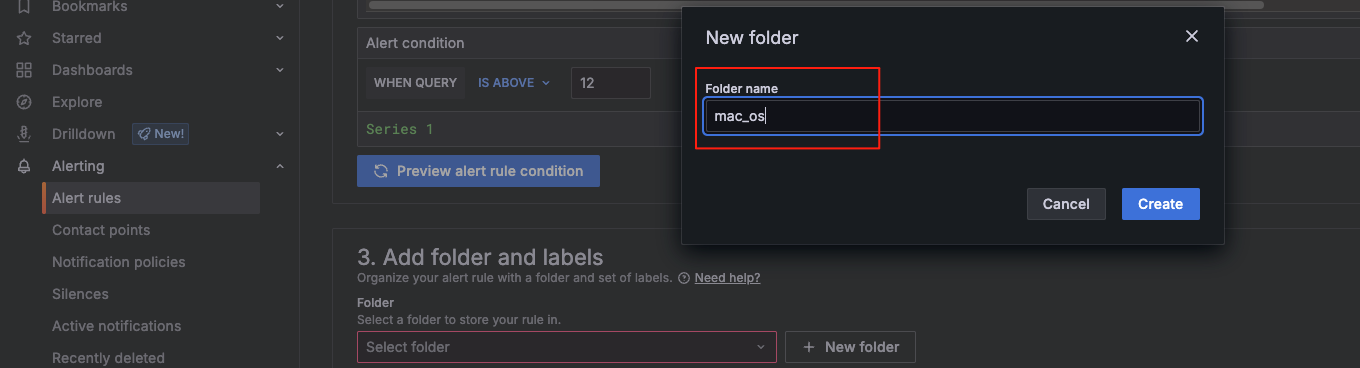
添加一个文件夹标签
使用文件夹标签集整理您的警报规则。
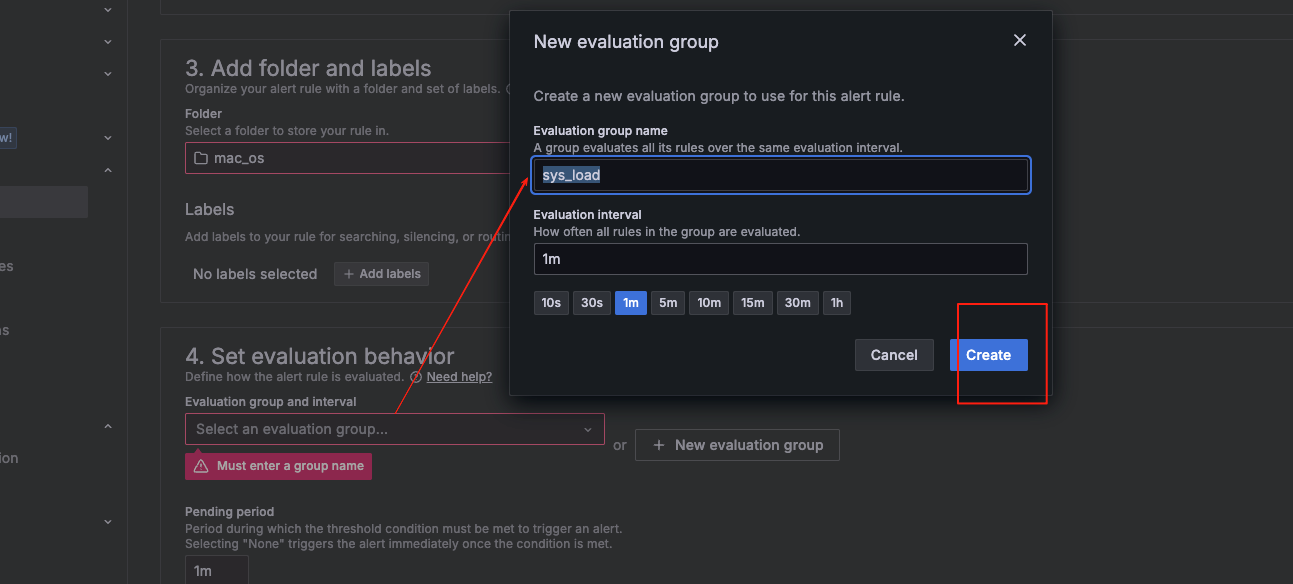
定义评估规则组
评估组是用于评估警报和记录规则的容器。 评估规则组定义了评估间隔,即规则的评估频率。同一评估组内的警报规则将在同一评估间隔内进行评估。
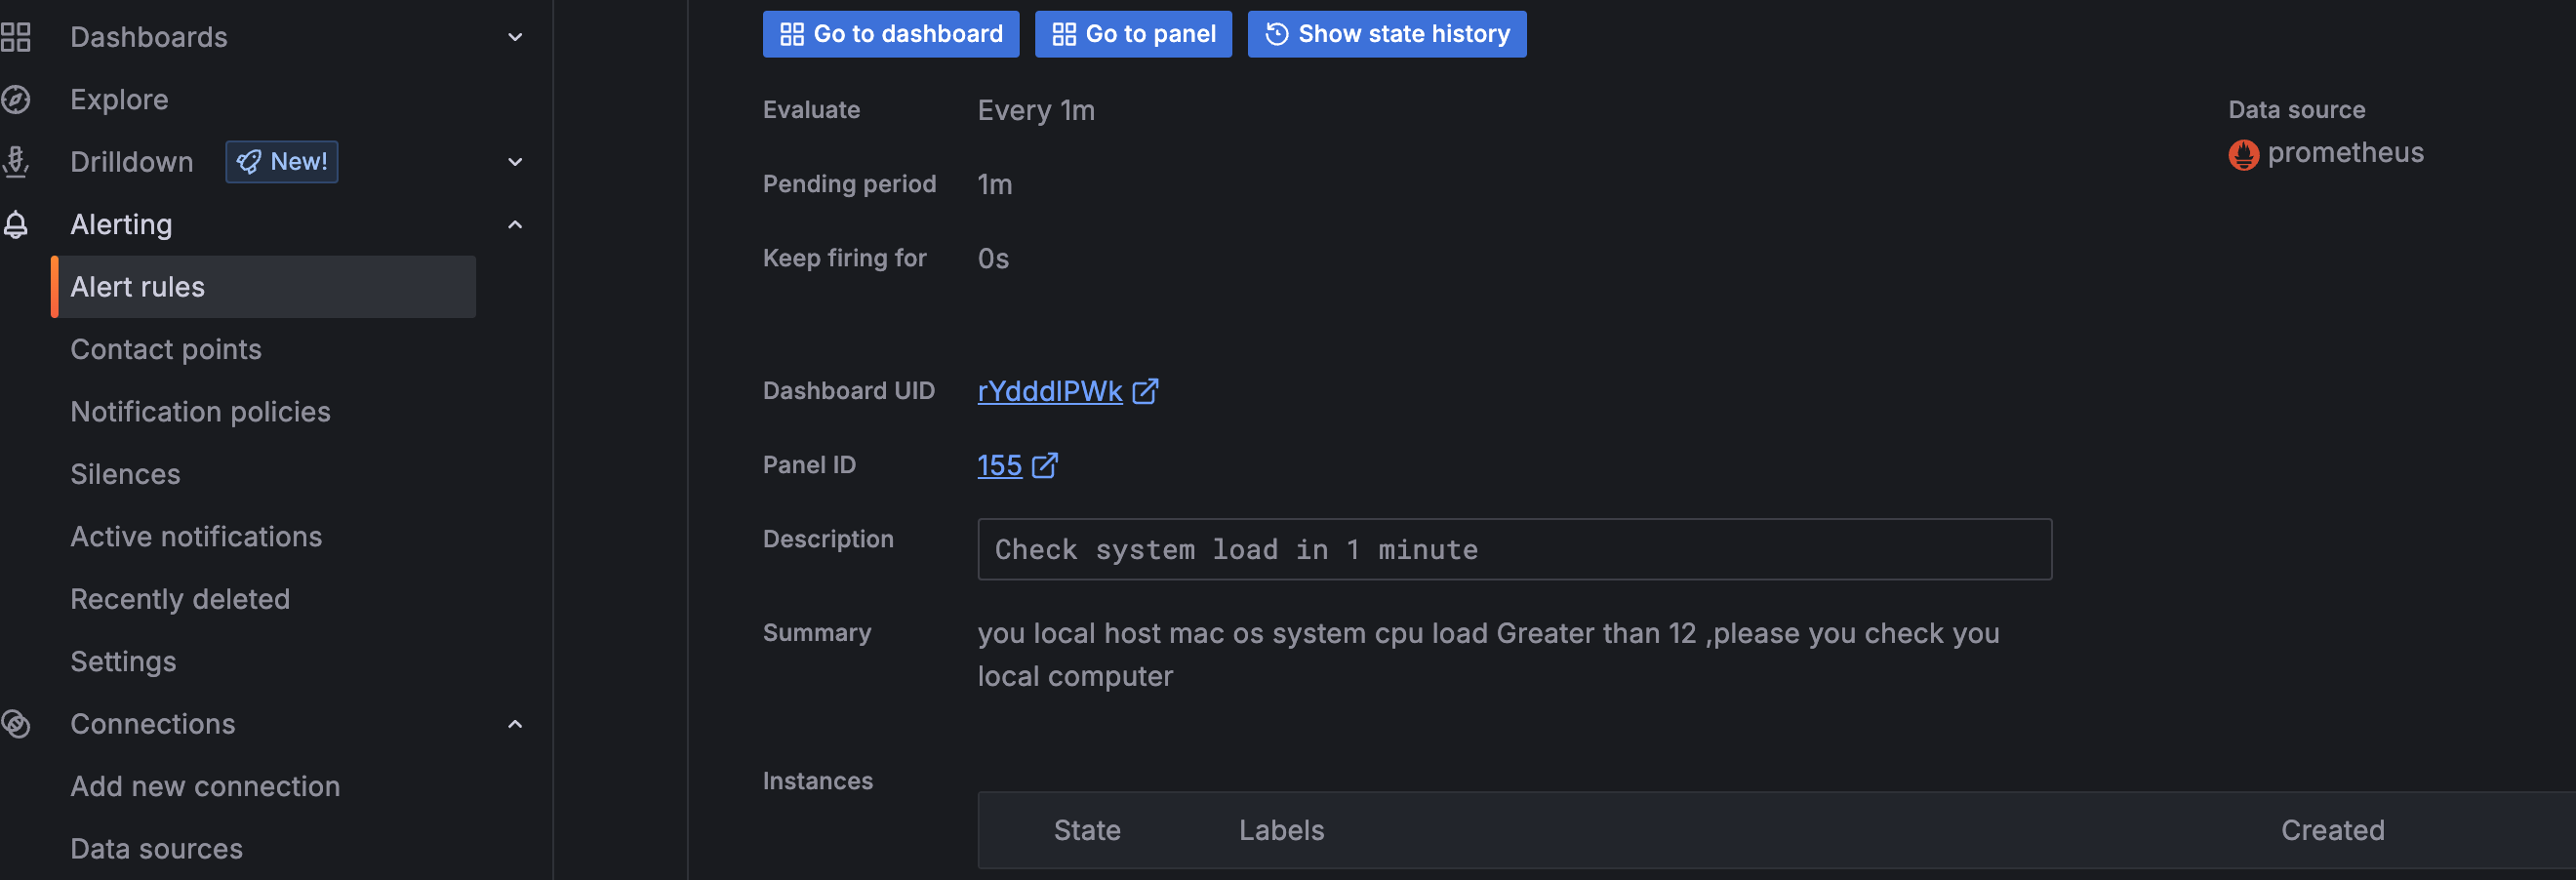
保存规则
等待几分钟,已经检测到负载超过设定值12了
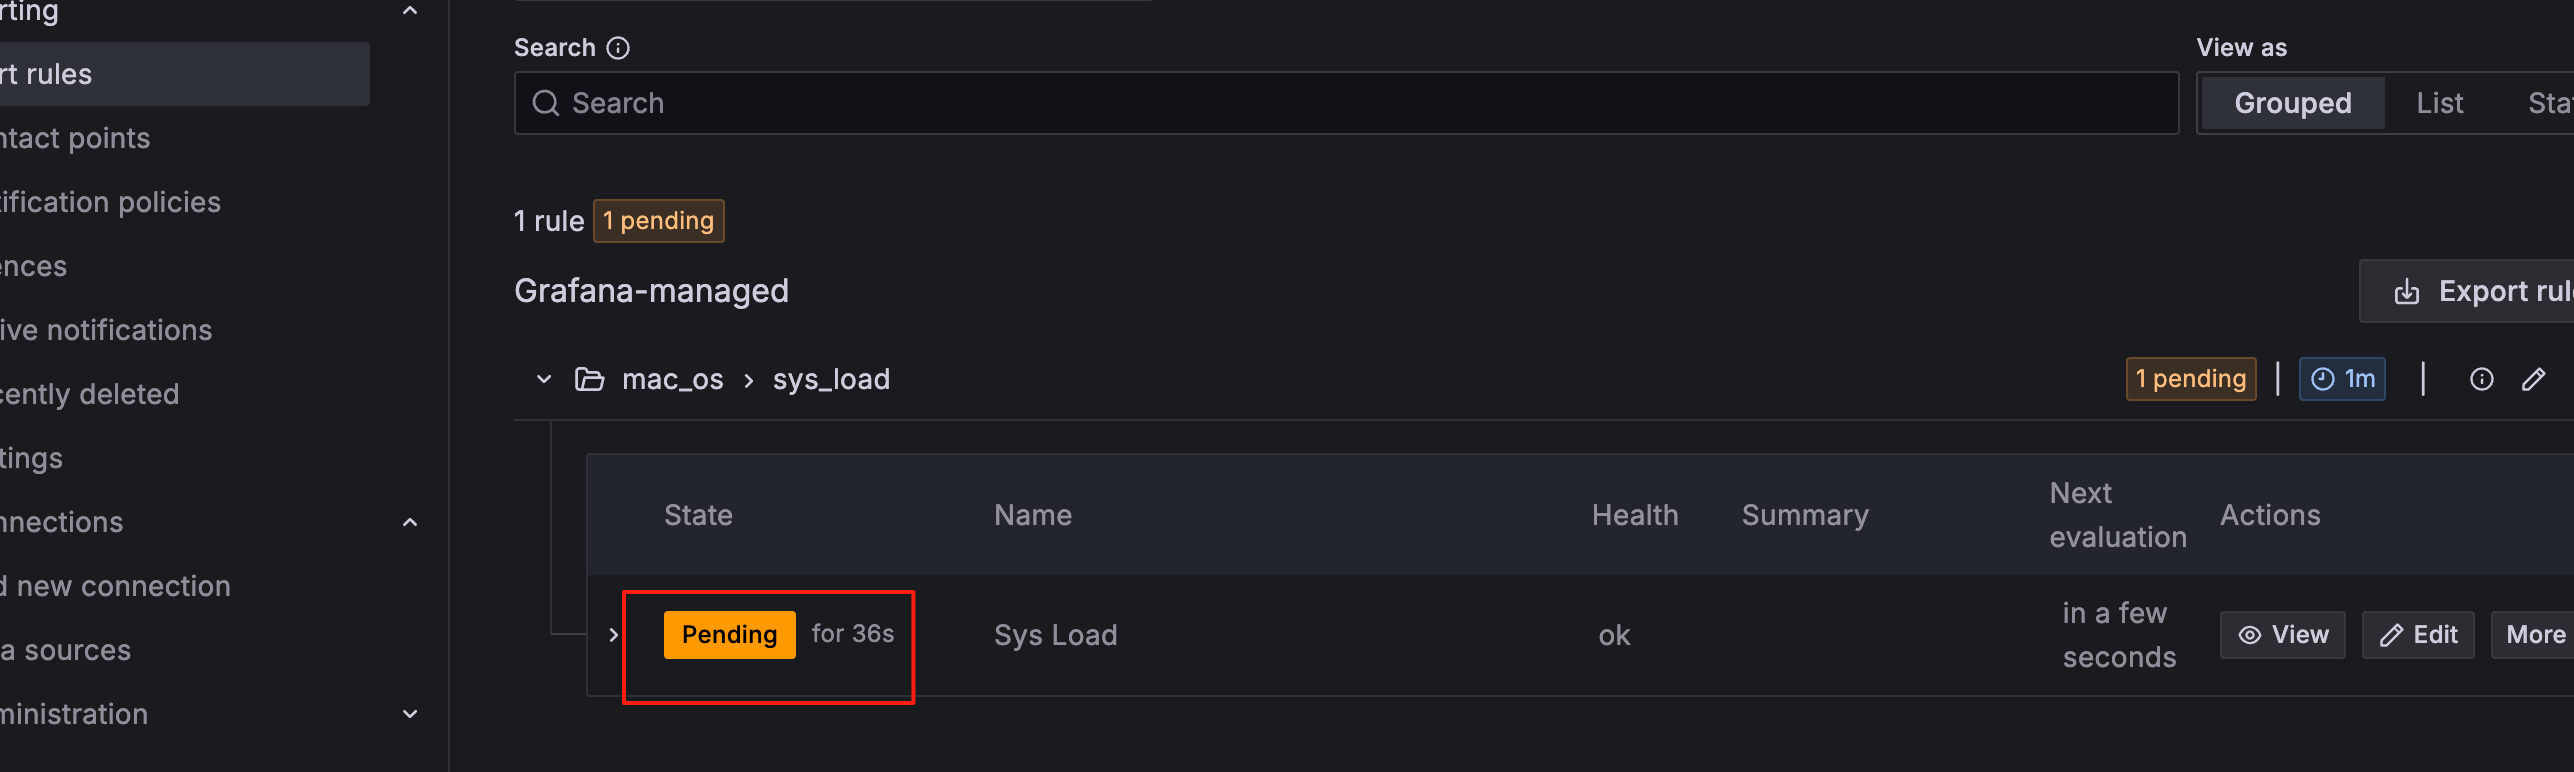
触发了
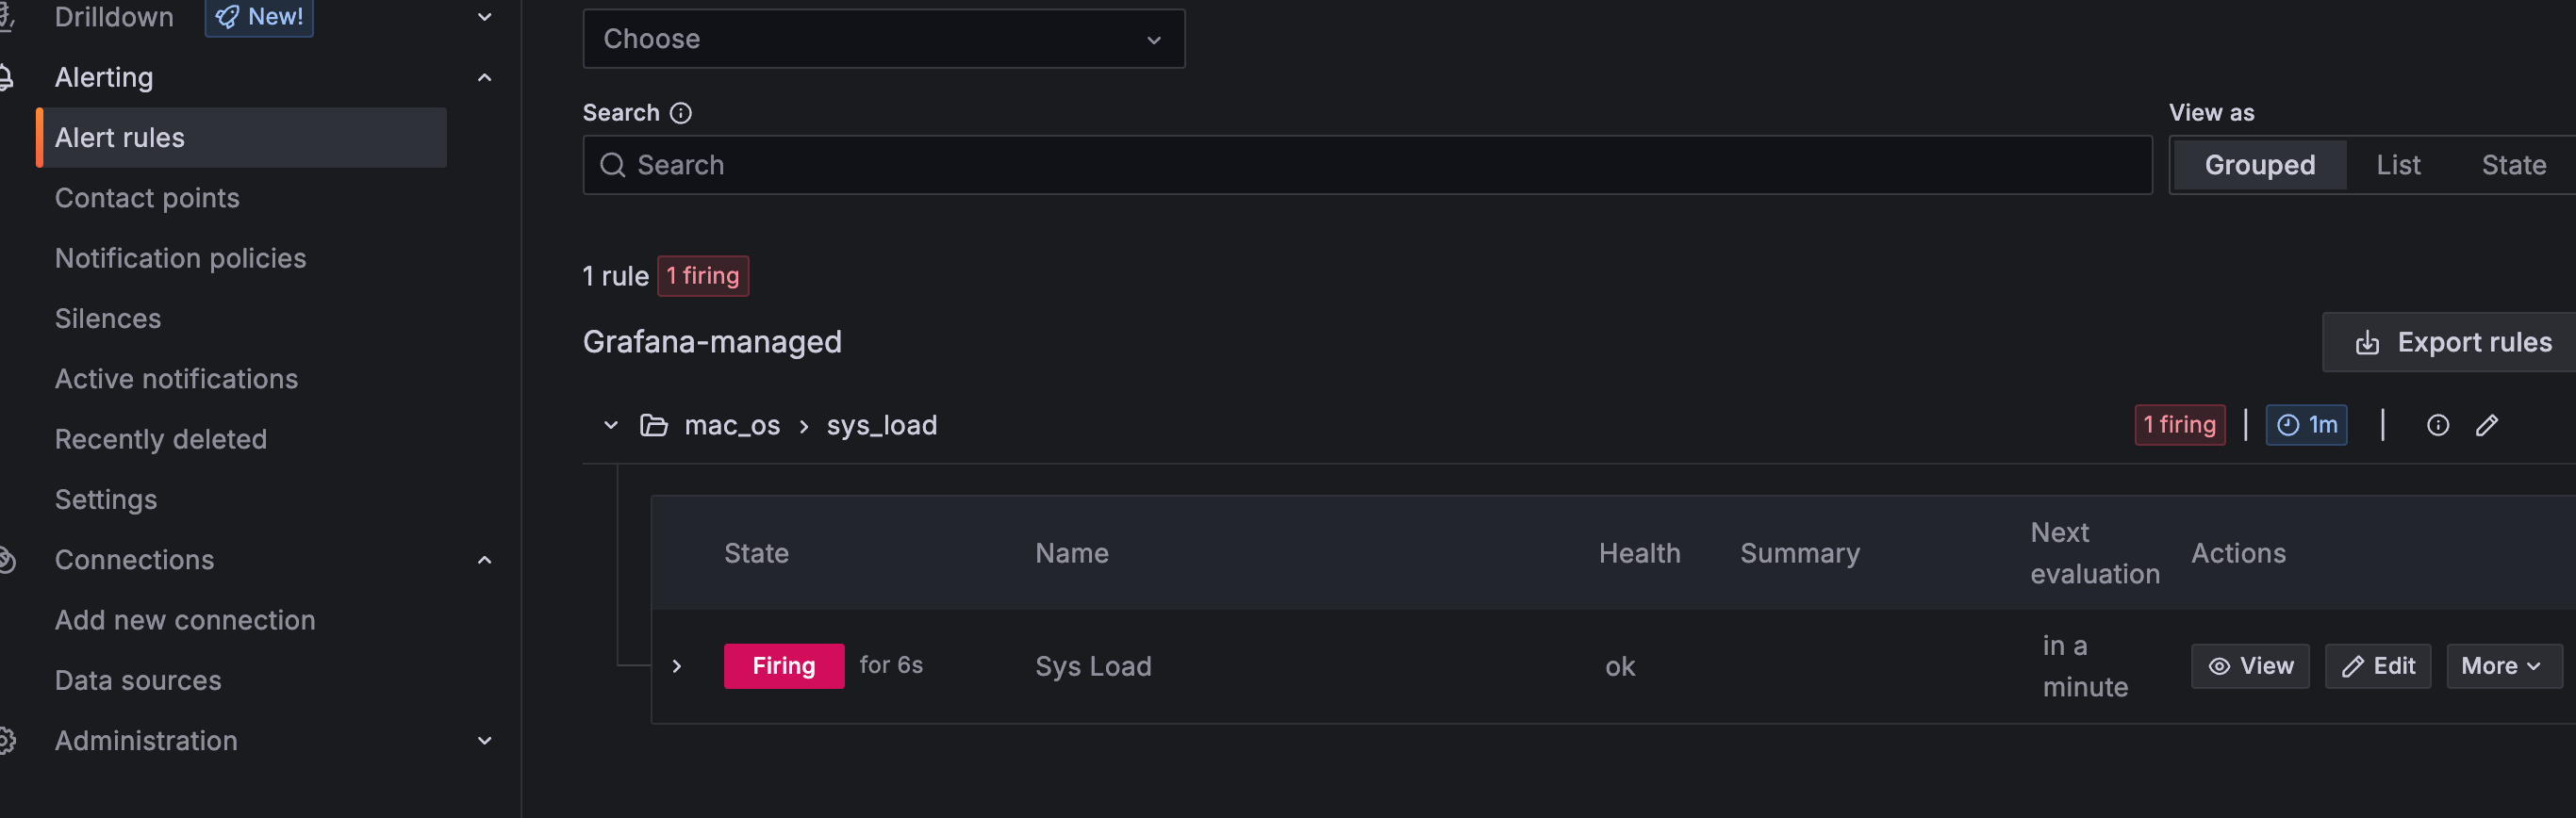
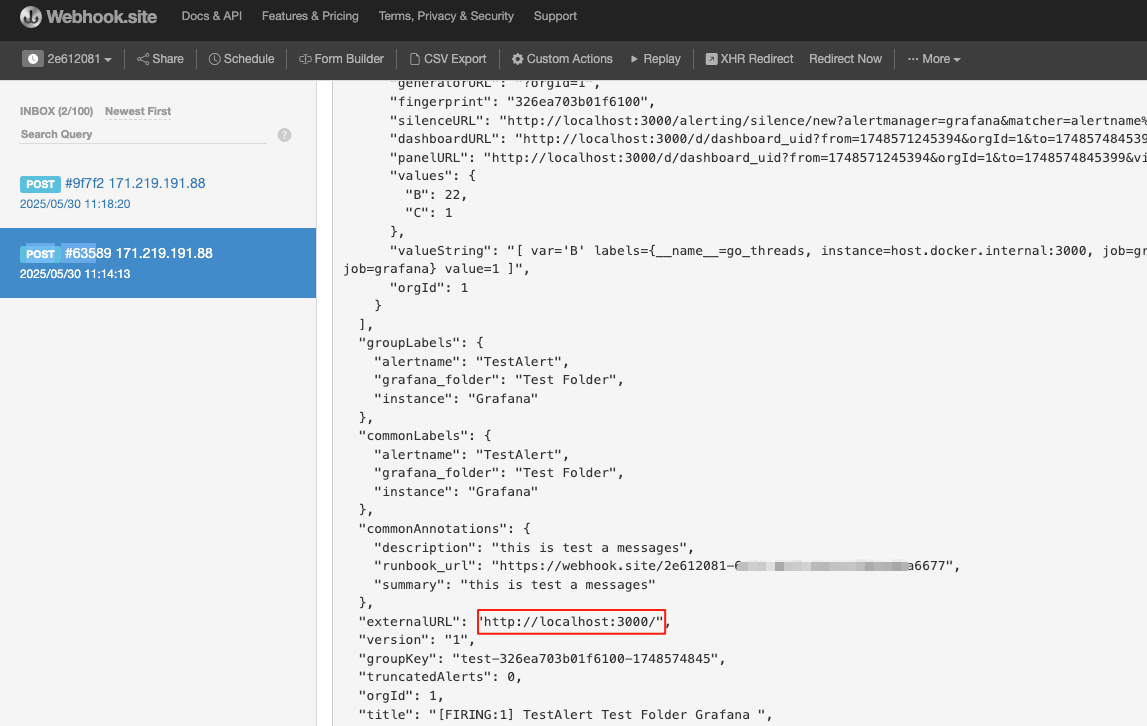
webhook中收到报警信息
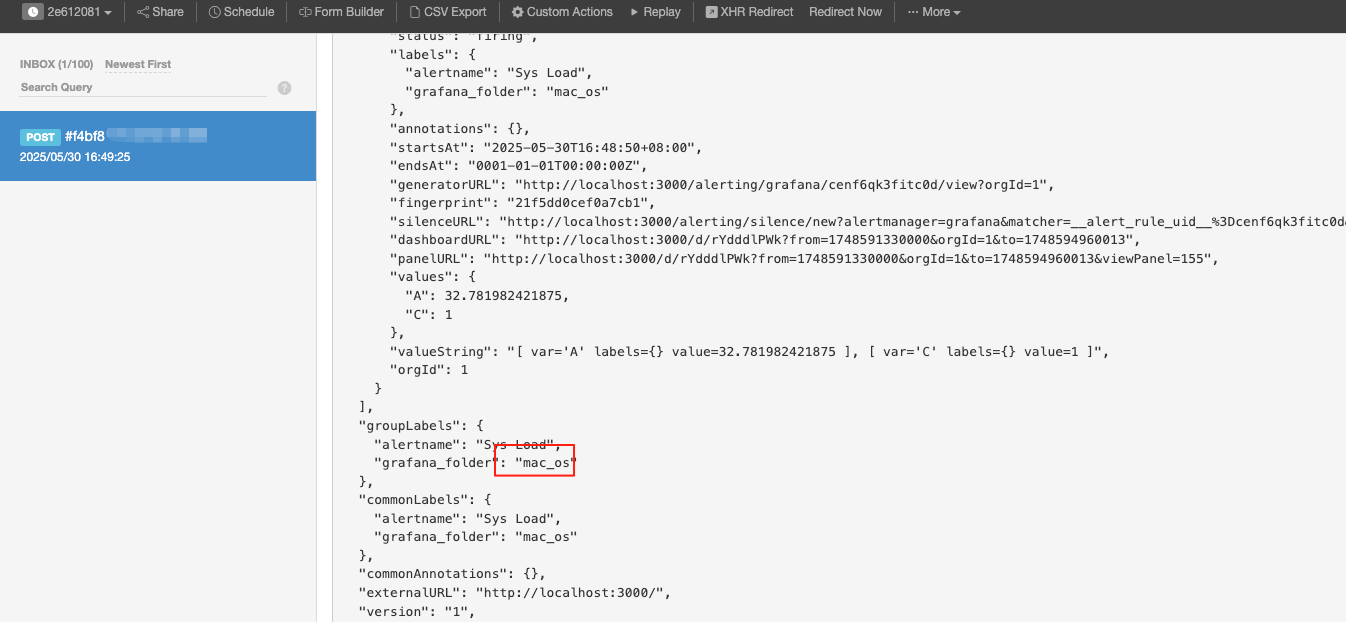
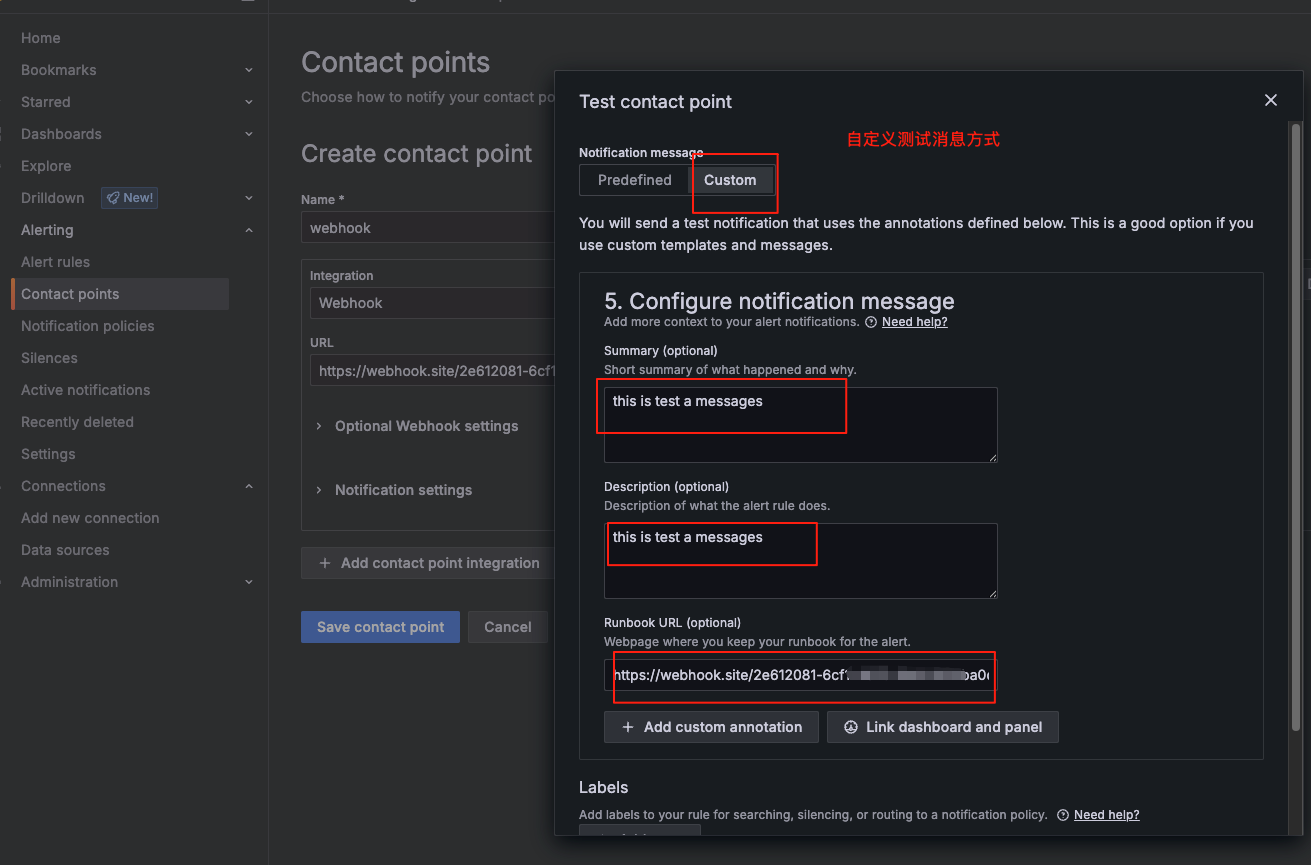
自定义报警信息:
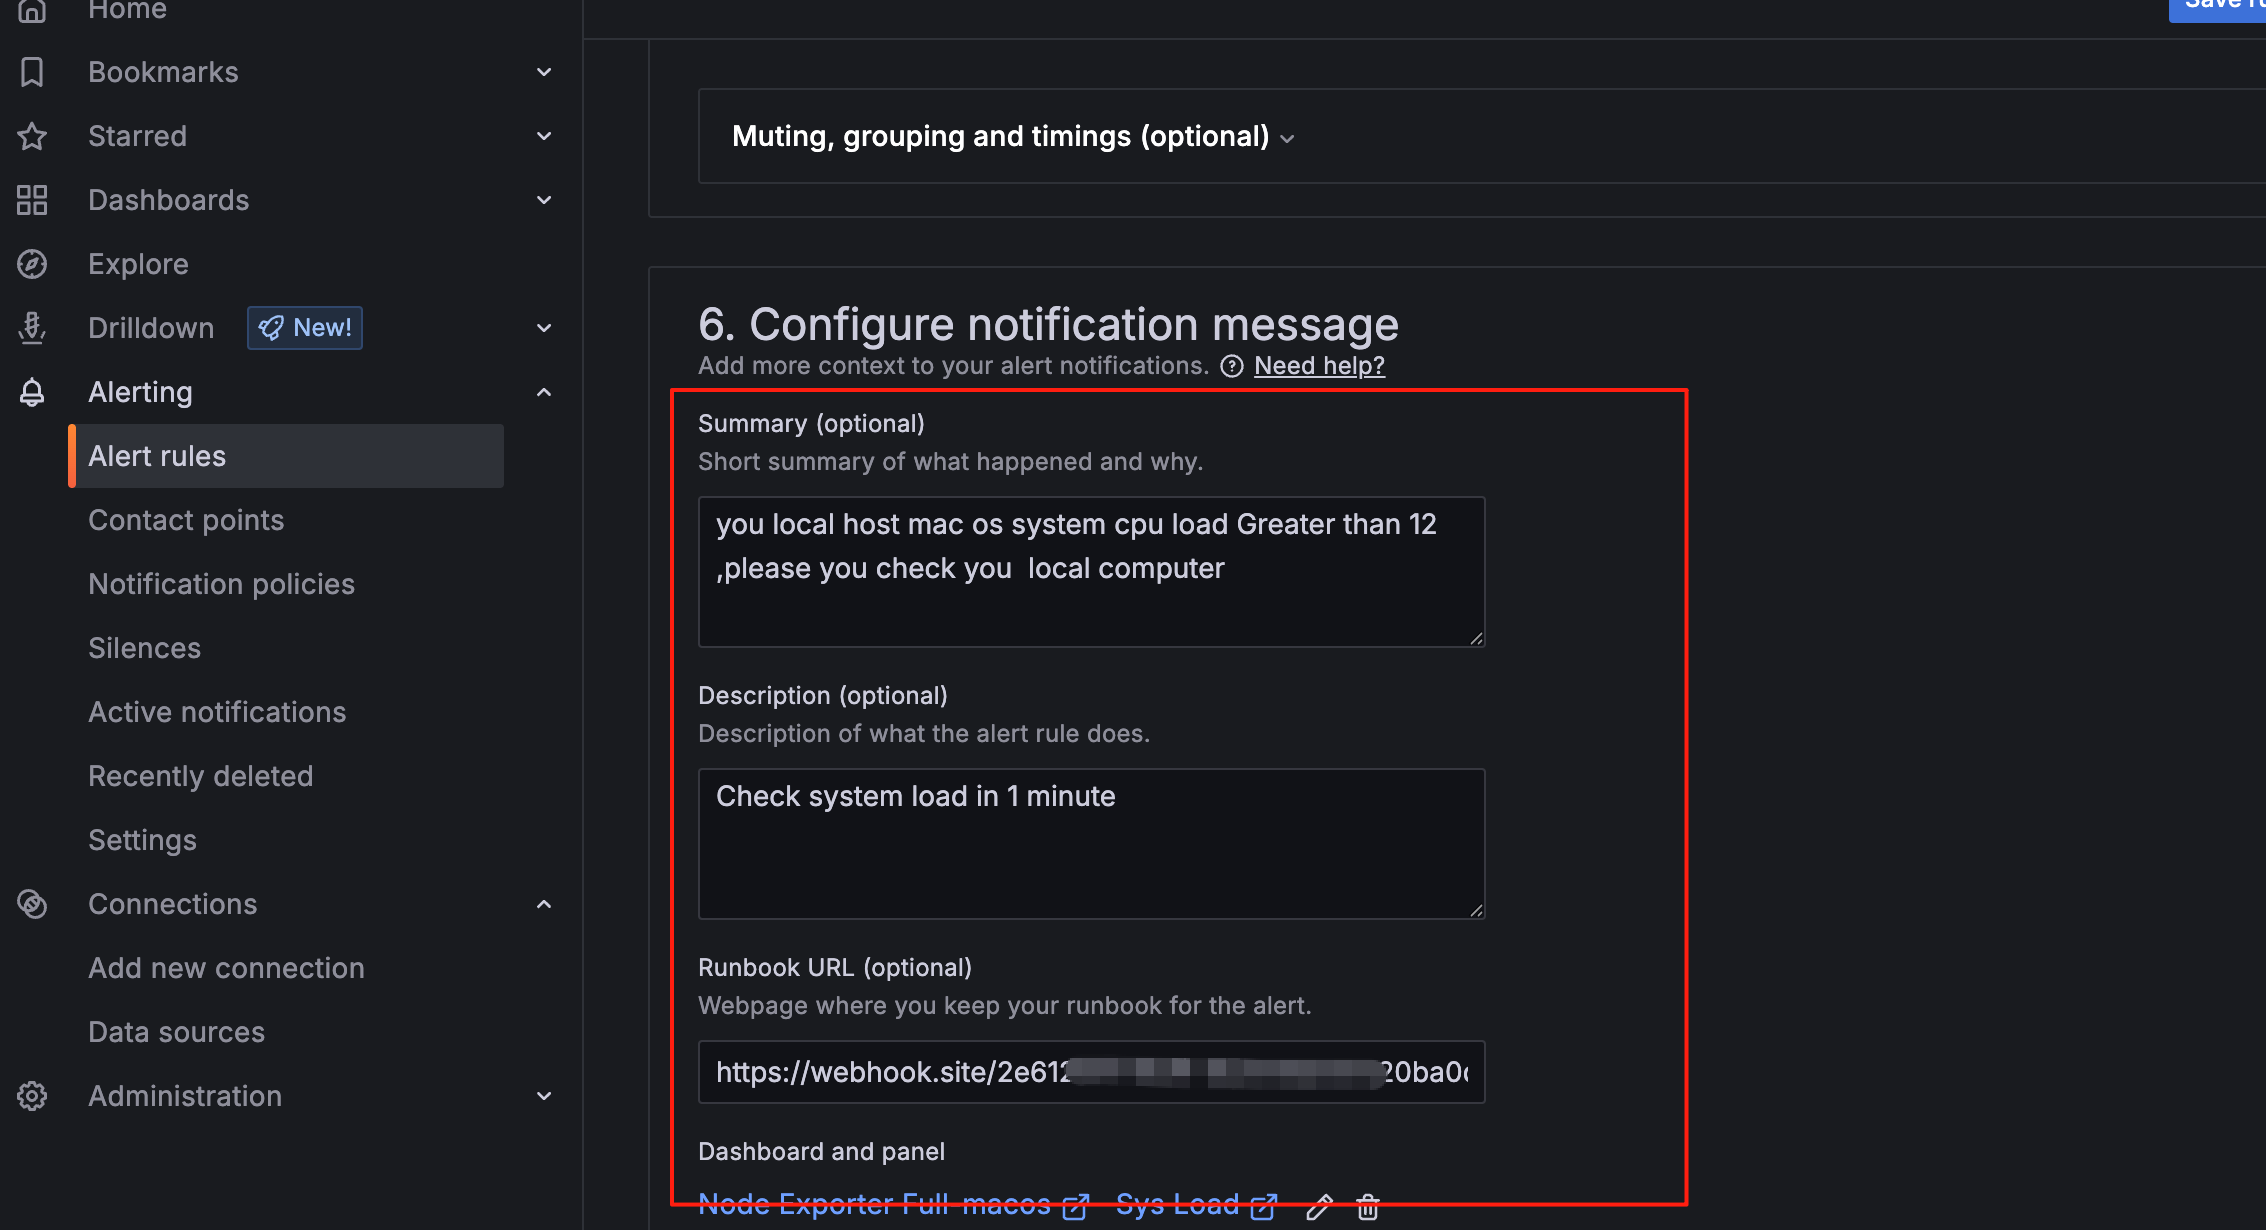
保存后点击报警规则,可查看规则详情