Grafana 环境搭建 ------ 快速部署 Grafana 的基础环境
- 一:集群准备
- [二:安装部署 `Zabbix Server`](#二:安装部署
Zabbix Server) -
- 1)**官网**
- [2)**安装 `Zabbix`**](#2)安装
Zabbix) - [3)安装 `MySQL`](#3)安装
MySQL) - [4)初始化导入 `Zabbix` 表数据](#4)初始化导入
Zabbix表数据) - [5)修改 `zabbix_server.conf` 并启动 `zabbix_server`](#5)修改
zabbix_server.conf并启动zabbix_server) - [6)修改 `PHP` 配置](#6)修改
PHP配置) - [7)修改 `Nginx` 配置](#7)修改
Nginx配置) - [8)连接 `Zabbix Web` 数据库](#8)连接
Zabbix Web数据库) - 9)登录
- [10)配置 `Action`](#10)配置
Action)
- [三:安装部署 `Zabbix Agent`](#三:安装部署
Zabbix Agent) -
- [1)安装 `Zabbix`](#1)安装
Zabbix) - [2)修改 `zabbix_agentd.conf` 并启动 `zabbix_agent`](#2)修改
zabbix_agentd.conf并启动zabbix_agent)
- [1)安装 `Zabbix`](#1)安装
- 总结
🔔 本文是《Grafana 企业级可视化监控实战指南:从安装、配置到智能告警》系列的第二篇!
本系列将带你从零开始,基于 Grafana + Zabbix 构建一套完整的企业级监控与告警系统。
⚠️ 该系列所有涉及的软件包和项目都可以私信博主免费获取
-
第一篇:Grafana 简介 ------ 认识开源数据可视化平台
核心:了解 Grafana 的基本概念、功能,以及如何接入不同数据源进行数据展示。
-
第二篇:Grafana 环境搭建 ------ 快速部署 Grafana 的基础环境
核心:介绍如何在本地或服务器上搭建 Grafana 环境,并配置相关的数据库和依赖。
-
第三篇:Grafana 安装部署 ------ 从零开始安装和配置 Grafana
核心:详解 Grafana 的安装步骤、配置文件的设置、以及服务的启动与管理。
-
第四篇:Grafana 使用 ------ 高效创建仪表盘与数据展示
核心:掌握 Grafana 的高级功能,如插件安装、数据源配置、仪表盘创建等,全面提升数据可视化能力。
🚀 系列最终成果
当你完整学完并实操本系列,你将拥有:
✅ 一套完善的 Grafana 企业级可视化监控体系
✅ 高效的数据展示与分析能力
✅ 完备的告警机制,避免监控盲区
✅ 高颜值、可复用的运维大屏
✅ 企业级项目经验,可写进简历/毕设/项目经验
真正实现:监控数据 → 可视化展示 → 告警系统 → 智能运维
一:集群准备
| 机器 | IP | 角色 |
|---|---|---|
| hadoop102 | 192.168.2.102 | 172.16.1.102 | Zabbix Server + MySQL + Zabbix Web |
| hadoop103 | 192.168.2.103 | 172.16.1.103 | Zabbix Agent |
| hadoop104 | 192.168.2.104 | 172.16.1.104 | Zabbix Agent |
二:安装部署 Zabbix Server
1)官网
Zabbix 是当前主流开源的企业级分布式监控系统。
Zabbix 特点是:安装部署较简单,且默认自带了多种监控告警模板。
也具备较强的仪表盘展示功能;提供API接口,支持脚本调用;支持自定义编写插件以及监控模板。
2)安装 Zabbix
-
获取
Zabbixyum源bash[root@hadoop102 ~]# rpm -Uvh https://repo.zabbix.com/zabbix/4.4/rhel/7/x86_64/zabbix-release-4.4-1.el7.noarch.rpm -
安装
epel源,用于支持Nginxbash[root@hadoop102 ~]# yum install -y epel-release -
安装
Zabbix相关软件包bash# 1. 上传软件包 [root@hadoop102 software]# rz # 2. 安装软件包 [root@hadoop102 software]# yum localinstall zabbix-*.rpm # 3. 查看 [root@hadoop102 software]# rpm -qa | grep zabbix zabbix-get-4.4.10-1.el7.x86_64 zabbix-web-4.4.10-1.el7.noarch zabbix-server-mysql-4.4.10-1.el7.x86_64 zabbix-web-mysql-4.4.10-1.el7.noarch zabbix-agent-4.4.10-1.el7.x86_64 zabbix-sender-4.4.10-1.el7.x86_64 zabbix-nginx-conf-4.4.10-1.el7.noarch
3)安装 MySQL
-
安装
mariadbbash# 1. 删除系统自带的mariadb [root@hadoop102 ~]# rpm -qa | grep mariadb | xargs rpm -e --nodeps # 2. 上传软件包 [root@hadoop102 software]# rz # 2. 安装软件包 [root@hadoop102 software]# yum localinstall mariadb-*.rpm # 4. 查看 [root@hadoop102 software]# rpm -qa | grep mariadb mariadb-embedded-5.5.68-1.el7.x86_64 mariadb-embedded-devel-5.5.68-1.el7.x86_64 mariadb-server-5.5.68-1.el7.x86_64 mariadb-test-5.5.68-1.el7.x86_64 mariadb-5.5.68-1.el7.x86_64 mariadb-bench-5.5.68-1.el7.x86_64 mariadb-devel-5.5.68-1.el7.x86_64 mariadb-libs-5.5.68-1.el7.x86_64 -
启动
mariadbbash[root@hadoop102 software]# systemctl start mariadb.service [root@hadoop102 software]# systemctl enable mariadb.service
4)初始化导入 Zabbix 表数据
-
创建
Zabbix数据库bash[root@hadoop102 ~]# mysql -uroot Welcome to the MariaDB monitor. Commands end with ; or \g. Your MariaDB connection id is 4 Server version: 5.5.68-MariaDB MariaDB Server Copyright (c) 2000, 2018, Oracle, MariaDB Corporation Ab and others. Type 'help;' or '\h' for help. Type '\c' to clear the current input statement. MariaDB [(none)]> create database zabbix character set utf8 collate utf8_bin; Query OK, 1 row affected (0.00 sec) MariaDB [(none)]> GRANT ALL PRIVILEGES ON zabbix.* TO 'zabbix'@'192.168.2.102' IDENTIFIED BY '123456'; Query OK, 0 rows affected (0.00 sec) MariaDB [(none)]> GRANT ALL PRIVILEGES ON zabbix.* TO 'zabbix'@'localhost' IDENTIFIED BY '123456'; Query OK, 0 rows affected (0.00 sec) MariaDB [(none)]> FLUSH PRIVILEGES; Query OK, 0 rows affected (0.00 sec) MariaDB [(none)]> exit; Bye -
导入
Zabbix建表语句把 Zabbix 官方提供的数据库初始化脚本解压后,直接导入到 MySQL 的
zabbix数据库中。bash[root@hadoop102 ~]# zcat /usr/share/doc/zabbix-server-mysql-4.4.10/create.sql.gz | mysql -u'zabbix' -p'123456' zabbix -
查看
bash[root@hadoop102 ~]# mysql -u'zabbix' -p'123456' Welcome to the MariaDB monitor. Commands end with ; or \g. Your MariaDB connection id is 11 Server version: 5.5.68-MariaDB MariaDB Server Copyright (c) 2000, 2018, Oracle, MariaDB Corporation Ab and others. Type 'help;' or '\h' for help. Type '\c' to clear the current input statement. MariaDB [(none)]> use zabbix; Reading table information for completion of table and column names You can turn off this feature to get a quicker startup with -A Database changed MariaDB [zabbix]> show tables; +----------------------------+ | Tables_in_zabbix | +----------------------------+ | acknowledges | | actions | | alerts | | application_discovery | | application_prototype | | application_template | | applications | | auditlog | | auditlog_details | | autoreg_host | | conditions | | config | | config_autoreg_tls | | corr_condition | | corr_condition_group | | corr_condition_tag | | corr_condition_tagpair | | corr_condition_tagvalue | | corr_operation | | correlation | | dashboard | | dashboard_user | | dashboard_usrgrp | | dbversion | | dchecks | | dhosts | | drules | | dservices | | escalations | | event_recovery | | event_suppress | | event_tag | | events | | expressions | | functions | | globalmacro | | globalvars | | graph_discovery | | graph_theme | | graphs | | graphs_items | | group_discovery | | group_prototype | | history | | history_log | | history_str | | history_text | | history_uint | | host_discovery | | host_inventory | | host_tag | | hostmacro | | hosts | | hosts_groups | | hosts_templates | | housekeeper | | hstgrp | | httpstep | | httpstep_field | | httpstepitem | | httptest | | httptest_field | | httptestitem | | icon_map | | icon_mapping | | ids | | images | | interface | | interface_discovery | | item_application_prototype | | item_condition | | item_discovery | | item_preproc | | item_rtdata | | items | | items_applications | | lld_macro_path | | maintenance_tag | | maintenances | | maintenances_groups | | maintenances_hosts | | maintenances_windows | | mappings | | media | | media_type | | media_type_param | | opcommand | | opcommand_grp | | opcommand_hst | | opconditions | | operations | | opgroup | | opinventory | | opmessage | | opmessage_grp | | opmessage_usr | | optemplate | | problem | | problem_tag | | profiles | | proxy_autoreg_host | | proxy_dhistory | | proxy_history | | regexps | | rights | | screen_user | | screen_usrgrp | | screens | | screens_items | | scripts | | service_alarms | | services | | services_links | | services_times | | sessions | | slides | | slideshow_user | | slideshow_usrgrp | | slideshows | | sysmap_element_trigger | | sysmap_element_url | | sysmap_shape | | sysmap_url | | sysmap_user | | sysmap_usrgrp | | sysmaps | | sysmaps_elements | | sysmaps_link_triggers | | sysmaps_links | | tag_filter | | task | | task_acknowledge | | task_check_now | | task_close_problem | | task_remote_command | | task_remote_command_result | | timeperiods | | trends | | trends_uint | | trigger_depends | | trigger_discovery | | trigger_tag | | triggers | | users | | users_groups | | usrgrp | | valuemaps | | widget | | widget_field | +----------------------------+ 149 rows in set (0.00 sec)
5)修改 zabbix_server.conf 并启动 zabbix_server
-
修改
zabbix_server.conf配置文件bash[root@hadoop102 ~]# vim /etc/zabbix/zabbix_server.conf DBHost=192.168.2.102 DBName=zabbix DBUser=zabbix DBPassword=123456 -
启动
zabbix-serverbash[root@hadoop102 ~]# systemctl start zabbix-server.service [root@hadoop102 ~]# systemctl enable zabbix-server.service
6)修改 PHP 配置
bash
# 1. 修改配置文件
[root@hadoop102 ~]# vim /etc/php-fpm.d/zabbix.conf
php_value[date.timezone] = Asia/Shanghai

# 2. 启动 php-fpm
[root@hadoop102 ~]# systemctl start php-fpm.service
[root@hadoop102 ~]# systemctl enable php-fpm.service
7)修改 Nginx 配置
bash
# 1. 修改配置文件
[root@hadoop102 ~]# vim /etc/nginx/conf.d/zabbix.conf
server {
        listen          8080;
        server_name     zabbix.cn;
...

# 2. 启动 Nginx
[root@hadoop102 ~]# systemctl start nginx
[root@hadoop102 ~]# systemctl enable nginx

# 3. 修改 Windows 的 hosts 文件
192.168.2.102 zabbix.cn
8)连接 Zabbix Web 数据库
-
浏览器访问
http://zabbix.cn:8080/setup.php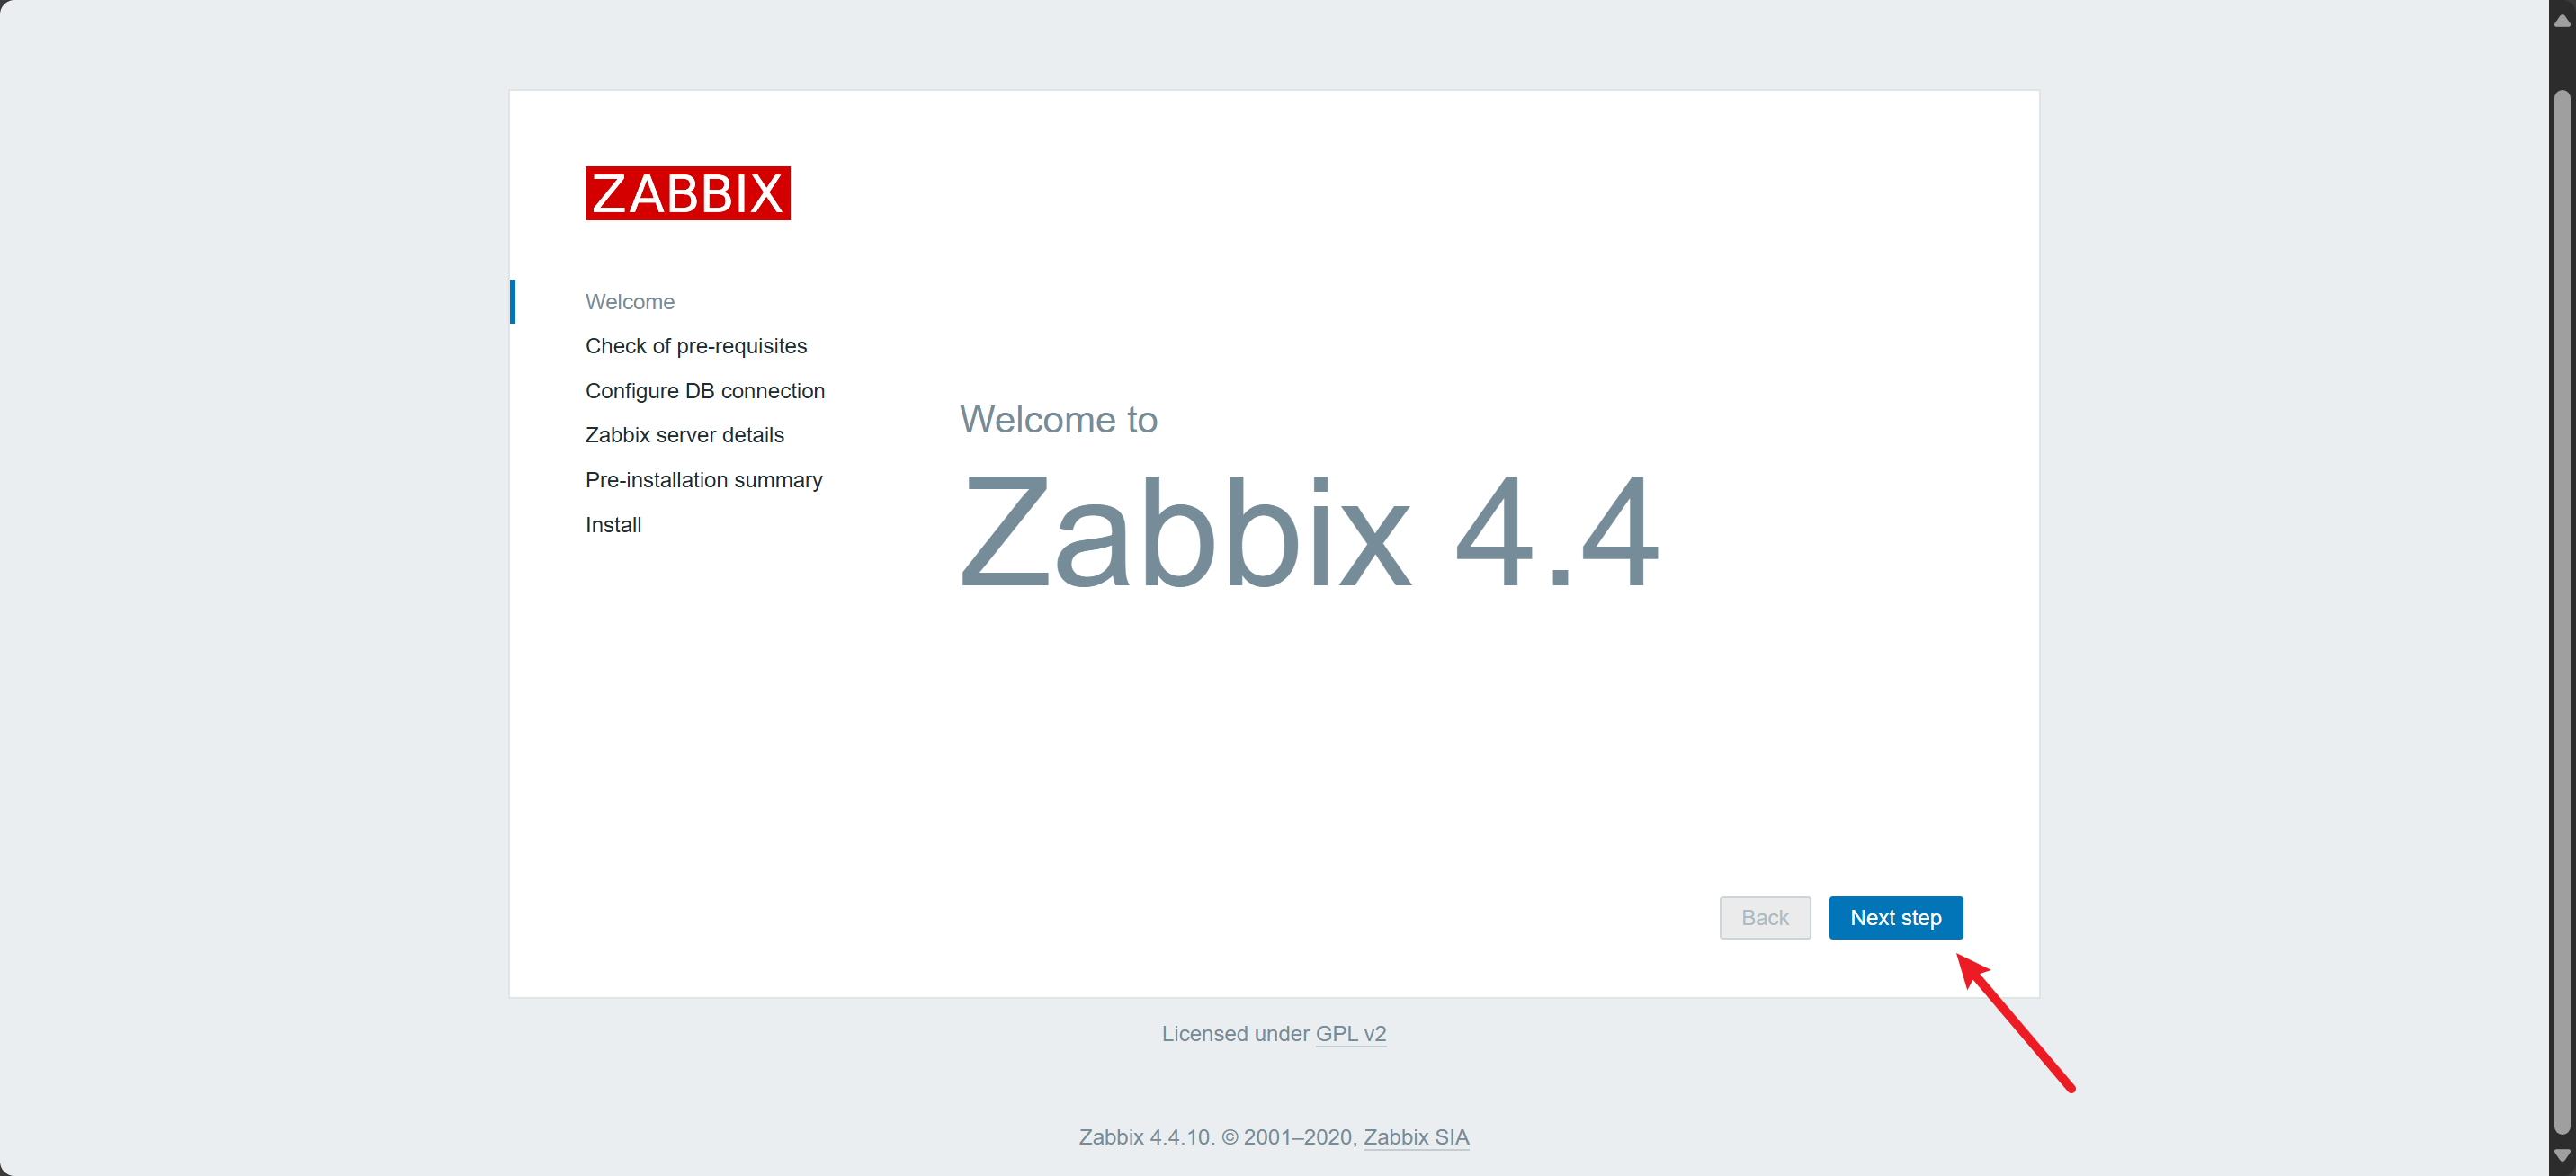
-
检测配置
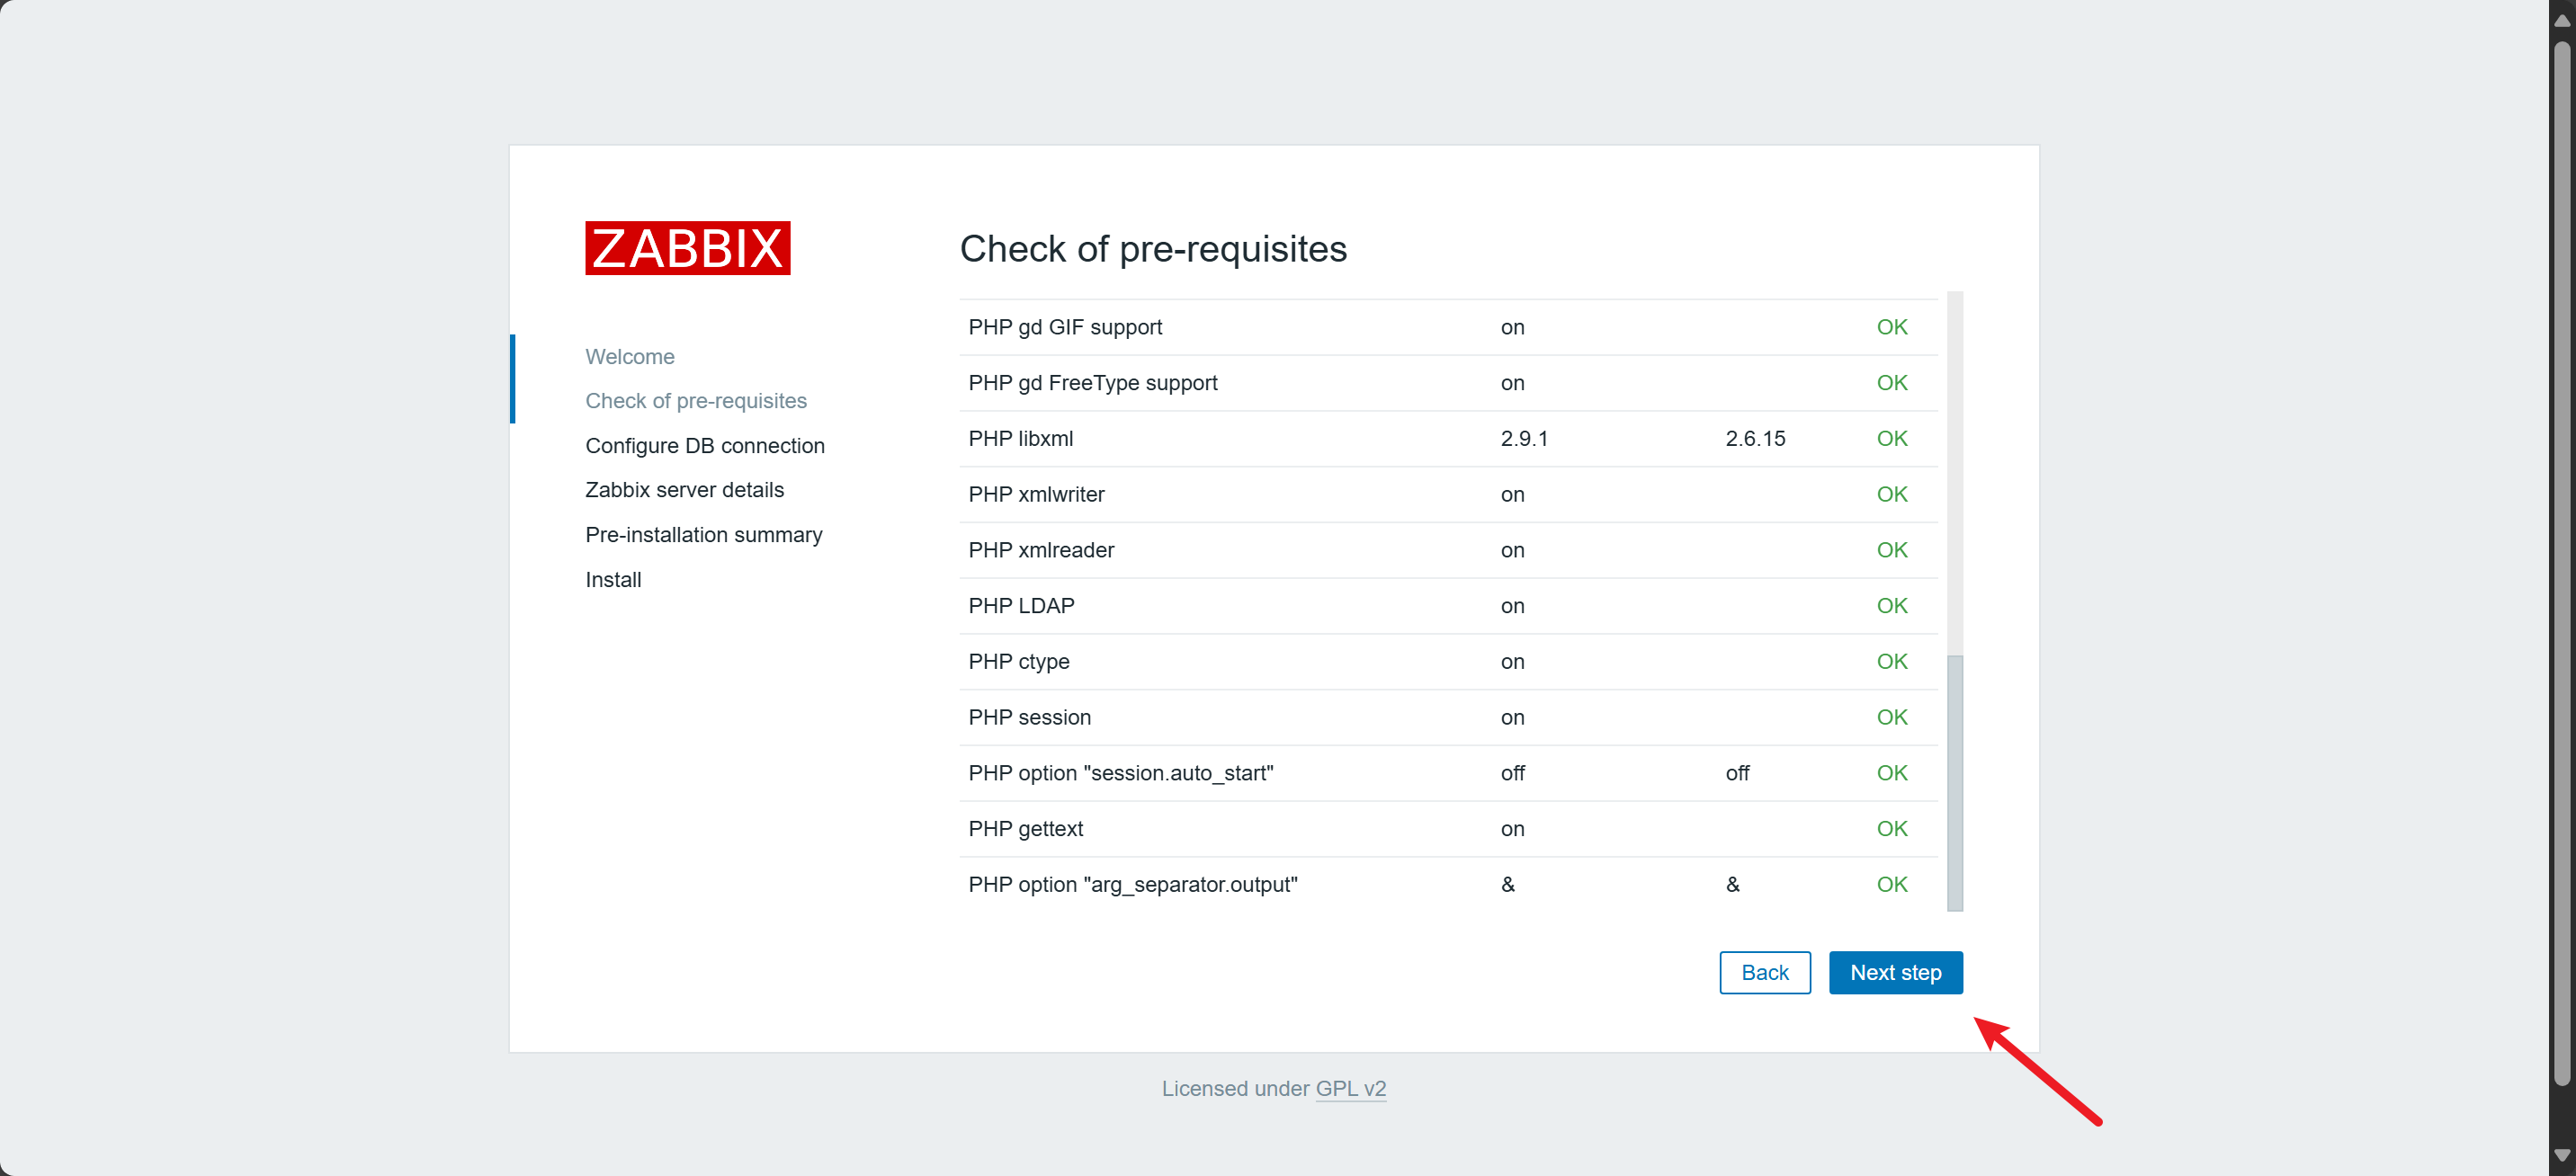
-
配置数据库
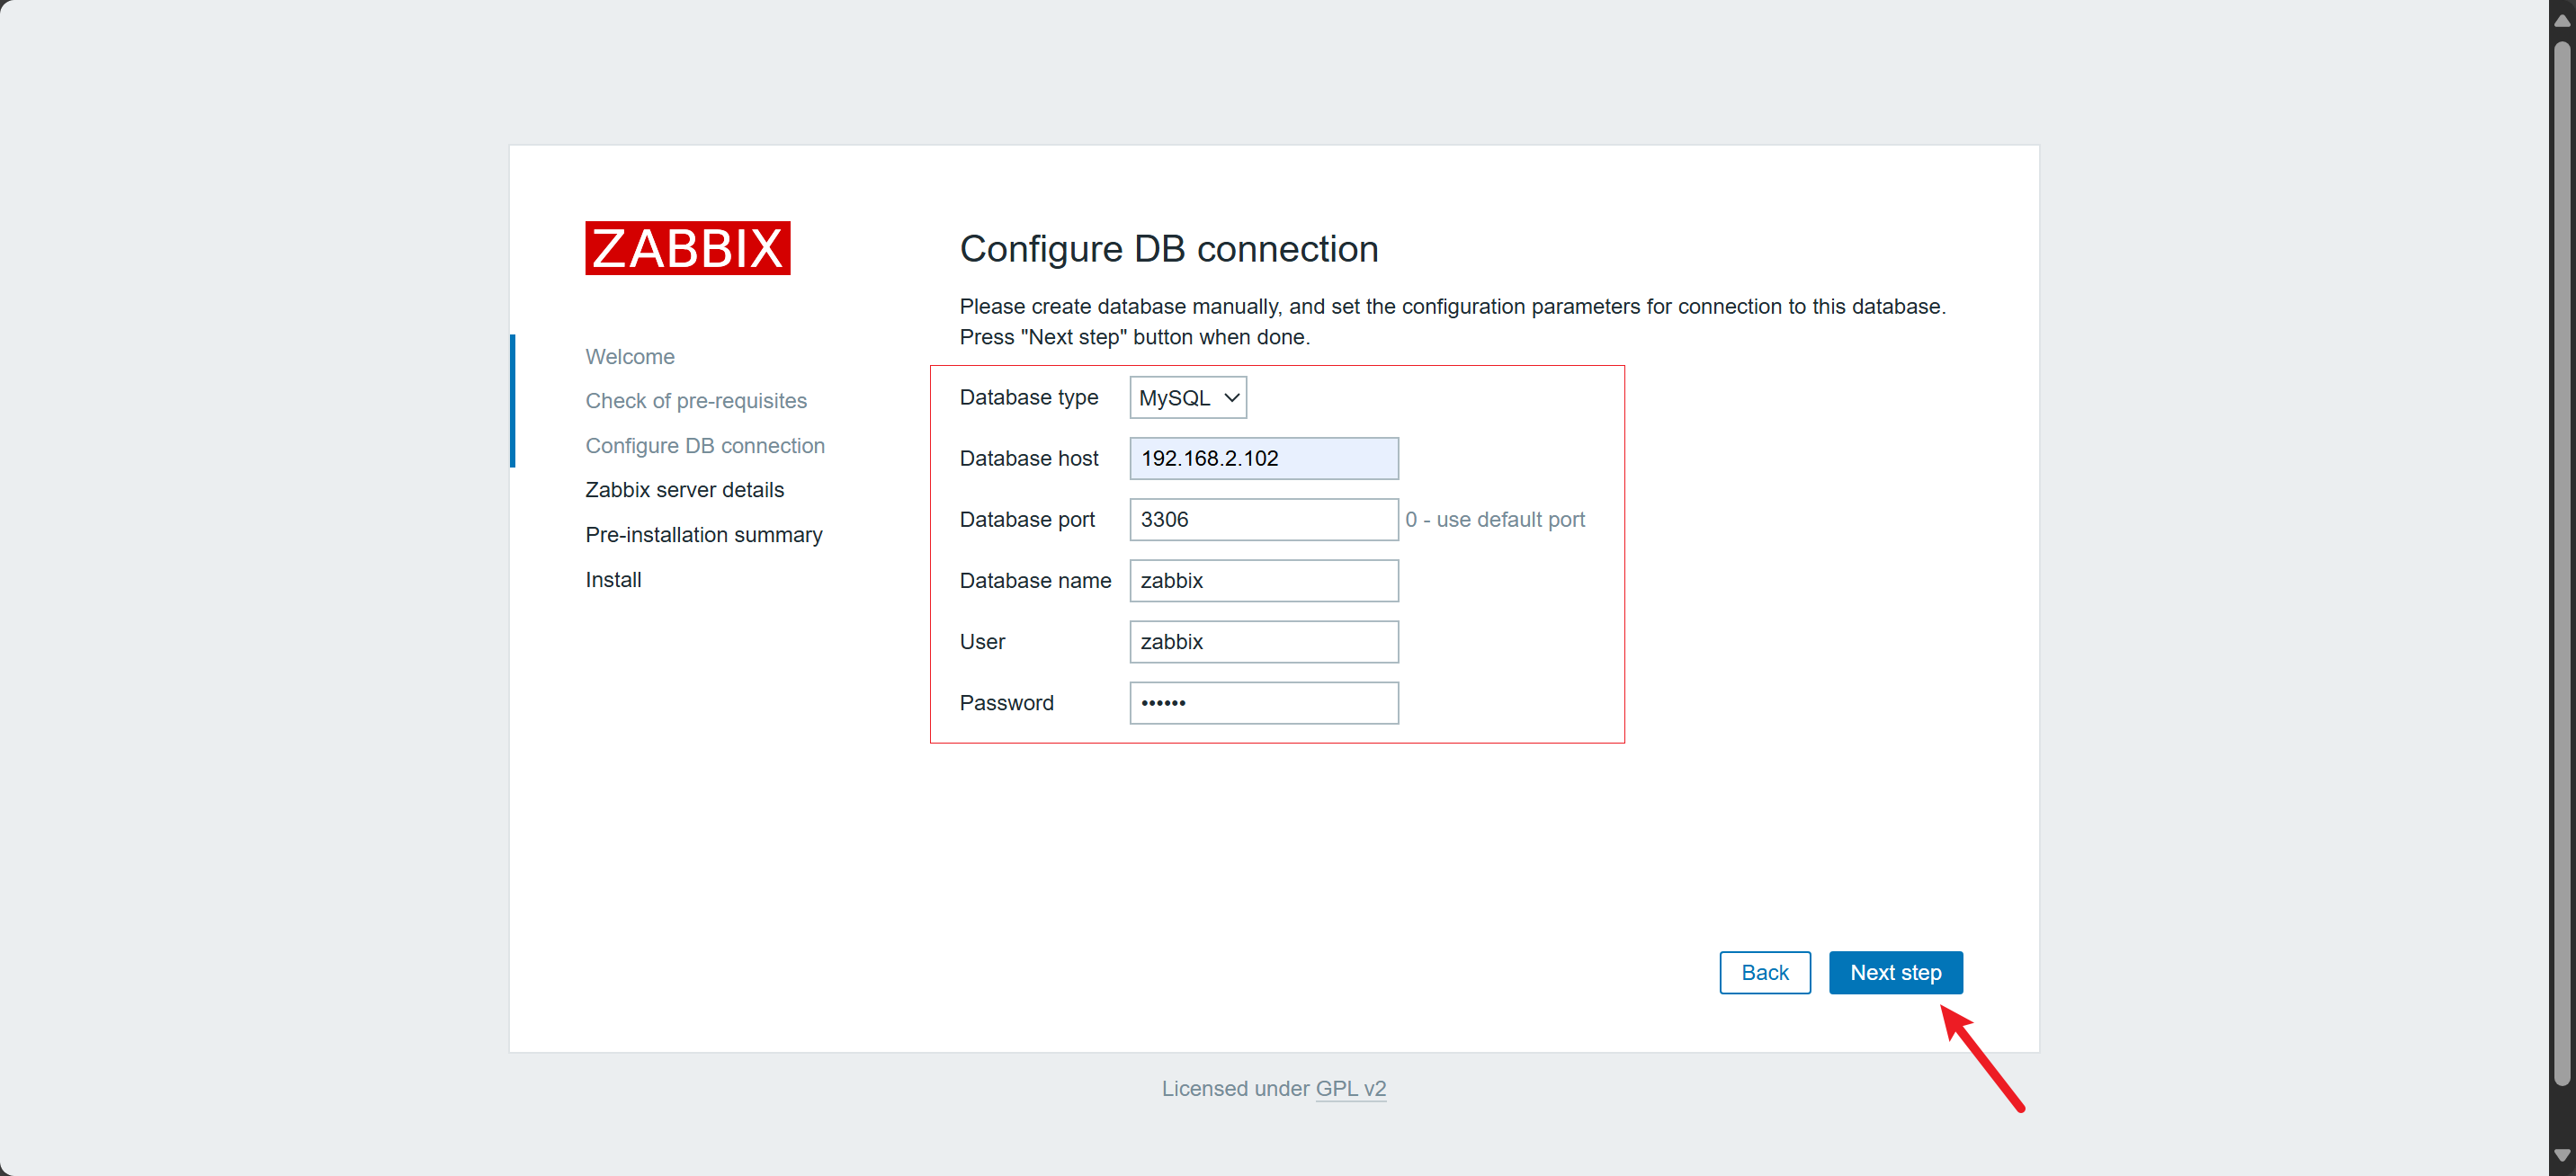
-
配置
Zabbix Server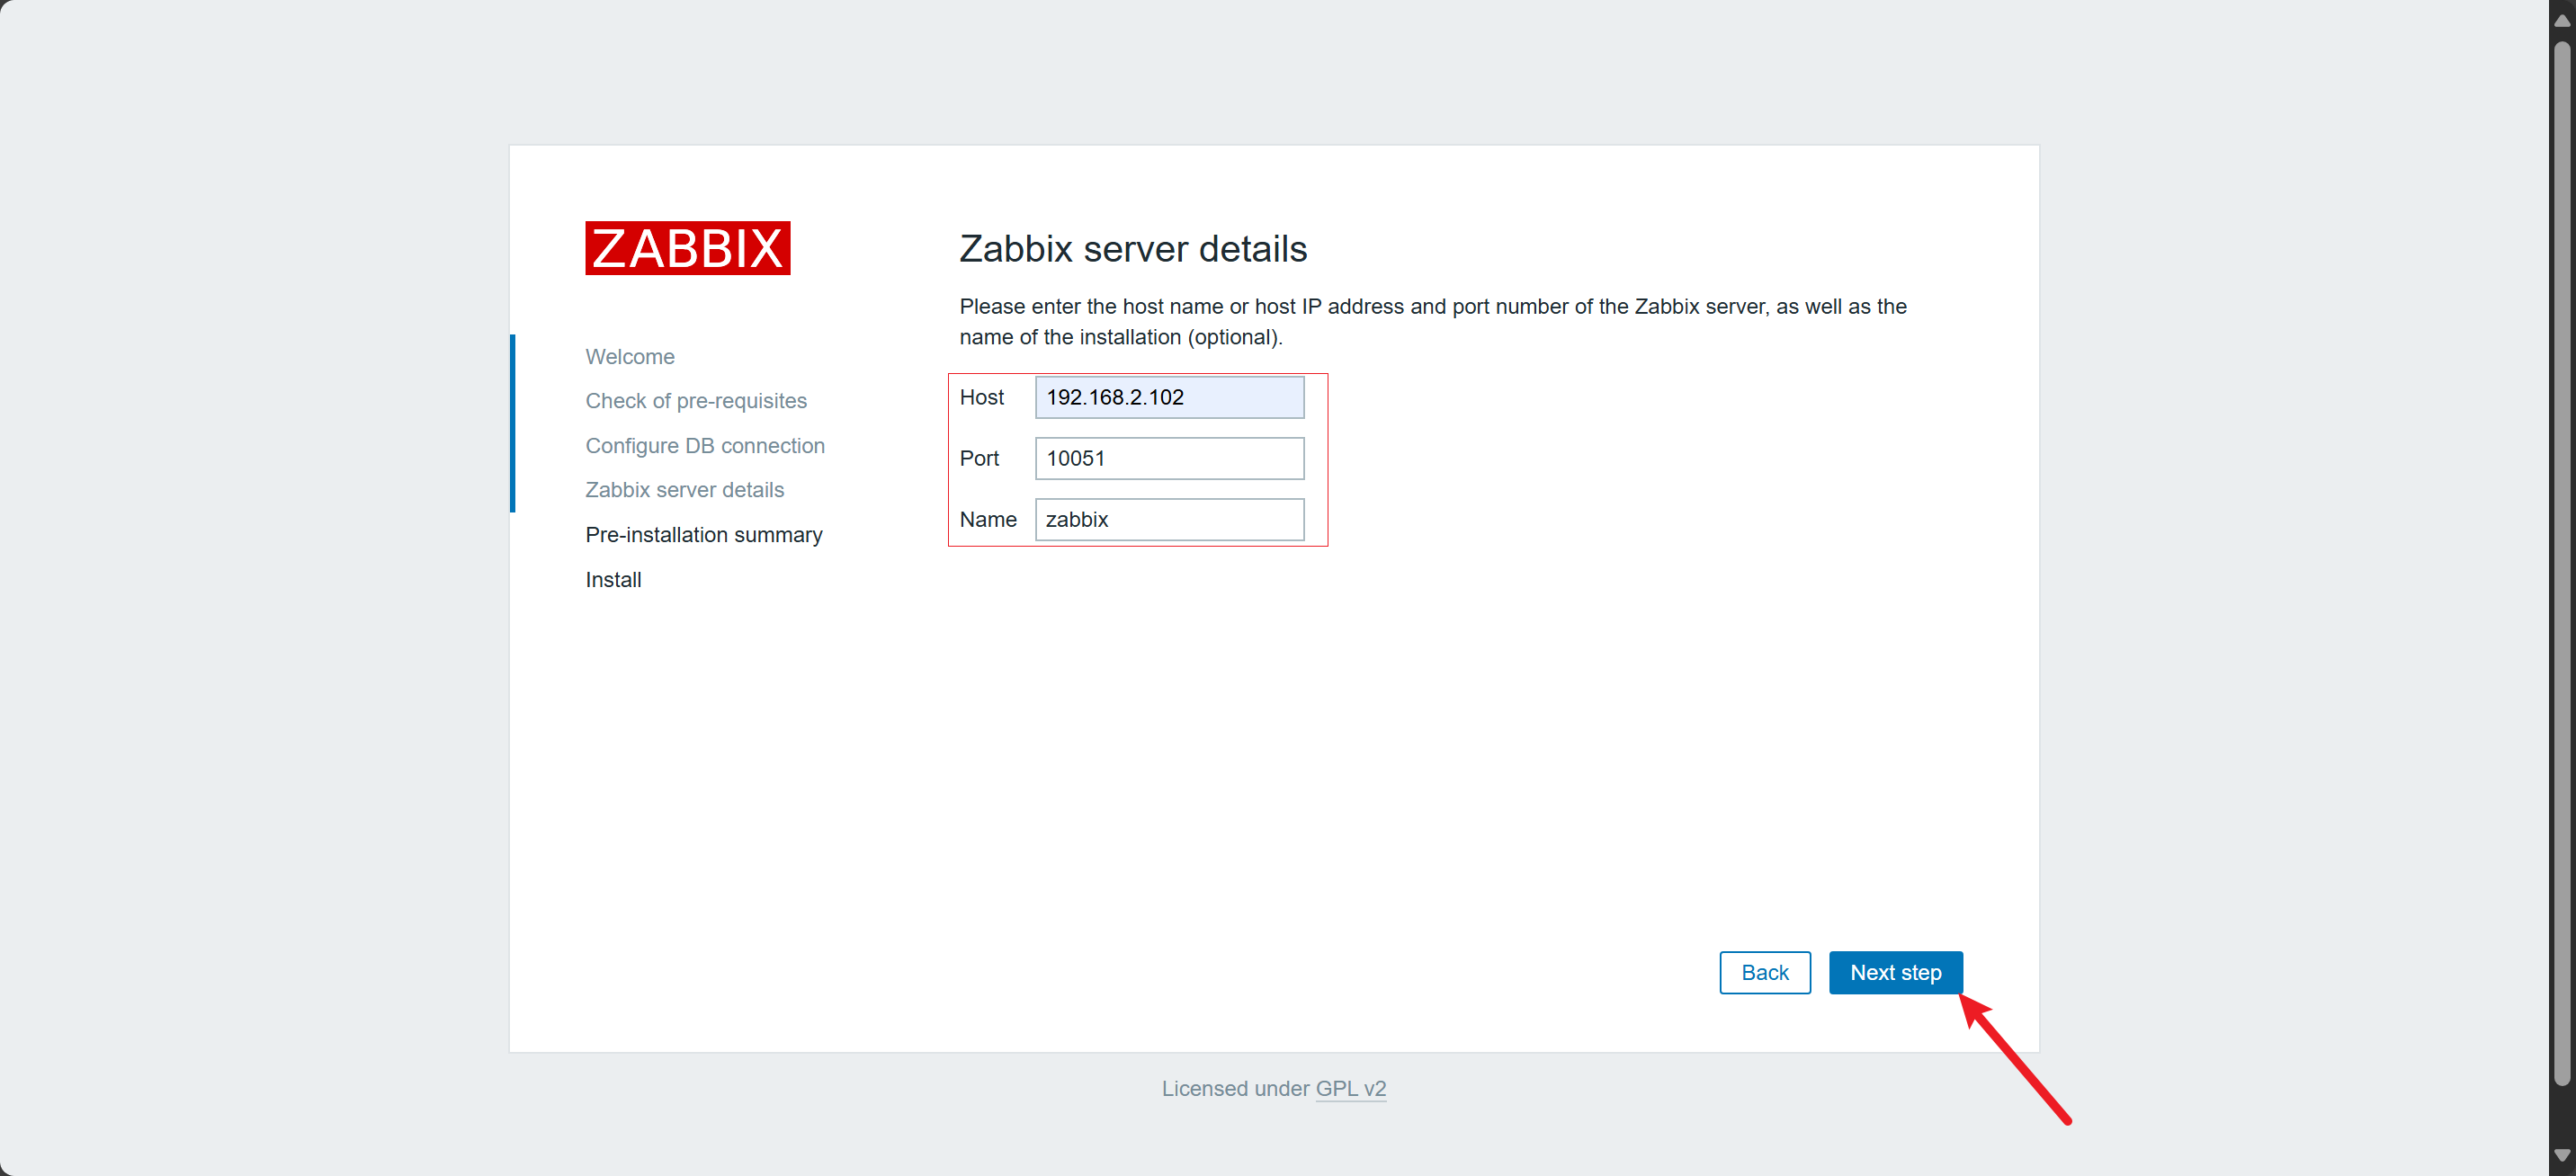
-
预览配置
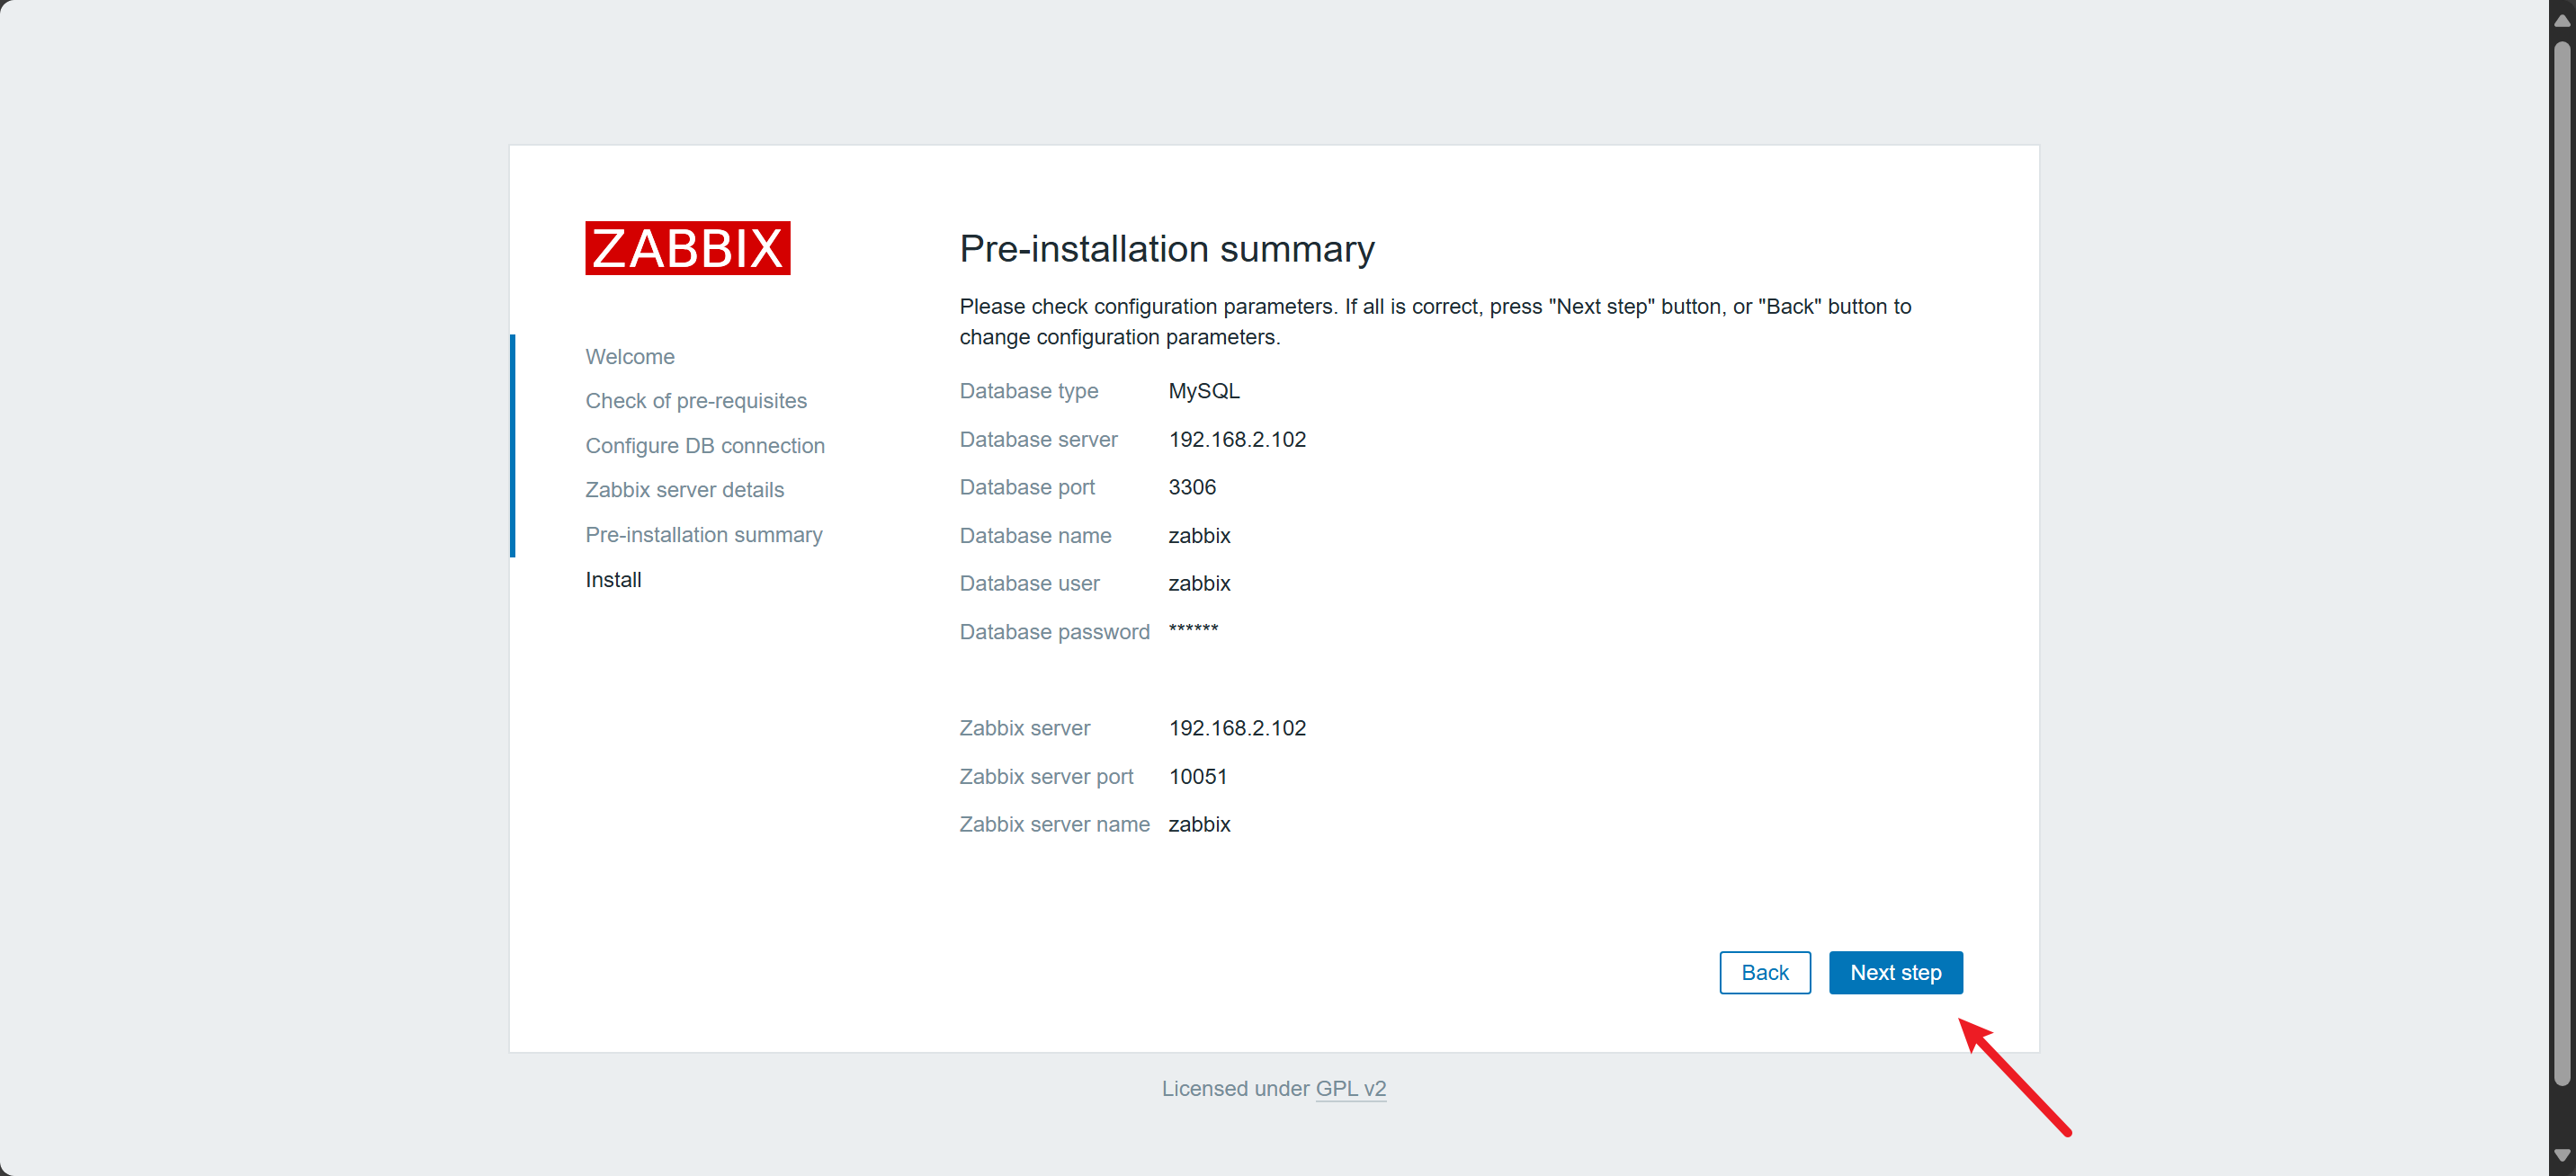
-
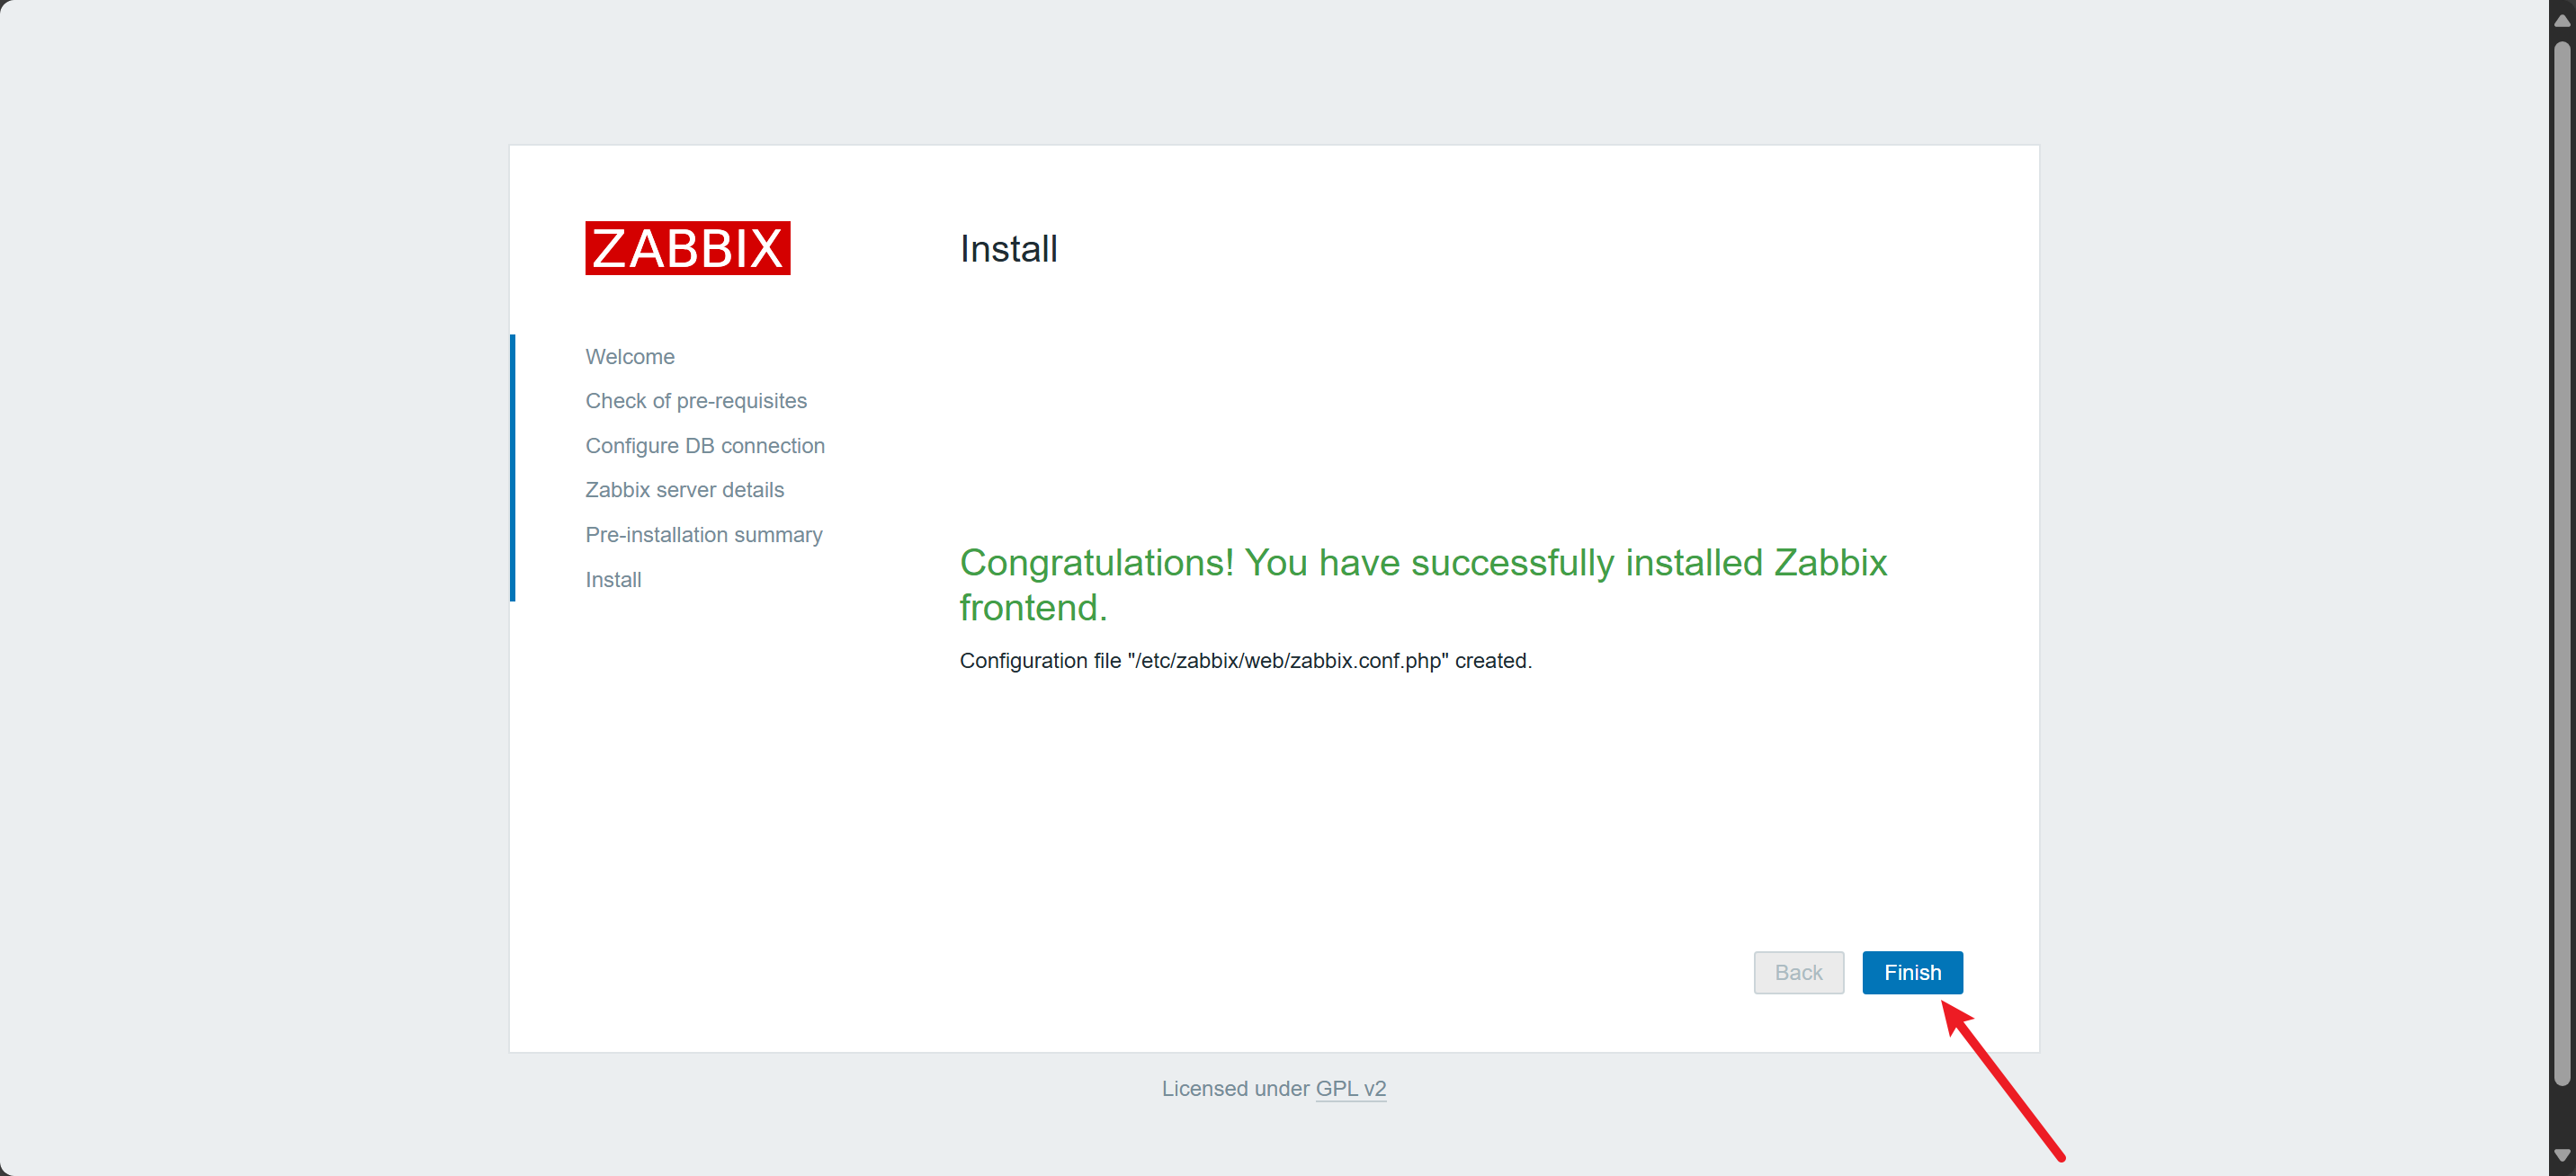
完成
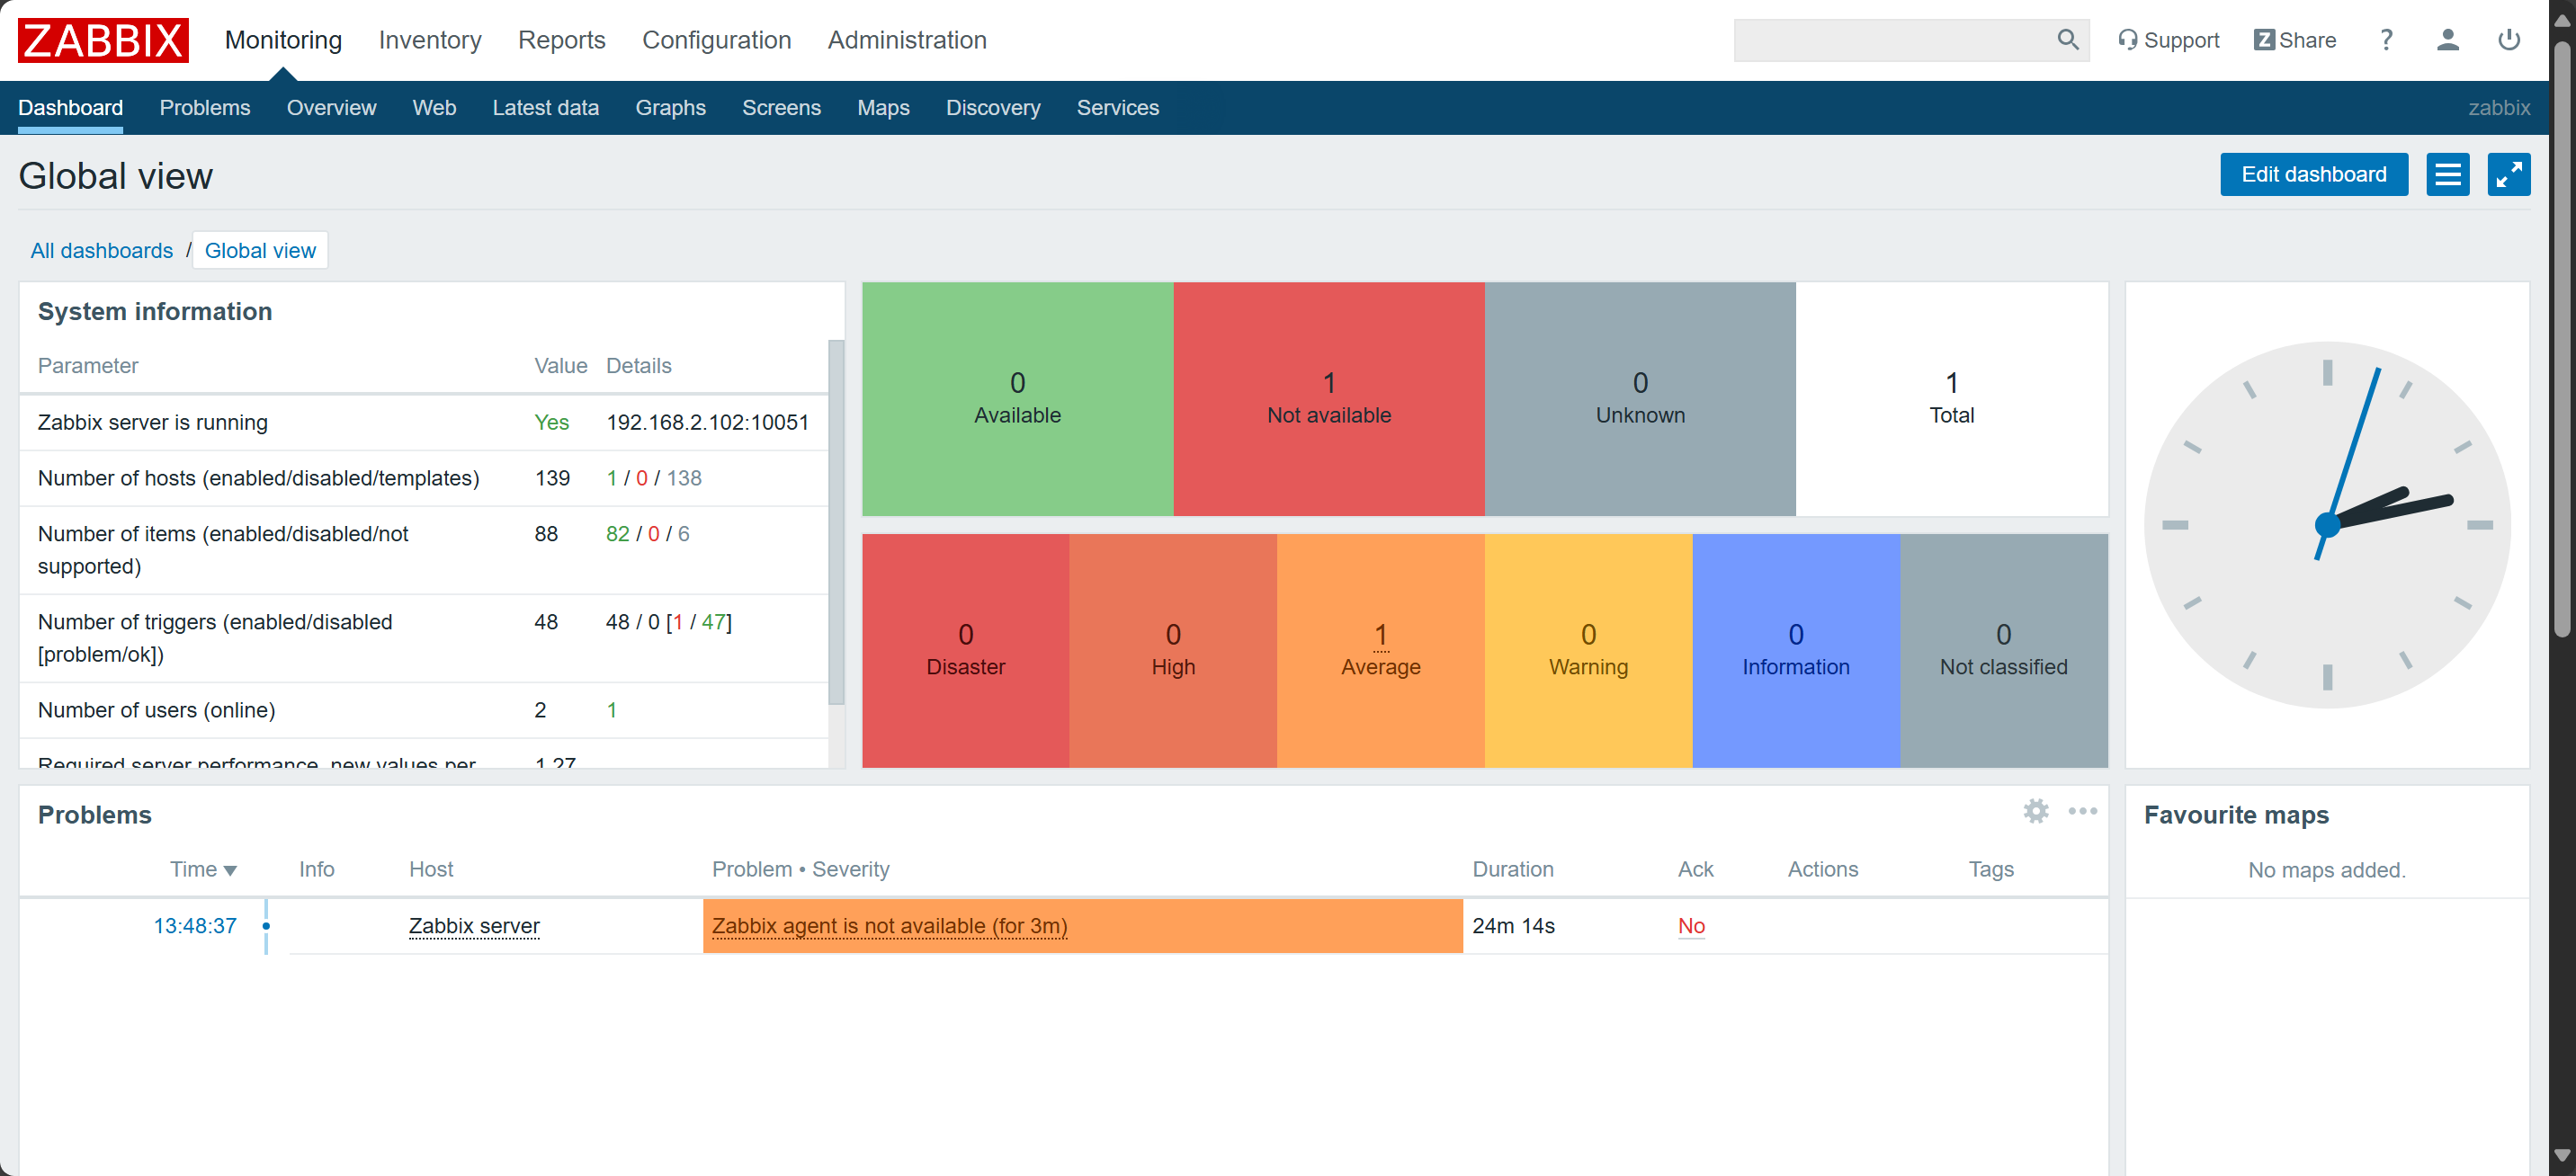
9)登录
Username: Admin
Password: zabbix

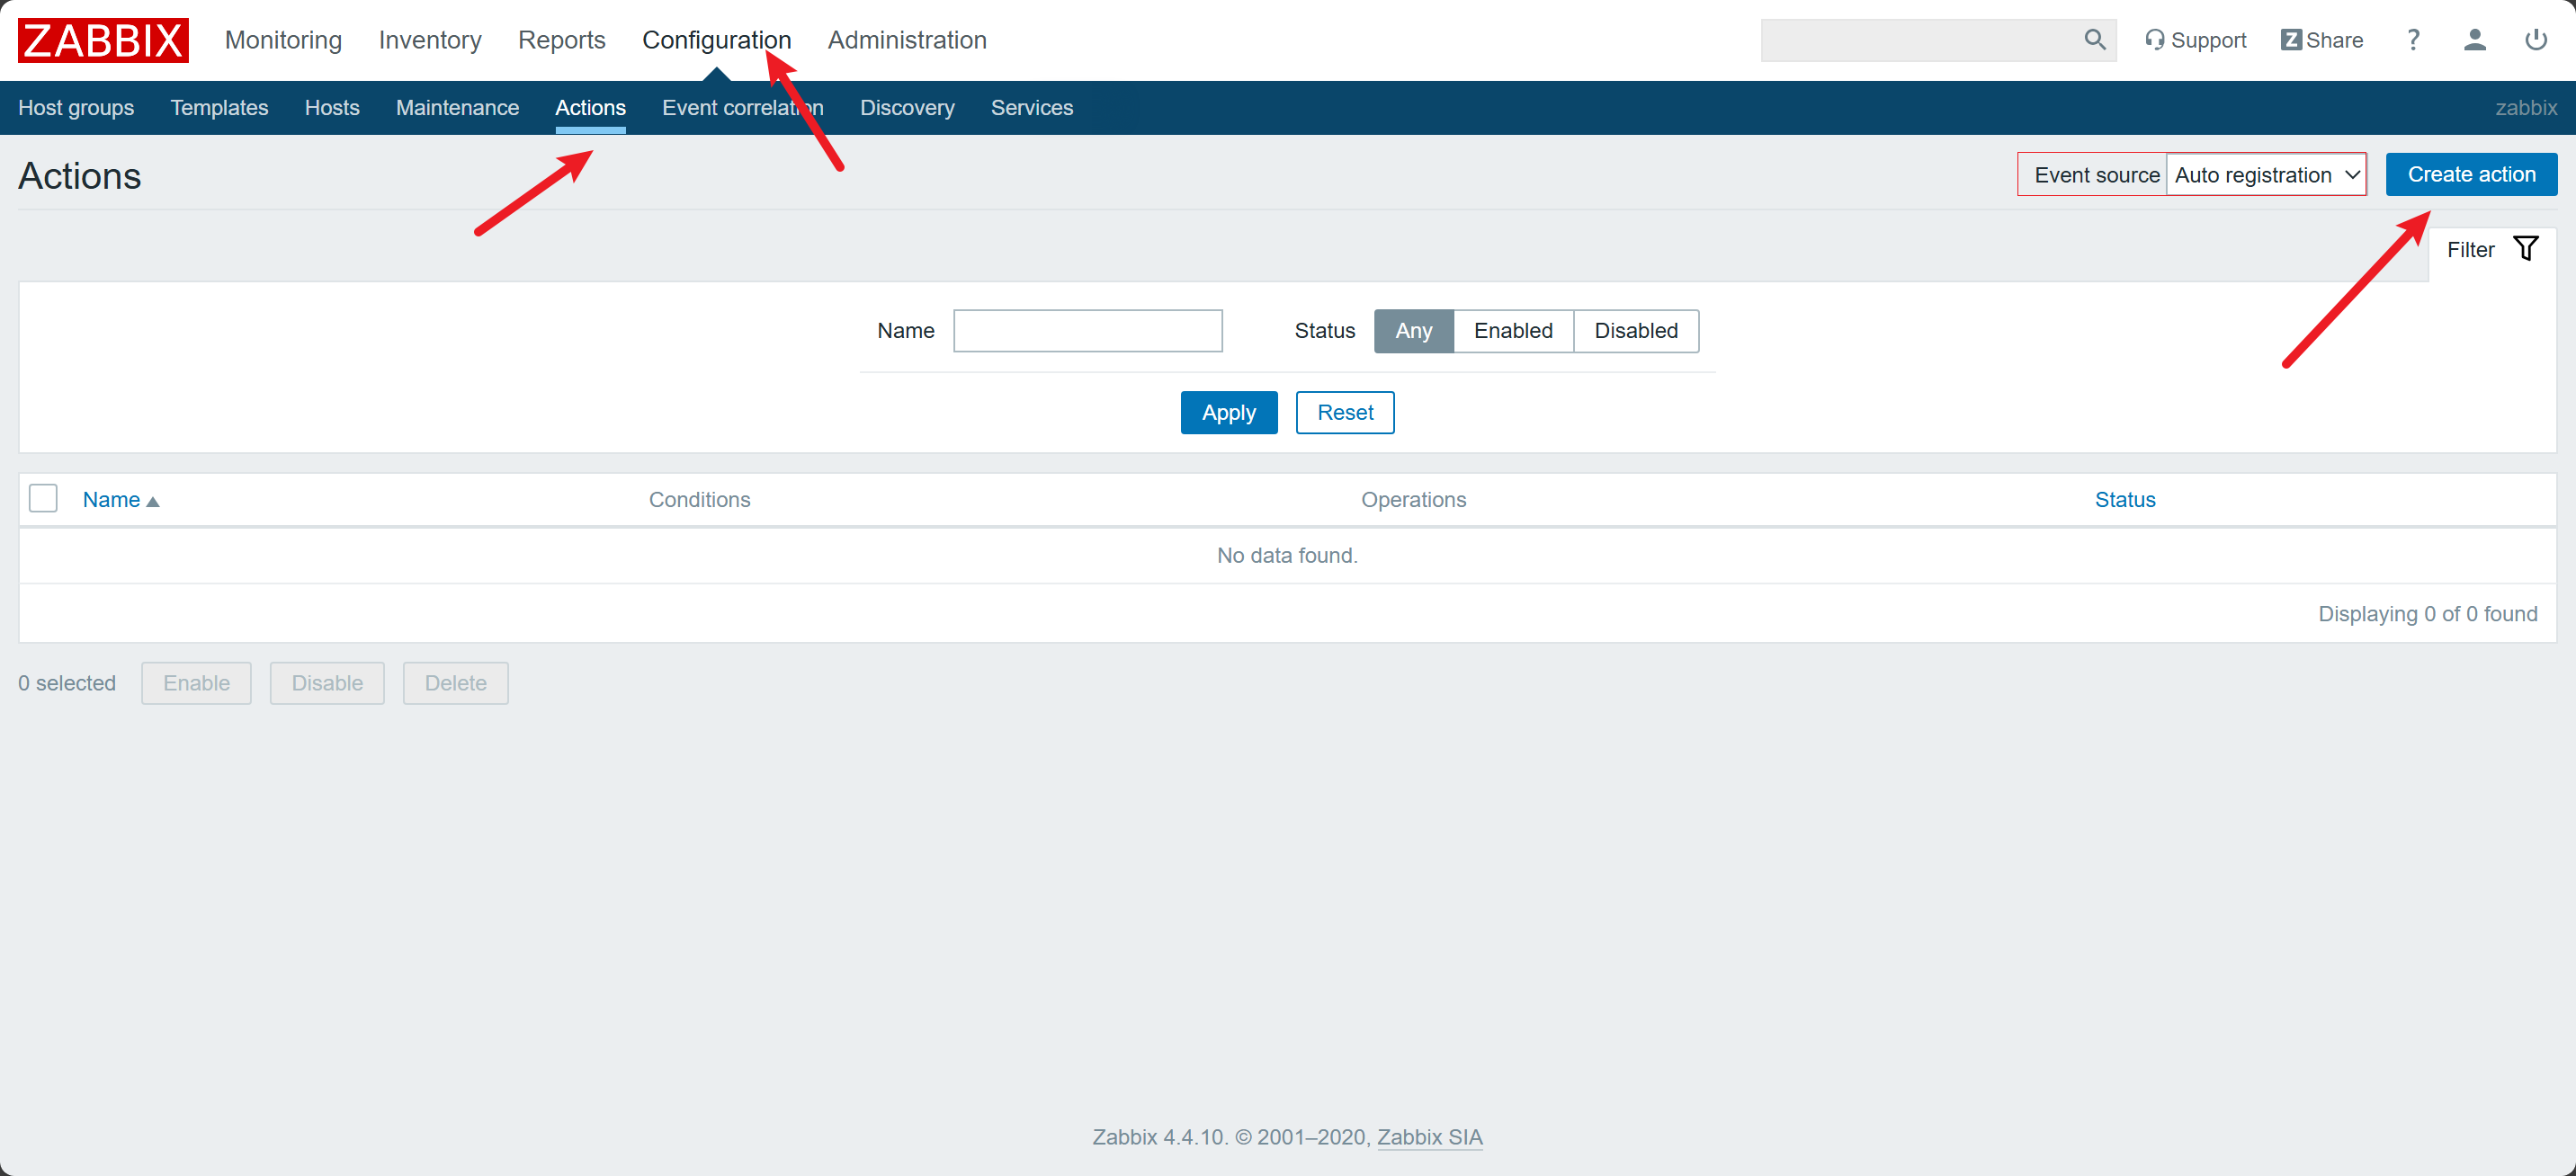
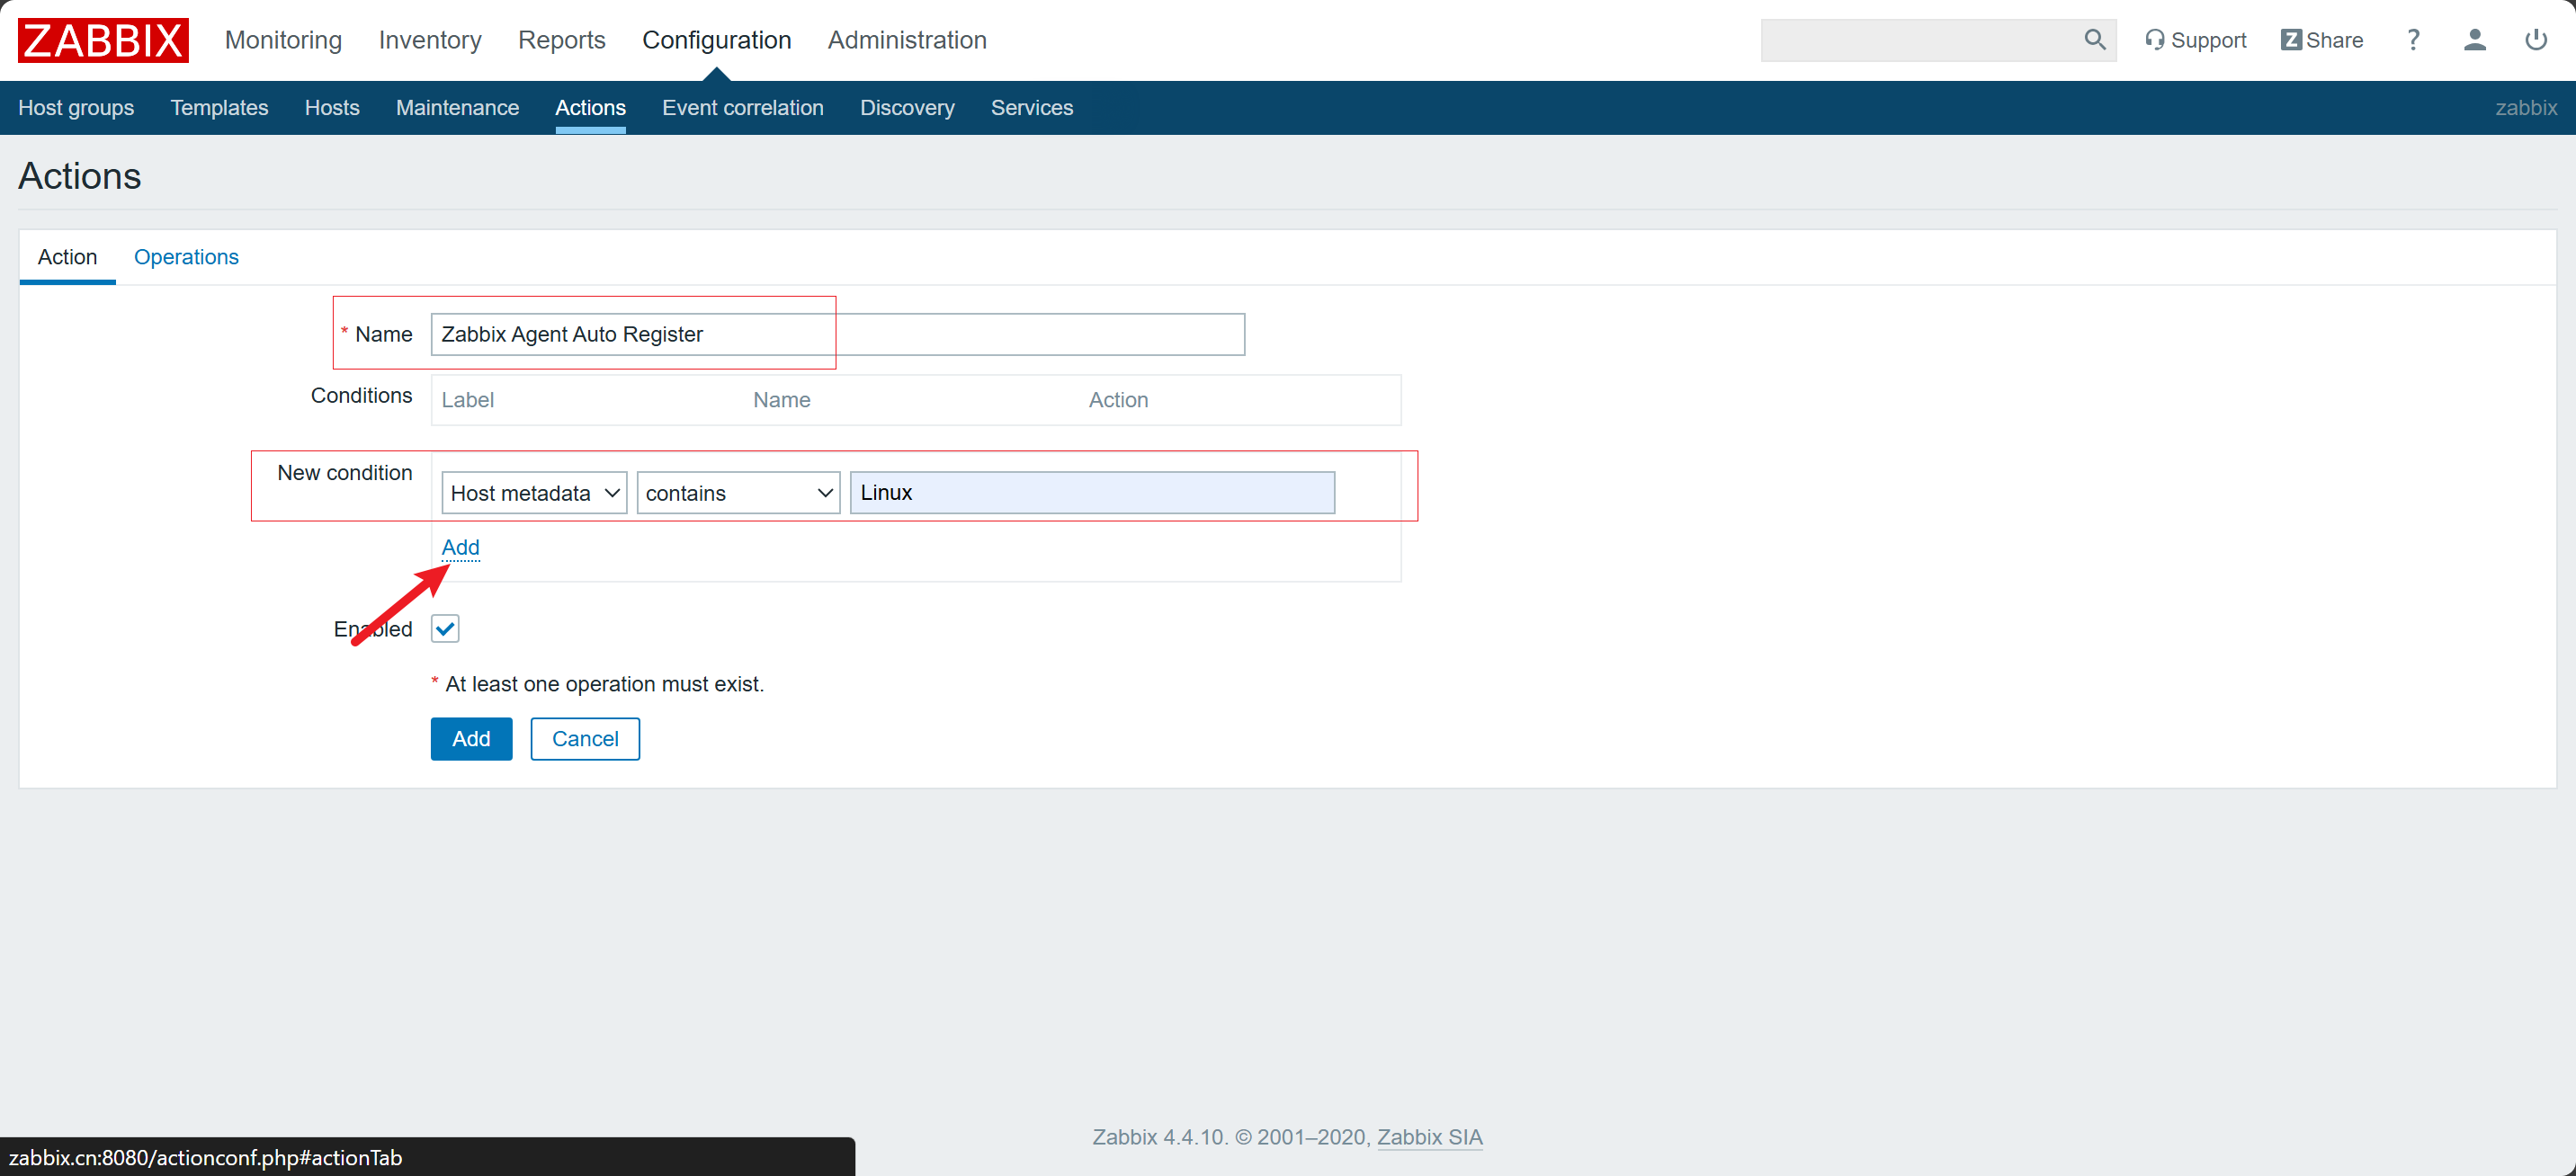
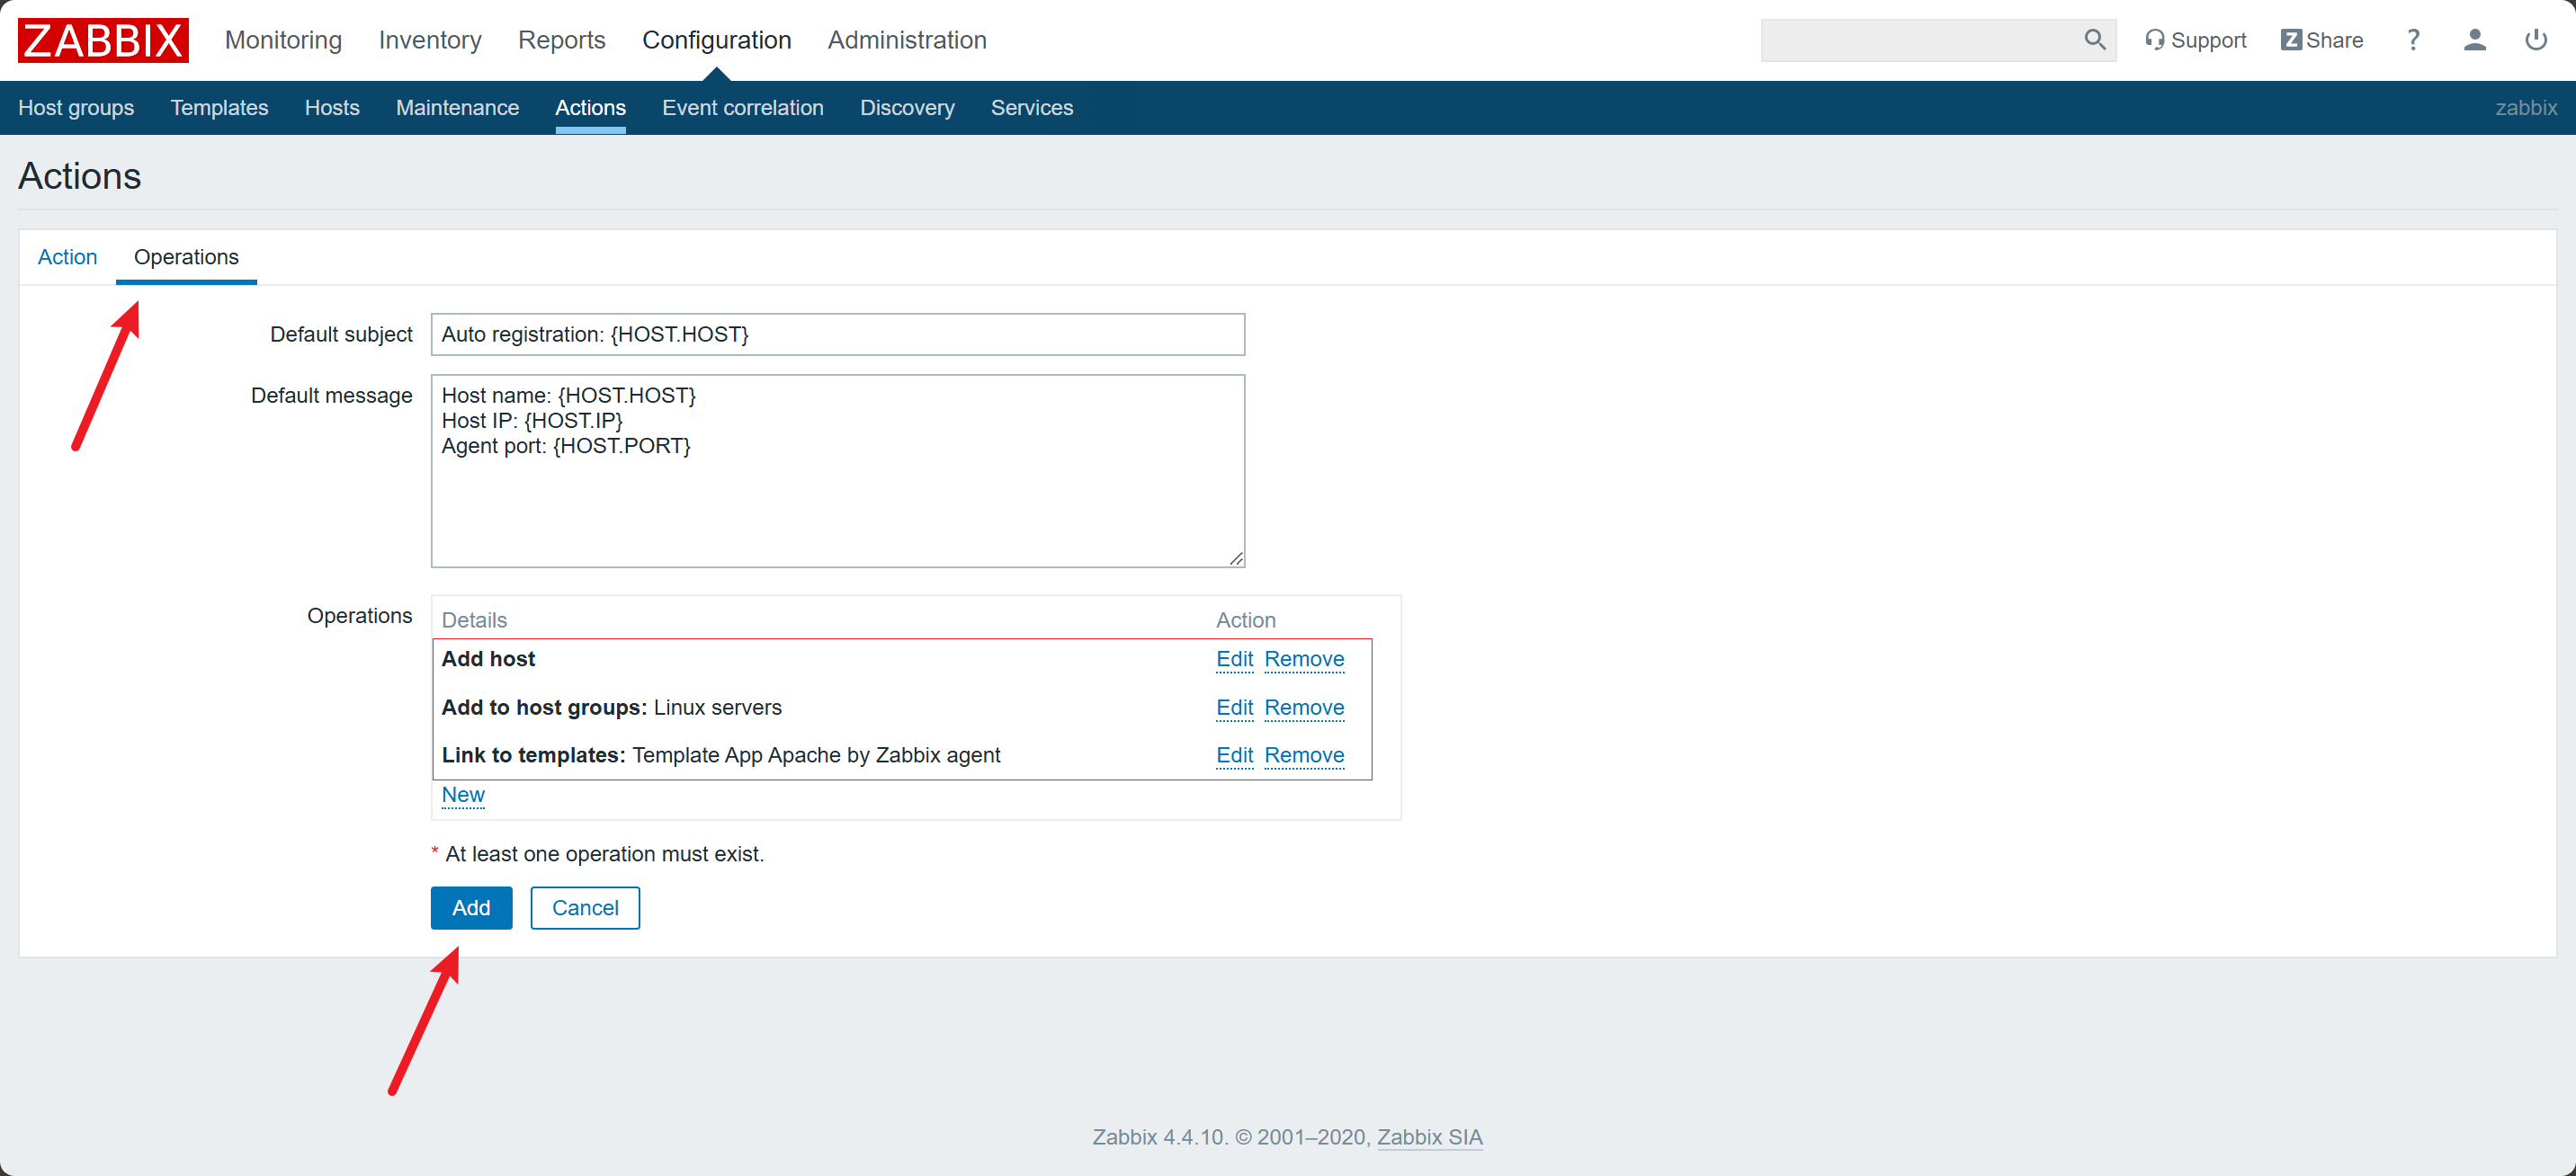
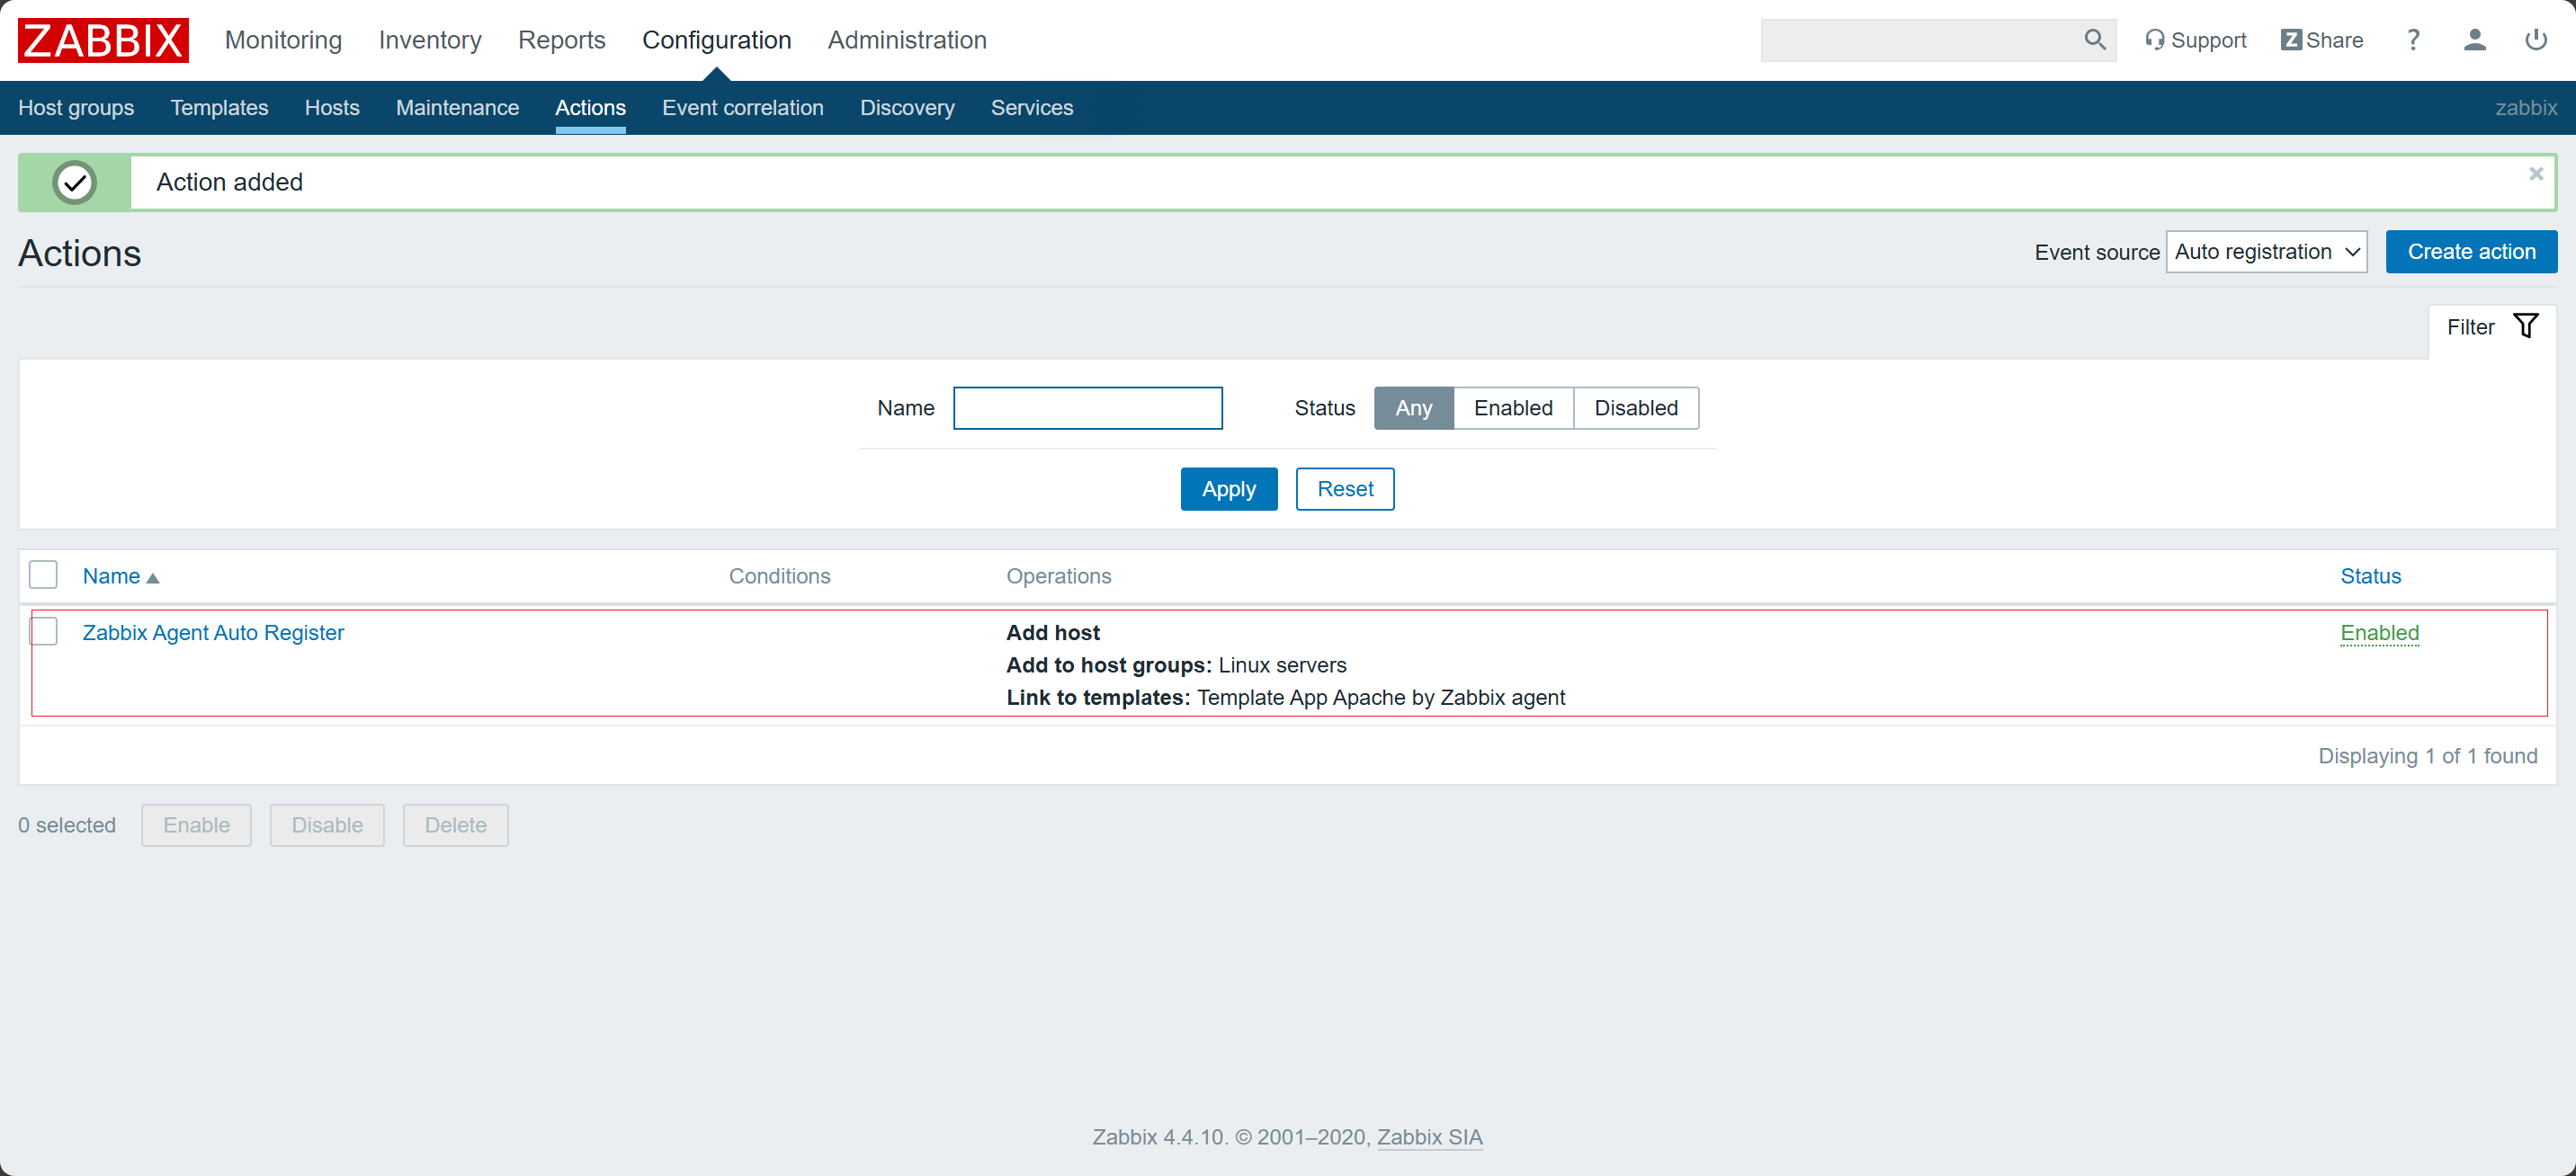
10)配置 Action
使安装有
Zabbix Agent的主机自动注册到Zabbix Server端
三:安装部署 Zabbix Agent
在
Hadoop103、Hadoop104安装
1)安装 Zabbix
-
获取
Zabbixyum源bash[root@hadoop103 ~]# rpm -Uvh https://repo.zabbix.com/zabbix/4.4/rhel/7/x86_64/zabbix-release-4.4-1.el7.noarch.rpm -
安装
epel源,用于支持Nginxbash[root@hadoop103 ~]# yum -y install zabbix-agent
2)修改 zabbix_agentd.conf 并启动 zabbix_agent
-
修改
zabbix_agentd.conf配置文件-
允许 Zabbix Server 访问(被动模式)
sed -i "s/Server=127.0.0.1/Server=hadoop102/g" /etc/zabbix/zabbix_agentd.conf- 修改
Server=127.0.0.1 → Server=hadoop102 - 作用:允许
hadoop102这台 Zabbix Server 来取数据。
- 修改
-
设置主动上报的目标(主动模式)
sed -i "s/ServerActive=127.0.0.1/ServerActive=hadoop102/g" /etc/zabbix/zabbix_agentd.conf- 修改
ServerActive=127.0.0.1 → ServerActive=hadoop102 - 作用:让 agent 主动把监控数据上报给
hadoop102。
- 修改
-
设置主机标识(唯一性)
sed -i "s#Hostname=Zabbix server#Hostname=$(hostname)#g" /etc/zabbix/zabbix_agentd.conf- 修改
Hostname=Zabbix server → Hostname=<本机名> - 作用:在 Zabbix Web 上显示真实主机名(如
hadoop103),避免和其他机器重名。
- 修改
-
配置自动注册元数据
sed -i "s#\# HostMetadataItem=#HostMetadataItem=system.uname#g" /etc/zabbix/zabbix_agentd.conf- 取消注释并设置
HostMetadataItem=system.uname - 作用:在自动注册时,上报操作系统内核信息,便于 Zabbix Server 识别和分组。
- 取消注释并设置
bash[root@hadoop103 ~]# sed -i "s/Server=127.0.0.1/Server=hadoop102/g" /etc/zabbix/zabbix_agentd.conf [root@hadoop103 ~]# sed -i "s/ServerActive=127.0.0.1/ServerActive=hadoop102/g" /etc/zabbix/zabbix_agentd.conf [root@hadoop103 ~]# sed -i "s#Hostname=Zabbix server#Hostname=$(hostname)#g" /etc/zabbix/zabbix_agentd.conf [root@hadoop103 ~]# sed -i "s#\# HostMetadataItem=#HostMetadataItem=system.uname#g" /etc/zabbix/zabbix_agentd.conf -
-
启动
Zabbix Agentbash[root@hadoop103 ~]# systemctl start zabbix-agent [root@hadoop103 ~]# systemctl enable zabbix-agent
总结
✅ 在本篇中,我们详细介绍了如何搭建 Grafana 环境,涵盖了从基础的服务器准备到安装所需依赖的过程。通过安装与配置相关数据库和环境,确保了 Grafana 能顺利运行,并为后续的仪表盘创建和数据展示提供了稳固的基础。
✅ 通过快速部署 Grafana 环境,用户能够在短时间内搭建起自己的监控数据可视化平台,为团队的监控工作提供强有力的支持。