在建设监控体系的过程中,针对一个系统的监控是多维度的,除了服务器资源状态、中间件状态、应用状态外,对系统访问状态的监控也是很有必要,可以在系统访问出现异常时第一时间通知到我们。本文介绍使用 Docker-compose 方式一键部署 Prometheus + Grafana + alertmanager + blackbox_exporter,实现黑盒测试(站点监控),docker-compose.yml 文件已上传至 Github ,直接启动即可。
1. 安装 docker-compose
Docker 和 Docker-Compose 安装方法参考: Docker二进制安装教程!-CSDN博客
2. 下载docker-compose.yml
因为某些原因,拉取失败可以多拉取几次
$ git clone https://github.com/Public-Compose/Prometheus-Grafana.git3. 启动 Prometheus 容器
各个组件的镜像已改为阿里源,境内可正常拉取
$ cd Prometheus-Grafana
$ docker-compose up -d
4. 添加权限重启
$ chmod 777 -R prometheus grafana alertmanager pushgateway blackbox_exporter
$ docker-compose restart
5. 地址测试
查一下容器状态是否都正常
$ docker-compose ps**「Prometheus访问地址:」**http://IP:9090
**「Grafana访问地址:」**http://IP:3000 账号: admin 密码: admin
**「Alertmanager访问地址:」**http://IP:9093
**「Pushgateway访问地址:」**http://IP:9091
**「blackbox访问地址:」**http://IP:9115
6. Grafana添加数据源
「选择 Configuration -- data sources -- Add data sources -- Prometheus」
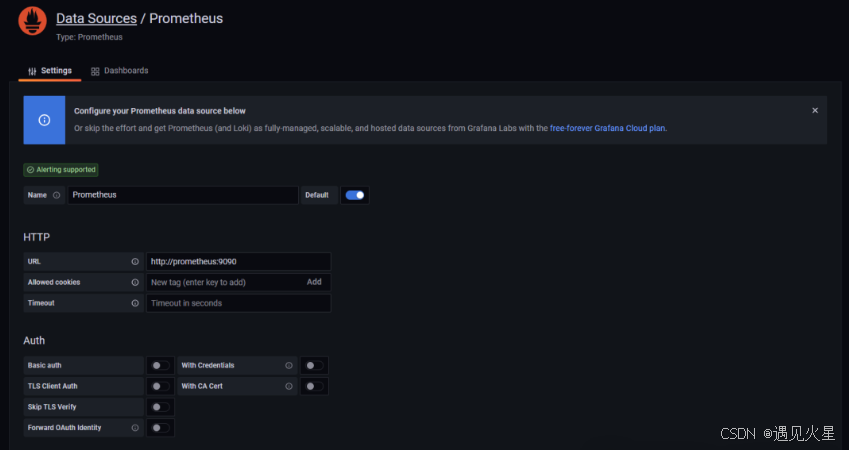 「URL:」http://prometheus:9090
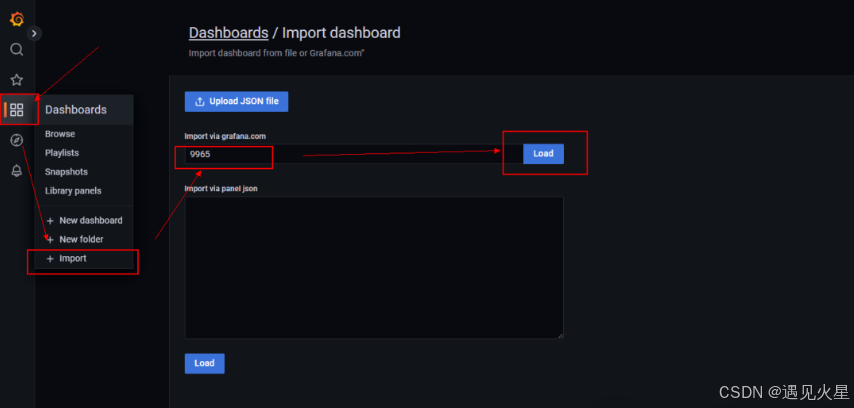
7. 导入模板 -- 9965
7.1 选择 Dashboards -- Import -- ID 输入9965,点击Load
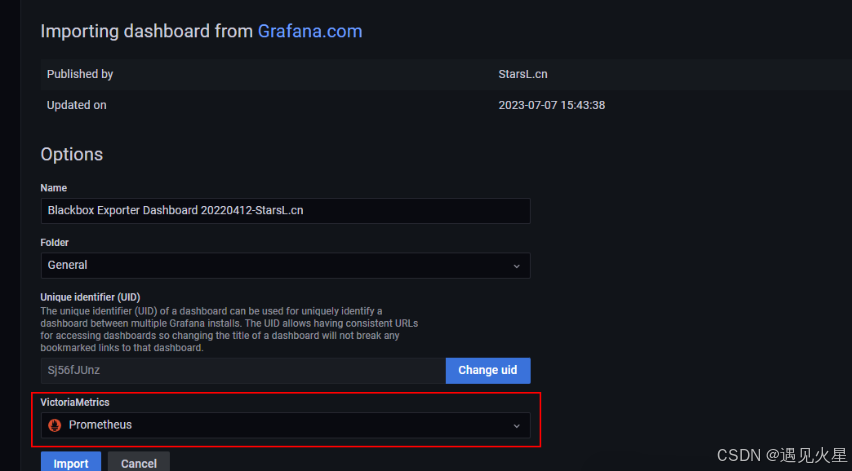
 7.2 选择数据源
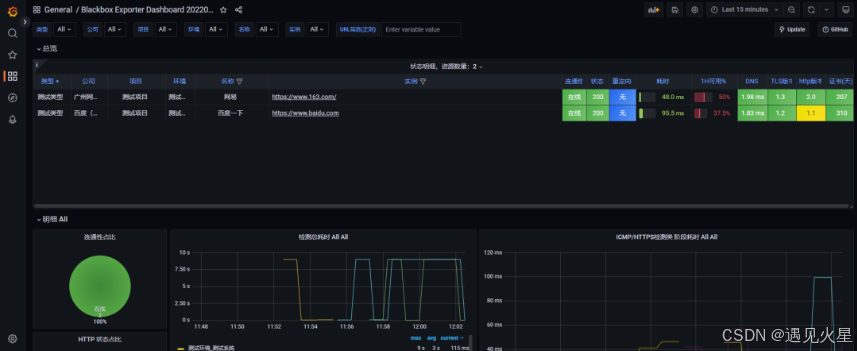
8. 站点监控完成
可通过修改 Prometheus-Grafana\prometheus\blackbox 目录下的数据源文件调整监控站点信息,每30s自动刷新源数据
 到此,对站点监控状态的可视化已完成,后续需根据通知方式配置告警器及
 rules,如果使用AlertManager则需编写rules和安装webhook,也可参考我之前的文章直接使用夜莺(nightingale)进行告警配置。