第一章 深度学习革命
从数据中学习概率是机器学习的核心。
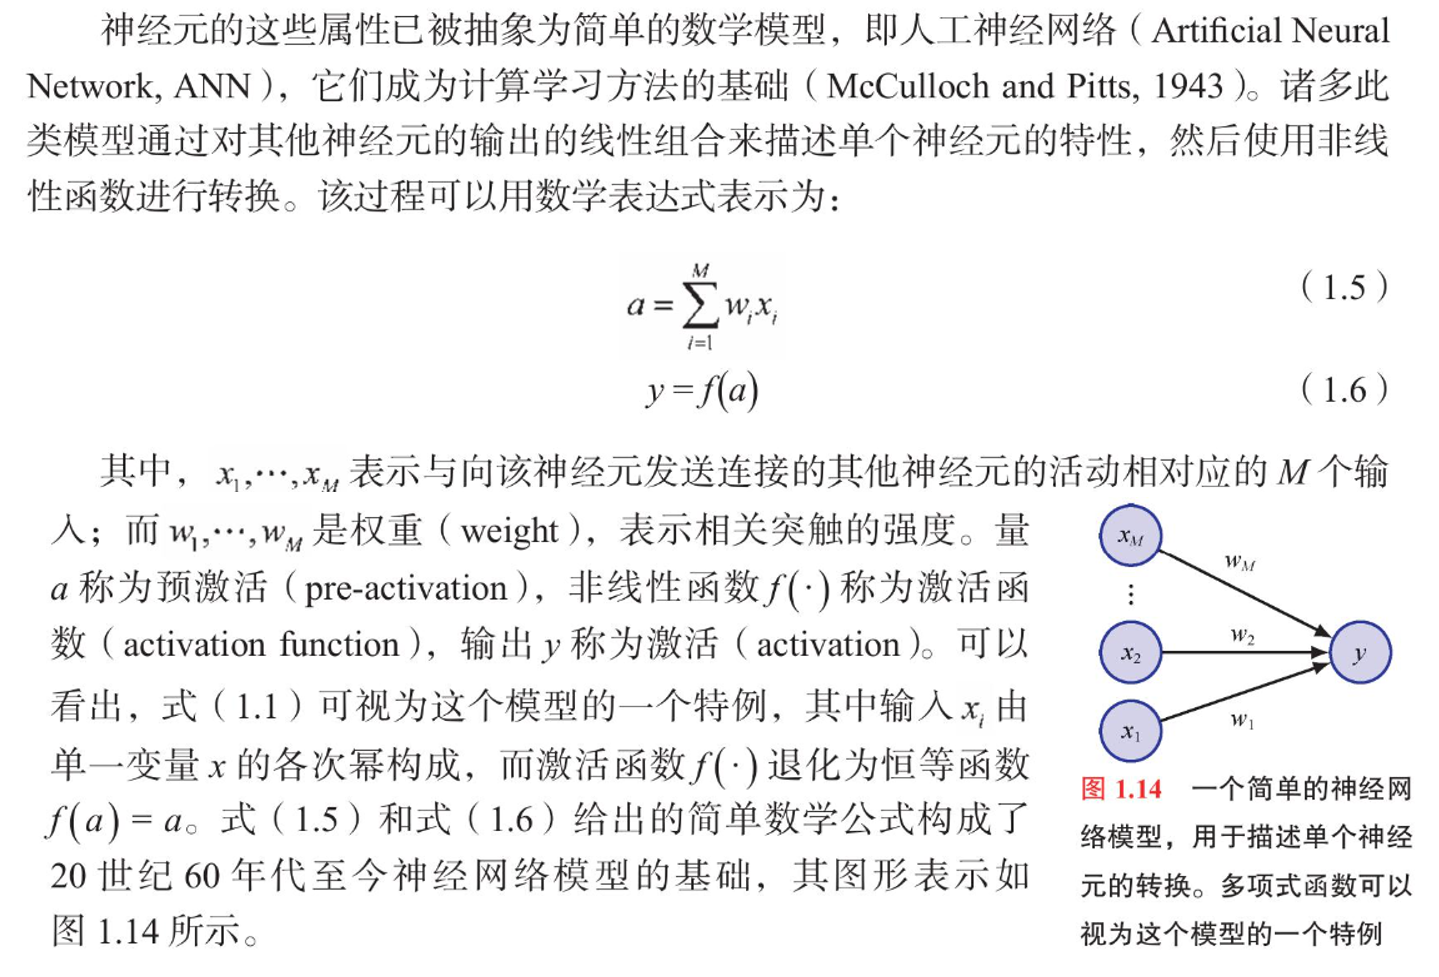
这种概率本质上可通过概率分布函数 来建模。机器学习通过函数 F(如神经网络、概率图模型)拟合数据的概率分布,其内在是通过优化算法求解 "可能性最大" 的模型参数。在这一过程中既依赖概率论的数学严谨性,也依赖计算科学的工程创造力,在很大程度上,推动着人工智能从 "数据拟合" 迈向 "智能决策"。
(总览)思维导图
1.2
为了更好的理解,这里和书中一样,以sin(2x) 为例子,对此还构建了一个多项式拟合交互页面。
大家可以"玩一玩",通过修改模型的4个参数,呈现不同的函数拟合可视化情况。

html
<!DOCTYPE html>
<html lang="zh-CN">
<head>
<meta charset="UTF-8">
<meta name="viewport" content="width=device-width, initial-scale=1.0">
<title>多项式拟合sin(2πx)演示</title>
<script src="https://cdn.tailwindcss.com"></script>
<link href="https://cdn.jsdelivr.net/npm/font-awesome@4.7.0/css/font-awesome.min.css" rel="stylesheet">
<script src="https://cdn.jsdelivr.net/npm/chart.js@4.4.8/dist/chart.umd.min.js"></script>
<script>
tailwind.config = {
theme: {
extend: {
colors: {
primary: '#3b82f6',
secondary: '#10b981',
danger: '#ef4444',
dark: '#1e293b',
light: '#f8fafc'
},
fontFamily: {
sans: ['Inter', 'system-ui', 'sans-serif'],
},
}
}
}
</script>
<style type="text/tailwindcss">
@layer utilities {
.content-auto {
content-visibility: auto;
}
.transition-all-300 {
transition: all 300ms ease-in-out;
}
.shadow-card {
box-shadow: 0 10px 15px -3px rgba(0, 0, 0, 0.1), 0 4px 6px -2px rgba(0, 0, 0, 0.05);
}
}
</style>
<style>
body {
overflow-x: hidden;
}
.card-padding {
padding: 1rem;
}
.chart-container {
height: 400px;
}
.header-content {
max-width: 100%;
}
@media (min-width: 1024px) {
.lg-flex-grow {
flex-grow: 1;
}
.lg-min-h-0 {
min-height: 0;
}
.lg-max-h-none {
max-height: none;
}
}
</style>
</head>
<body class="bg-gray-50 text-gray-800 font-sans min-h-screen flex flex-col">
<header class="bg-gradient-to-r from-primary to-blue-600 text-white shadow-lg">
<div class="container mx-auto px-6 py-6">
<div class="header-content">
<h1 class="text-[clamp(1.5rem,3vw,2.5rem)] font-bold mb-2">多项式拟合<span class="text-amber-300">sin(2πx)</span>演示</h1>
<p class="text-lg opacity-90">探索不同阶数多项式对目标函数的拟合效果,理解过拟合与欠拟合的动态变化</p>
</div>
</div>
</header>
<main class="flex-grow container mx-auto px-4 py-6">
<div class="grid grid-cols-1 lg:grid-cols-5 gap-4">
<!-- 控制面板 -->
<div class="lg:col-span-3 space-y-4">
<div class="bg-white rounded-xl shadow-card p-4 card-padding">
<h2 class="text-lg font-semibold mb-3 flex items-center">
<i class="fa fa-sliders text-primary mr-2"></i>
模型参数
</h2>
<div class="space-y-3">
<div>
<label for="degree" class="block text-xs font-medium text-gray-700 mb-1">多项式阶数</label>
<div class="flex items-center">
<input type="range" id="degree" min="1" max="20" value="3"
class="w-full h-2 bg-gray-200 rounded-lg appearance-none cursor-pointer accent-primary">
<span id="degree-value" class="ml-2 text-xs font-medium min-w-[2rem] text-center">3</span>
</div>
</div>
<div>
<label for="sample-size" class="block text-xs font-medium text-gray-700 mb-1">样本数量</label>
<div class="flex items-center">
<input type="range" id="sample-size" min="5" max="100" value="20"
class="w-full h-2 bg-gray-200 rounded-lg appearance-none cursor-pointer accent-primary">
<span id="sample-size-value" class="ml-2 text-xs font-medium min-w-[2rem] text-center">20</span>
</div>
</div>
<div>
<label for="noise-level" class="block text-xs font-medium text-gray-700 mb-1">噪声水平</label>
<div class="flex items-center">
<input type="range" id="noise-level" min="0" max="0.5" step="0.01" value="0.1"
class="w-full h-2 bg-gray-200 rounded-lg appearance-none cursor-pointer accent-primary">
<span id="noise-level-value" class="ml-2 text-xs font-medium min-w-[2rem] text-center">0.10</span>
</div>
</div>
<div>
<label for="lambda" class="block text-xs font-medium text-gray-700 mb-1">正则化强度 (λ)</label>
<div class="flex items-center">
<input type="range" id="lambda" min="0" max="1" step="0.01" value="0"
class="w-full h-2 bg-gray-200 rounded-lg appearance-none cursor-pointer accent-primary">
<span id="lambda-value" class="ml-2 text-xs font-medium min-w-[2rem] text-center">0.00</span>
</div>
</div>
</div>
</div>
<div class="bg-white rounded-xl shadow-card p-4 card-padding">
<h2 class="text-lg font-semibold mb-3 flex items-center">
<i class="fa fa-bar-chart text-primary mr-2"></i>
模型性能
</h2>
<div class="space-y-3">
<div>
<div class="flex justify-between items-center mb-1">
<span class="text-xs font-medium text-gray-700">训练误差 (MSE)</span>
<span id="train-error" class="text-xs font-semibold text-primary">-</span>
</div>
<div class="w-full bg-gray-200 rounded-full h-2">
<div id="train-error-bar" class="bg-primary h-2 rounded-full" style="width: 0%"></div>
</div>
</div>
<div>
<div class="flex justify-between items-center mb-1">
<span class="text-xs font-medium text-gray-700">测试误差 (MSE)</span>
<span id="test-error" class="text-xs font-semibold text-danger">-</span>
</div>
<div class="w-full bg-gray-200 rounded-full h-2">
<div id="test-error-bar" class="bg-danger h-2 rounded-full" style="width: 0%"></div>
</div>
</div>
<div class="pt-1">
<h3 class="text-xs font-medium text-gray-700 mb-1">误差对比图</h3>
<div class="h-32">
<canvas id="error-chart"></canvas>
</div>
</div>
</div>
</div>
<div class="bg-white rounded-xl shadow-card p-4 card-padding flex flex-col">
<h2 class="text-lg font-semibold mb-3 flex items-center">
<i class="fa fa-info-circle text-primary mr-2"></i>
模型参数
</h2>
<div class="space-y-2 flex-grow">
<div id="model-params" class="text-xs text-gray-700">
<p class="italic text-gray-500 text-center">调整参数后点击"拟合模型"查看系数</p>
</div>
</div>
<button id="fit-button" class="mt-3 w-full bg-primary hover:bg-blue-700 text-white font-medium py-2 px-3 rounded-lg transition-all-300 flex items-center justify-center text-sm">
<i class="fa fa-refresh mr-2"></i> 拟合模型
</button>
</div>
</div>
<!-- 图表区域 -->
<div class="lg:col-span-2 space-y-4">
<div class="bg-white rounded-xl shadow-card p-4 card-padding">
<div class="flex justify-between items-center mb-3">
<h2 class="text-lg font-semibold flex items-center">
<i class="fa fa-line-chart text-primary mr-2"></i>
函数拟合可视化
</h2>
<div class="flex space-x-1">
<button id="toggle-grid" class="text-xs bg-gray-100 hover:bg-gray-200 text-gray-700 py-1 px-2 rounded transition-all-300">
<i class="fa fa-th"></i> 网格
</button>
<button id="toggle-legend" class="text-xs bg-gray-100 hover:bg-gray-200 text-gray-700 py-1 px-2 rounded transition-all-300">
<i class="fa fa-list-ul"></i> 图例
</button>
</div>
</div>
<div class="chart-container">
<canvas id="function-chart"></canvas>
</div>
</div>
<div class="bg-white rounded-xl shadow-card p-4 card-padding">
<h2 class="text-lg font-semibold mb-3 flex items-center">
<i class="fa fa-lightbulb-o text-primary mr-2"></i>
模型解释
</h2>
<div class="prose max-w-none text-xs">
<h3>多项式拟合原理</h3>
<p>多项式拟合使用 f(x) = w_0 + w_1x + w_2x^2 + \dots + w_nx^n 来近似目标函数 sin(2pi x) 。随着多项式阶数增加,模型复杂度提高,能够拟合更复杂的模式。</p>
<br><br>
<h3>欠拟合与过拟合</h3>
<ul class="list-disc pl-4 my-1">
<li><span class="text-danger font-medium">欠拟合</span>:当阶数过低时,模型无法捕捉数据的复杂模式,训练误差和测试误差都很高。</li>
<li><span class="text-danger font-medium">过拟合</span>:当阶数过高时,模型在训练数据上表现良好,但泛化能力差,测试误差显著高于训练误差。</li>
</ul>
<h3>正则化的作用</h3>
<p>通过调整正则化参数 lambda,可以控制模型复杂度。较大的 lambda 会惩罚高次项系数,防止过拟合,使模型更平滑。</p>
</div>
</div>
</div>
</div>
</main>
<footer class="bg-dark py-4 mt-6">
<!-- 仅保留背景色,移除所有内容 -->
</footer>
<script>
// DOM 元素
const degreeSlider = document.getElementById('degree');
const degreeValue = document.getElementById('degree-value');
const sampleSizeSlider = document.getElementById('sample-size');
const sampleSizeValue = document.getElementById('sample-size-value');
const noiseLevelSlider = document.getElementById('noise-level');
const noiseLevelValue = document.getElementById('noise-level-value');
const lambdaSlider = document.getElementById('lambda');
const lambdaValue = document.getElementById('lambda-value');
const fitButton = document.getElementById('fit-button');
const trainErrorElement = document.getElementById('train-error');
const testErrorElement = document.getElementById('test-error');
const trainErrorBar = document.getElementById('train-error-bar');
const testErrorBar = document.getElementById('test-error-bar');
const modelParamsElement = document.getElementById('model-params');
// 图表初始化
let functionChart, errorChart;
// 全局数据
let trainData = { x: [], y: [] };
let testData = { x: [], y: [] };
let modelParams = [];
let allErrors = { train: [], test: [], degrees: [] };
// 更新滑块显示值
degreeSlider.addEventListener('input', () => {
degreeValue.textContent = degreeSlider.value;
});
sampleSizeSlider.addEventListener('input', () => {
sampleSizeValue.textContent = sampleSizeSlider.value;
});
noiseLevelSlider.addEventListener('input', () => {
noiseLevelValue.textContent = parseFloat(noiseLevelSlider.value).toFixed(2);
});
lambdaSlider.addEventListener('input', () => {
lambdaValue.textContent = parseFloat(lambdaSlider.value).toFixed(2);
});
// 生成数据
function generateData(sampleSize, noiseLevel) {
const data = { x: [], y: [] };
for (let i = 0; i < sampleSize; i++) {
const x = Math.random(); // [0, 1)
const y = Math.sin(2 * Math.PI * x) +
noiseLevel * (2 * Math.random() - 1); // 添加噪声
data.x.push(x);
data.y.push(y);
}
return data;
}
// 生成多项式特征
function polynomialFeatures(x, degree) {
const features = [];
for (let i = 0; i <= degree; i++) {
features.push(Math.pow(x, i));
}
return features;
}
// 多项式回归模型
function polynomialRegression(x, y, degree, lambda) {
// 构建设计矩阵 X
const X = x.map(xi => polynomialFeatures(xi, degree));
// 构建对角矩阵 lambda*I
const lambdaI = Array(degree + 1).fill(0).map((_, i) => {
const row = Array(degree + 1).fill(0);
row[i] = i === 0 ? 0 : lambda; // 不对偏置项正则化
return row;
});
// 计算 (X^T·X + lambda·I)
const XTX = [];
for (let i = 0; i <= degree; i++) {
const row = [];
for (let j = 0; j <= degree; j++) {
let sum = 0;
for (let k = 0; k < X.length; k++) {
sum += X[k][i] * X[k][j];
}
row.push(sum + lambdaI[i][j]);
}
XTX.push(row);
}
// 计算 (X^T·X + lambda·I)^-1
const XTXInv = inverseMatrix(XTX);
// 计算 X^T·y
const XTy = [];
for (let i = 0; i <= degree; i++) {
let sum = 0;
for (let k = 0; k < X.length; k++) {
sum += X[k][i] * y[k];
}
XTy.push(sum);
}
// 计算权重 w = (X^T·X + lambda·I)^-1·X^T·y
const w = [];
for (let i = 0; i <= degree; i++) {
let sum = 0;
for (let j = 0; j <= degree; j++) {
sum += XTXInv[i][j] * XTy[j];
}
w.push(sum);
}
return w;
}
// 矩阵求逆 (简化版,适用于小矩阵)
function inverseMatrix(matrix) {
const n = matrix.length;
const augmented = [];
// 创建增广矩阵 [A|I]
for (let i = 0; i < n; i++) {
const row = [...matrix[i]];
for (let j = 0; j < n; j++) {
row.push(i === j ? 1 : 0);
}
augmented.push(row);
}
// 高斯-约旦消元法
for (let i = 0; i < n; i++) {
// 寻找主元
let maxRow = i;
for (let j = i + 1; j < n; j++) {
if (Math.abs(augmented[j][i]) > Math.abs(augmented[maxRow][i])) {
maxRow = j;
}
}
// 交换行
if (maxRow !== i) {
[augmented[i], augmented[maxRow]] = [augmented[maxRow], augmented[i]];
}
// 主元归一化
const pivot = augmented[i][i];
if (pivot === 0) {
throw new Error("矩阵不可逆");
}
for (let j = 0; j < 2 * n; j++) {
augmented[i][j] /= pivot;
}
// 消元
for (let k = 0; k < n; k++) {
if (k !== i) {
const factor = augmented[k][i];
for (let j = 0; j < 2 * n; j++) {
augmented[k][j] -= factor * augmented[i][j];
}
}
}
}
// 提取逆矩阵
const inverse = [];
for (let i = 0; i < n; i++) {
inverse.push(augmented[i].slice(n));
}
return inverse;
}
// 预测函数
function predict(x, w) {
const degree = w.length - 1;
let yPred = 0;
for (let i = 0; i <= degree; i++) {
yPred += w[i] * Math.pow(x, i);
}
return yPred;
}
// 计算均方误差
function calculateMSE(x, y, w) {
let mse = 0;
for (let i = 0; i < x.length; i++) {
const yPred = predict(x[i], w);
mse += Math.pow(y[i] - yPred, 2);
}
return mse / x.length;
}
// 初始化图表
function initCharts() {
// 函数拟合图表
const functionCtx = document.getElementById('function-chart').getContext('2d');
functionChart = new Chart(functionCtx, {
type: 'scatter',
data: {
datasets: [
{
label: '目标函数 sin(2πx)',
borderColor: '#3b82f6',
backgroundColor: 'rgba(59, 130, 246, 0.1)',
borderWidth: 2,
pointRadius: 0,
fill: false,
tension: 0.4,
showLine: true,
order: 2
},
{
label: '多项式拟合',
borderColor: '#10b981',
backgroundColor: 'rgba(16, 185, 129, 0.1)',
borderWidth: 2,
pointRadius: 0,
fill: false,
tension: 0,
showLine: true,
order: 1
},
{
label: '训练数据',
backgroundColor: '#ef4444',
borderColor: '#fff',
borderWidth: 1,
pointRadius: 4,
pointHoverRadius: 6,
order: 3
},
{
label: '测试数据',
backgroundColor: '#f59e0b',
borderColor: '#fff',
borderWidth: 1,
pointRadius: 4,
pointHoverRadius: 6,
order: 4
}
]
},
options: {
responsive: true,
maintainAspectRatio: false,
animation: {
duration: 500
},
scales: {
x: {
type: 'linear',
position: 'center',
title: {
display: true,
text: 'x'
},
grid: {
display: true,
color: 'rgba(0, 0, 0, 0.05)'
}
},
y: {
type: 'linear',
position: 'center',
title: {
display: true,
text: 'f(x)'
},
grid: {
display: true,
color: 'rgba(0, 0, 0, 0.05)'
},
min: -1.5,
max: 1.5
}
},
plugins: {
legend: {
position: 'top',
labels: {
usePointStyle: true,
boxWidth: 6
}
},
tooltip: {
mode: 'index',
intersect: false,
callbacks: {
label: function(context) {
const label = context.dataset.label || '';
const x = context.parsed.x.toFixed(4);
const y = context.parsed.y.toFixed(4);
return `${label}: (${x}, ${y})`;
}
}
}
}
}
});
// 误差对比图表
const errorCtx = document.getElementById('error-chart').getContext('2d');
errorChart = new Chart(errorCtx, {
type: 'line',
data: {
labels: [],
datasets: [
{
label: '训练误差',
data: [],
borderColor: '#3b82f6',
backgroundColor: 'rgba(59, 130, 246, 0.1)',
borderWidth: 2,
pointRadius: 3,
pointBackgroundColor: '#3b82f6',
tension: 0.1
},
{
label: '测试误差',
data: [],
borderColor: '#ef4444',
backgroundColor: 'rgba(239, 68, 68, 0.1)',
borderWidth: 2,
pointRadius: 3,
pointBackgroundColor: '#ef4444',
tension: 0.1
}
]
},
options: {
responsive: true,
maintainAspectRatio: false,
animation: {
duration: 500
},
scales: {
x: {
type: 'linear',
position: 'bottom',
title: {
display: true,
text: '多项式阶数'
},
grid: {
display: true,
color: 'rgba(0, 0, 0, 0.05)'
}
},
y: {
type: 'logarithmic',
position: 'left',
title: {
display: true,
text: '均方误差 (MSE)'
},
grid: {
display: true,
color: 'rgba(0, 0, 0, 0.05)'
}
}
},
plugins: {
legend: {
position: 'top',
labels: {
usePointStyle: true,
boxWidth: 6
}
},
tooltip: {
mode: 'index',
intersect: false,
callbacks: {
label: function(context) {
const label = context.dataset.label || '';
const value = context.parsed.y.toFixed(6);
return `${label}: ${value}`;
}
}
}
}
}
});
}
// 更新函数图表
function updateFunctionChart(degree) {
// 生成目标函数数据
const targetX = [];
const targetY = [];
for (let i = 0; i <= 1000; i++) {
const x = i / 1000;
targetX.push(x);
targetY.push(Math.sin(2 * Math.PI * x));
}
// 生成拟合曲线数据
const fitX = [];
const fitY = [];
for (let i = 0; i <= 1000; i++) {
const x = i / 1000;
fitX.push(x);
fitY.push(predict(x, modelParams));
}
// 准备训练数据点
const trainPoints = trainData.x.map((x, i) => ({
x: x,
y: trainData.y[i]
}));
// 准备测试数据点
const testPoints = testData.x.map((x, i) => ({
x: x,
y: testData.y[i]
}));
// 更新图表数据
functionChart.data.datasets[0].data = targetX.map((x, i) => ({ x, y: targetY[i] }));
functionChart.data.datasets[1].data = fitX.map((x, i) => ({ x, y: fitY[i] }));
functionChart.data.datasets[2].data = trainPoints;
functionChart.data.datasets[3].data = testPoints;
// 更新图表标题
functionChart.options.plugins.title = {
display: true,
text: `多项式阶数: ${degree}`
};
functionChart.update();
}
// 更新误差图表
function updateErrorChart() {
errorChart.data.labels = allErrors.degrees;
errorChart.data.datasets[0].data = allErrors.train;
errorChart.data.datasets[1].data = allErrors.test;
errorChart.update();
}
// 更新参数显示
function updateParamsDisplay() {
if (modelParams.length === 0) {
modelParamsElement.innerHTML = '<p class="italic text-gray-500 text-center">调整参数后点击"拟合模型"查看系数</p>';
return;
}
let html = '<div class="space-y-1">';
html += `<p class="text-xs font-medium text-gray-600">多项式: f(x) = ${modelParams[0].toFixed(4)}`;
for (let i = 1; i < modelParams.length; i++) {
const sign = modelParams[i] >= 0 ? '+' : '-';
const absValue = Math.abs(modelParams[i]).toFixed(4);
html += ` ${sign} ${absValue}x${i > 1 ? `<sup>${i}</sup>` : ''}`;
}
html += '</p>';
// 显示每个参数
html += '<div class="grid grid-cols-1 sm:grid-cols-2 gap-1">';
modelParams.forEach((param, index) => {
const isSignificant = Math.abs(param) > 1e-6;
const colorClass = isSignificant ? 'text-gray-800' : 'text-gray-400';
html += `
<div class="flex justify-between items-center px-1 py-0.5 rounded ${index % 2 === 0 ? 'bg-gray-50' : ''}">
<span class="text-[10px] ${colorClass}">w<sub>${index}</sub></span>
<span class="text-[10px] font-mono ${colorClass}">${param.toExponential(4)}</span>
</div>
`;
});
html += '</div></div>';
modelParamsElement.innerHTML = html;
}
// 拟合模型并更新可视化
function fitModel() {
const degree = parseInt(degreeSlider.value);
const sampleSize = parseInt(sampleSizeSlider.value);
const noiseLevel = parseFloat(noiseLevelSlider.value);
const lambda = parseFloat(lambdaSlider.value);
// 生成训练和测试数据
trainData = generateData(sampleSize, noiseLevel);
testData = generateData(sampleSize, noiseLevel);
// 训练模型
try {
modelParams = polynomialRegression(trainData.x, trainData.y, degree, lambda);
// 计算误差
const trainError = calculateMSE(trainData.x, trainData.y, modelParams);
const testError = calculateMSE(testData.x, testData.y, modelParams);
// 更新误差显示
trainErrorElement.textContent = trainError.toFixed(6);
testErrorElement.textContent = testError.toFixed(6);
// 更新误差条
const maxError = Math.max(trainError, testError, 0.01);
trainErrorBar.style.width = `${(trainError / maxError) * 100}%`;
testErrorBar.style.width = `${(testError / maxError) * 100}%`;
// 更新误差图表数据
const degreeIndex = allErrors.degrees.indexOf(degree);
if (degreeIndex !== -1) {
allErrors.train[degreeIndex] = trainError;
allErrors.test[degreeIndex] = testError;
} else {
allErrors.degrees.push(degree);
allErrors.train.push(trainError);
allErrors.test.push(testError);
// 按阶数排序
const sortedData = allErrors.degrees.map((d, i) => ({
degree: d,
train: allErrors.train[i],
test: allErrors.test[i]
})).sort((a, b) => a.degree - b.degree);
allErrors.degrees = sortedData.map(d => d.degree);
allErrors.train = sortedData.map(d => d.train);
allErrors.test = sortedData.map(d => d.test);
}
// 更新图表
updateFunctionChart(degree);
updateErrorChart();
updateParamsDisplay();
// 添加动画效果
fitButton.classList.add('bg-green-600');
setTimeout(() => {
fitButton.classList.remove('bg-green-600');
}, 300);
} catch (error) {
console.error("拟合模型时出错:", error);
alert(`拟合模型时出错: ${error.message}`);
}
}
// 切换网格显示
document.getElementById('toggle-grid').addEventListener('click', () => {
const gridDisplay = !functionChart.options.scales.x.grid.display;
functionChart.options.scales.x.grid.display = gridDisplay;
functionChart.options.scales.y.grid.display = gridDisplay;
functionChart.update();
});
// 切换图例显示
document.getElementById('toggle-legend').addEventListener('click', () => {
const legendDisplay = !functionChart.options.plugins.legend.display;
functionChart.options.plugins.legend.display = legendDisplay;
functionChart.update();
});
// 初始化
window.addEventListener('DOMContentLoaded', () => {
initCharts();
fitButton.addEventListener('click', fitModel);
// 默认执行一次拟合
fitModel();
});
</script>
</body>
</html> 使用流程

交互效果图(多项式阶数分别取1、4、9、20,其余参数默认)

1.3
人工神经网络是深度学习中大部分网络的基础,在深度学习的发展中起到了关键作用。
而ANN其中的反向传播算法是人工神经网络训练过程中的关键技术之一。
它主要用于计算神经网络中误差对各个神经元连接权重的梯度,从而实现对权重的调整,以最小化损失函数。

在正向传播过程中,输入数据从输入层经过隐藏层逐步传递到输出层,得到预测结果。然后,通过比较预测结果与真实标签计算出误差。

在反向传播阶段,误差从输出层开始,沿着网络反向传播,依次计算每一层的误差项,并根据这些误差项来更新各层的权重。通过不断地重复正向传播和反向传播过程,神经网络能够逐渐调整权重,使模型的预测结果越来越接近真实值,从而达到训练模型的目的。