作者:来自 Elastic Jeffrey Rengifo 及 Tomás Murúa
使用 LLM 处理图像并将其转换为 Kibana 仪表板。
想获得 Elastic 认证?了解下一次 Elasticsearch Engineer 培训的举办时间!
Elasticsearch 拥有众多新功能,帮助你为你的使用场景构建最佳搜索解决方案。深入我们的示例笔记本了解更多,立即开始免费云试用,或在本地机器上尝试 Elastic。
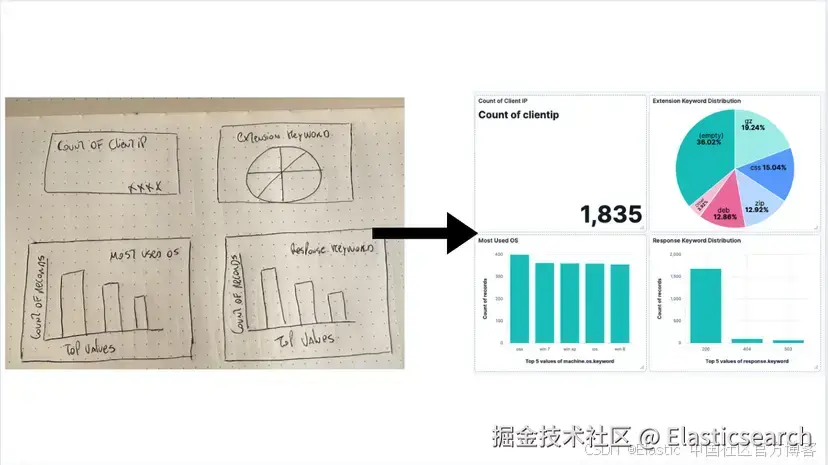
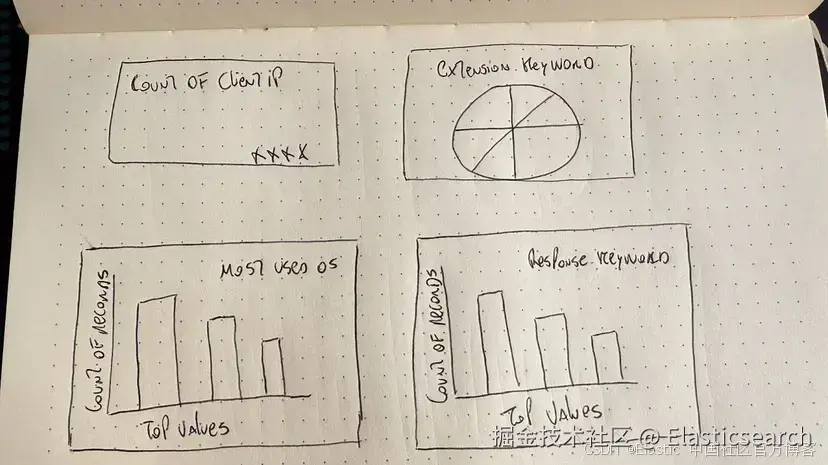
Kibana Lens 使仪表板创建变得拖放简单,但当你需要几十个面板时,点击次数会累积。如果你可以画一个仪表板草图,截图,然后让 LLM 为你完成整个过程,会怎么样?
在这篇文章中,我们将实现这个目标。我们将创建一个应用程序,接受仪表板图像,分析我们的映射,然后生成一个仪表板,无需我们手动操作 Kibana!
步骤:
- 背景与应用工作流程
- 准备数据
- LLM 配置
- 应用功能
背景与应用工作流程
第一个想法是让 LLM 生成整个 NDJSON 格式的 Kibana 保存对象,然后将其导入到 Kibana。
我们尝试了以下模型:
- Gemini 2.5 pro
- GPT o3 / o4-mini-high / 4.1
- Claude 4 sonnet
- Grok 3
- Deepseek ( Deepthink R1 )
至于提示词,我们从最简单的开始:
sql
You are an Elasticsearch Saved-Object generator (Kibana 9.0).INPUTS=====1. PNG screenshot of a 4-panel dashboard (attached).2. Index mapping (below) -- trimmed down to only the fields present in the screenshot.3. Example NDJSON of *one* metric visualization (below) for reference. TASK====Return **only** a valid NDJSON array that recreates the dashboard exactly:* 2 metric panels (Visits, Unique Visitors)* 1 pie chart (Most used OS)* 1 vertical bar chart (State Geo Dest)* Use index pattern `kibana_sample_data_logs`.* Preserve roughly the same layout (2×2 grid).* Use `panelIndex` values 1-4 and random `id` strings.* Kibana version: 9.0尽管我们尝试了少样本示例和关于如何构建每个可视化的详细说明,但没有成功。如果你对这个实验感兴趣,可以在这里找到详细信息。
使用这种方法的结果是,在尝试将 LLM 生成的文件上传到 Kibana 时,看到以下消息:
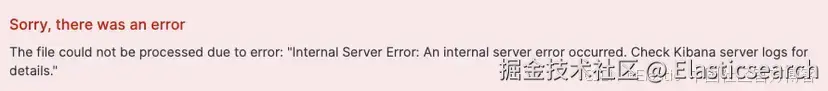
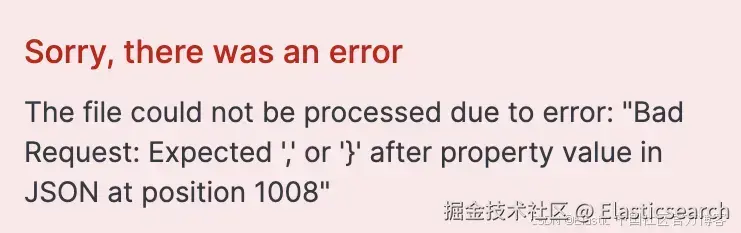
这意味着生成的 JSON 无效或格式错误。最常见的问题是 LLM 生成了不完整的 NDJSON、虚构参数,或者无论我们如何强制要求,都返回常规 JSON 而不是 NDJSON。
受这篇文章的启发 ------ 其中搜索模板比 LLM 自由生成效果更好------我们决定为 LLM 提供模板,而不是要求它生成完整的 NDJSON 文件,然后我们在代码中使用 LLM 提供的参数来创建正确的可视化。这种方法没有让人失望,而且是可预测和可扩展的,因为现在代码承担了主要工作,而不是 LLM。
应用工作流程如下:
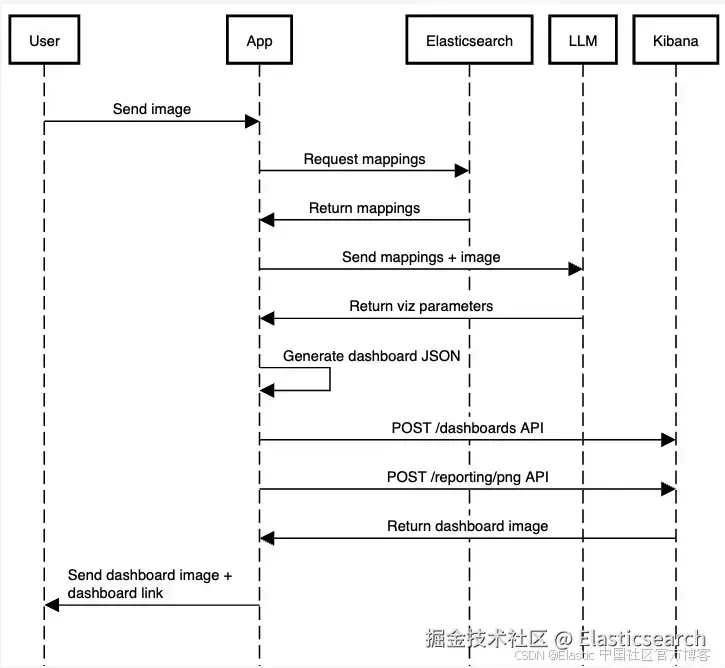
我们将为了简化省略一些代码,但你可以在这个笔记本中找到完整应用的有效代码。
前提条件
在开始开发之前,你需要以下内容:
- Python 3.8 或更高版本
- 一个 Venv Python 环境
- 一个运行中的 Elasticsearch 实例,以及其端点和 API 密钥
- 一个存储在环境变量名 OPENAI_API_KEY 下的 OpenAI API 密钥:
ini
export OPENAI_API_KEY="your-openai-api-key"准备数据
对于数据,我们将保持简单,使用 Elastic 样本 Web 日志。你可以在这里了解如何将这些数据导入到你的集群。
每个文档包括发出应用程序请求的主机的详细信息,以及请求本身及其响应状态的信息。以下是一个示例文档:
sql
{ "agent": "Mozilla/5.0 (X11; Linux i686) AppleWebKit/534.24 (KHTML, like Gecko) Chrome/11.0.696.50 Safari/534.24", "bytes": 8509, "clientip": "70.133.115.149", "extension": "css", "geo": { "srcdest": "US:IT", "src": "US", "dest": "IT", "coordinates": { "lat": 38.05134111, "lon": -103.5106908 } }, "host": "cdn.elastic-elastic-elastic.org", "index": "kibana_sample_data_logs", "ip": "70.133.115.149", "machine": { "ram": 5368709120, "os": "osx" }, "memory": null, "message": "70.133.115.149 - - [2018-08-30T23:35:31.492Z] \"GET /styles/semantic-ui.css HTTP/1.1\" 200 8509 \"-\" \"Mozilla/5.0 (X11; Linux i686) AppleWebKit/534.24 (KHTML, like Gecko) Chrome/11.0.696.50 Safari/534.24\"", "phpmemory": null, "referer": "http://twitter.com/error/john-phillips", "request": "/styles/semantic-ui.css", "response": 200, "tags": [ "success", "info" ], "@timestamp": "2025-07-03T23:35:31.492Z", "url": "https://cdn.elastic-elastic-elastic.org/styles/semantic-ui.css", "utc_time": "2025-07-03T23:35:31.492Z", "event": { "dataset": "sample_web_logs" }, "bytes_gauge": 8509, "bytes_counter": 51201128}现在,让我们获取刚刚加载的索引 kibana_sample_data_logs 的映射:
less
INDEX_NAME = "kibana_sample_data_logs" es_client = Elasticsearch( [os.getenv("ELASTICSEARCH_URL")], api_key=os.getenv("ELASTICSEARCH_API_KEY"),) result = es_client.indices.get_mapping(index=INDEX_NAME)index_mappings = result[list(result.keys())[0]]["mappings"]["properties"]我们将把映射与稍后加载的图像一起传递。
LLM 配置
让我们配置 LLM 使用结构化输出,以输入图像并接收我们需要传递给函数的 JSON,以生成 JSON 对象。
我们安装依赖项:
css
pip install elasticsearch pydantic langchain langchain-openai -qElasticsearch 会帮助我们获取索引映射。Pydantic 允许我们在 Python 中定义 schema,以便要求 LLM 遵循这个结构,而 LangChain 是一个框架,可以更方便地调用 LLMs 和 AI 工具。
我们将创建一个 Pydantic schema 来定义我们希望从 LLM 得到的输出内容。我们需要从图像中识别的信息包括:图表类型、字段、可视化标题,以及仪表板标题:
python
class Visualization(BaseModel): title: str = Field(description="The dashboard title") type: List[Literal["pie", "bar", "metric"]] field: str = Field( description="The field that this visualization use based on the provided mappings" ) class Dashboard(BaseModel): title: str = Field(description="The dashboard title") visualizations: List[Visualization]请上传你刚画的仪表板图片,我会根据图像内容提取图表类型、字段、可视化标题和仪表板标题。
现在我们声明 LLM 模型调用和图像加载。这个函数将接收 Elasticsearch 索引的 mappings 和我们想要生成的仪表板图像。
通过使用 with_structured_output,我们可以将 Pydantic 的 Dashboard schema 作为 LLM 生成的响应对象。使用 Pydantic,我们可以定义带有验证的数据模型,确保 LLM 输出符合预期结构。
要将图像转换为 base64 并作为输入发送,可以使用在线转换工具,或通过代码实现。
ini
prompt = f""" You are an expert in analyzing Kibana dashboards from images for the version 9.0.0 of Kibana. You will be given a dashboard image and an Elasticsearch index mapping. Below are the index mappings for the index that the dashboard is based on. Use this to help you understand the data and the fields that are available. Index Mappings: {index_mappings} Only include the fields that are relevant for each visualization, based on what is visible in the image. """ message = [ { "role": "user", "content": [ {"type": "text", "text": prompt}, { "type": "image", "source_type": "base64", "data": image_base64, "mime_type": "image/png", }, ], }] try: llm = init_chat_model("gpt-4.1-mini") llm = llm.with_structured_output(Dashboard) dashboard_values = llm.invoke(message) print("Dashboard values generated by the LLM successfully") print(dashboard_values)except Exception as e: print(f"Failed to analyze image and match fields: {str(e)}")LLM 已经具备关于 Kibana 仪表板的上下文,因此我们不需要在提示词中解释所有内容,只需添加一些细节,以确保它不会忘记当前处理的是 Elasticsearch 和 Kibana。
让我们来拆解这个提示词:
Section
Reason
You are an expert in analyzing Kibana dashboards from images for the version 9.0.0 of Kibana.
通过强调这是 Elasticsearch 以及指定 Elasticsearch 的版本,可以降低 LLM 产生旧的或无效参数的可能性。
You will be given a dashboard image and an Elasticsearch index mapping.
我们说明图像是关于仪表板的,以避免 LLM 产生错误的解读。
Below are the index mappings for the index that the dashboard is based on.Use this to help you understand the data and the fields that are available. Index Mappings: {index_mappings}
提供 mappings 至关重要,这样 LLM 才能动态选择有效字段。否则我们只能在这里写死 mappings,太死板,或者依赖图像中包含正确的字段名,但这种方式不可靠。
Only include the fields that are relevant for each visualization, based on what is visible in the image.
我们必须添加这个强化说明,因为有时它会尝试添加与图像无关的字段。
这将返回一个包含可显示可视化数组的对象:
arduino
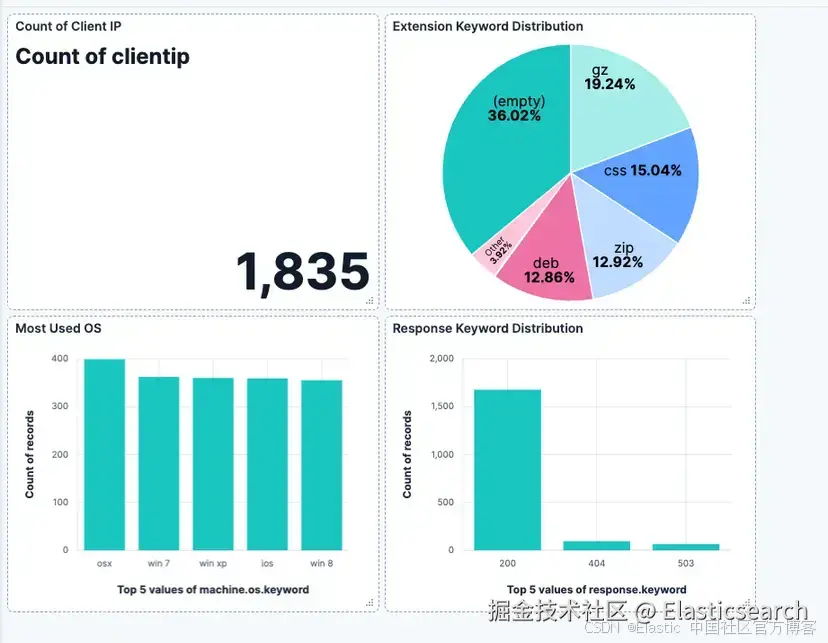
"Dashboard values generated by the LLM successfullytitle=""Client, Extension, OS, and Response Keyword Analysis""visualizations="[ "Visualization(title=""Count of Client IP", "type="[ "metric" ], "field=""clientip"")", "Visualization(title=""Extension Keyword Distribution", "type="[ "pie" ], "field=""extension.keyword"")", "Visualization(title=""Most Used OS", "type="[ "bar" ], "field=""machine.os.keyword"")", "Visualization(title=""Response Keyword Distribution", "type="[ "bar" ], "field=""response.keyword"")"]处理 LLM 响应
我们创建了一个示例的 2x2 面板仪表板,然后使用 Get a dashboard API 导出为 JSON,再将面板存储为可视化模板(饼图、条形图、指标),可以根据问题替换部分参数以创建不同字段的新可视化。
你可以在这里看到模板 JSON 文件。注意我们如何用 {variable_name} 替换想要后续替换的对象值。
根据 LLM 提供的信息,我们可以决定使用哪个模板以及替换哪些值。
fill_template_with_analysis 函数将接收单个面板的参数,包括可视化的 JSON 模板、标题、字段,以及可视化在网格上的坐标。
然后,它会替换模板中的值,返回最终的 JSON 可视化结果。
python
def fill_template_with_analysis( template: Dict[str, Any], visualization: Visualization, grid_data: Dict[str, Any],): template_str = json.dumps(template) replacements = { "{visualization_id}": str(uuid.uuid4()), "{title}": visualization.title, "{x}": grid_data["x"], "{y}": grid_data["y"], } if visualization.field: replacements["{field}"] = visualization.field for placeholder, value in replacements.items(): template_str = template_str.replace(placeholder, str(value)) return json.loads(template_str)为了简化,我们会使用固定坐标分配给 LLM 决定创建的面板,生成如上图所示的 2x2 网格仪表板。
css
# Filling templates fieldspanels = [] grid_data = [ {"x": 0, "y": 0}, {"x": 12, "y": 0}, {"x": 0, "y": 12}, {"x": 12, "y": 12},] i = 0 for vis in dashboard_values.visualizations: for vis_type in vis.type: template = templates.get(vis_type, templates.get("bar", {})) filled_panel = fill_template_with_analysis(template, vis, grid_data[i]) panels.append(filled_panel) i += 1根据 LLM 决定的可视化类型,我们会选择对应的 JSON 模板文件,使用 fill_template_with_analysis 替换相关信息,然后将新面板添加到数组,稍后用来创建仪表板。
当仪表板准备好后,我们会使用 Create a dashboard API 将新的 JSON 文件推送到 Kibana,生成仪表板:
vbscript
try: dashboard_id = str(uuid.uuid4()) # post request to create the dashboard endpoint url = f"{os.getenv('KIBANA_URL')}/api/dashboards/dashboard/{dashboard_id}" dashboard_config = { "attributes": { "title": dashboard_values.title, "description": "Generated by AI", "timeRestore": True, "panels": panels, # Visualizations with the values generated by the LLM "timeFrom": "now-7d/d", "timeTo": "now", }, } headers = { "Content-Type": "application/json", "kbn-xsrf": "true", "Authorization": f"ApiKey {os.getenv('ELASTICSEARCH_API_KEY')}", } requests.post( url, headers=headers, json=dashboard_config, ) # Url to the generated dashboard dashboard_url = f"{os.getenv('KIBANA_URL')}/app/dashboards#/view/{dashboard_id}" print("Dashboard URL: ", dashboard_url) print("Dashboard ID: ", dashboard_id) except Exception as e: print(f"Failed to create dashboard: {str(e)}")要执行脚本并生成仪表板,请在控制台运行以下命令:
xml
python <file_name>.py最终结果将如下所示:
Dashboard URL: https://your-kibana-url/app/dashboards#/view/generated-dashboard-id
Dashboard ID: generated-dashboard-id
结论
LLM 在文本转代码或将图像转为代码时展现出强大的视觉能力。仪表板 API 也使得将 JSON 文件转换为仪表板成为可能,结合 LLM 和一些代码,我们可以将图像转成 Kibana 仪表板。
下一步是通过使用不同的网格设置、仪表板尺寸和位置,提升仪表板视觉的灵活性。同时,支持更复杂的可视化和更多类型的可视化,将是该应用的有益补充。
原文:AI-powered dashboards: From a vision to Kibana - Elasticsearch Labs
 Elastic搜索 Elastic 是专注搜索的公司。