1、Prometheus抓取Java应用的指标
1、数据来源:Java应用自身暴露的指标
Java应用的指标数据来源于应用代码中定义的指标对象(如Counter、Gauge、Histogram等),通过Prometheus客户端库(如io.prometheus:client_java)将这些指标注册到默认的CollectorRegistry,并通过HTTP服务器暴露/metrics端点。
简单来说:
在你的java应用程序中引入Prometheus相关的jar包(即Prometheus的客户端),在进行适当的配置即可。Prometheus server端会主动从你的服务中获取java应用的相关指标。
2、实现步骤
1、Java端示例
(1)、引入依赖
在pom.xml中添加Prometheus客户端库依赖。
pom.xml示例:
java
<dependency>
    <groupId>io.prometheus</groupId>
    <artifactId>simpleclient</artifactId>
    <version>0.16.0</version>
</dependency>
<dependency>
    <groupId>io.prometheus</groupId>
    <artifactId>simpleclient_httpserver</artifactId>
    <version>0.16.0</version>
</dependency>
(2)、定义和注册指标
在Java代码中定义你需要监控的指标(如Counter计算器、Gauge仪表盘等),并注册到CollectorRegistry收集器中。
java示例:
java
import io.prometheus.client.Counter;
import io.prometheus.client.Gauge;
import io.prometheus.client.exporter.HTTPServer;
import java.io.IOException;

public class MyApplication {
    // 定义一个Counter指标:记录HTTP请求次数
    static final Counter requests = Counter.build()
        .name("http_requests_total")
        .help("Total number of HTTP requests.")
        .labelNames("method", "status")
        .register();

    // 定义一个Gauge指标:记录当前在线用户数
    static final Gauge onlineUsers = Gauge.build()
        .name("online_users")
        .help("Current number of online users.")
        .register();

    public static void main(String[] args) throws IOException {
        // 启动HTTP服务器,暴露/metrics端点(默认端口8080)
        HTTPServer server = new HTTPServer(8080);

        // 模拟业务逻辑:增加Counter和Gauge的值
        requests.labels("GET", "200").inc();
        onlineUsers.inc(); // 用户上线
        onlineUsers.dec(); // 用户下线
    }
}
(3)、验证指标暴露
启动应用后,访问http://localhost:8080/metrics,会看到类似以下输出。
输出示例:
java
# HELP http_requests_total Total number of HTTP requests.
# TYPE http_requests_total counter
http_requests_total{method="GET",status="200"} 1

# HELP online_users Current number of online users.
# TYPE online_users gauge
online_users 0
2、Prometheus Server端示例
(1)、Prometheus server配置抓取java客户端指标
在prometheus.yml中配置Prometheus Server抓取该指标。
yaml示例:
java
scrape_configs:
  - job_name: "java-app"
    static_configs:
      - targets: ["localhost:8080"]
2、Redis中间件的指标获取
1、数据来源:Redis本身暴露的指标
Redis本身不直接支持Prometheus格式的指标,因此需要通过Redis Exporter来采集Redis的指标(如内存使用、连接数、命中率等),并转换为Prometheus格式。
简单来说:
采集中间件相关的指标数据需要借助特定的Exporter组件。如Mysql有Mysql Exporter;Redis有Redis Exporter等。
- 以Redis为例,我们部署Redis Exporter,并指定监测的Redis服务。
- Redis Exporter会检测和获取到相关Redis实例的指标,如:调用Redis的Info命令。
- Prometheus Server会调用Redis Exporter的接口间接获取到Redis实例的指标数据。
常见的Exporter:
- 对Redis:使用redis_exporter
- 对MySQL:使用mysqld_exporter
- 对服务器环境:使用node_exporter
Exporter的作用:
- 连接目标系统(如连接Redis实例)
- 获取原始指标数据(如 Redis 的 INFO命令输出)
- 将这些数据格式化为 Prometheus 能识别的格式
- 暴露一个/metrics接口供Prometheus抓取
2、实现步骤
1、Redis Exporter部分示例
(1)、部署Redis Exporter
可以通过Docker或二进制方式部署Redis Exporter。
bash示例:
java
# 使用Docker部署
docker run -d \
  --name redis-exporter \
  -p 9121:9121 \
  -e REDIS_ADDR=redis-host:6379 \
  quay.io/prometheuscommunity/redis-exporter
(2)、验证指标暴露
访问http://localhost:9121/metrics,会看到Redis的指标数据。
输出示例:
java
# HELP redis_connected_clients Number of client connections (excluding connections from slaves).
# TYPE redis_connected_clients gauge
redis_connected_clients 10

# HELP redis_memory_used_bytes Total number of bytes allocated by Redis using its allocator.
# TYPE redis_memory_used_bytes gauge
redis_memory_used_bytes 1048576
2、Prometheus Server端示例
(1)、Prometheus配置抓取
在prometheus.yml中配置抓取Redis Exporter的指标。
yaml示例:
java
scrape_configs:
  - job_name: "redis"
    static_configs:
      - targets: ["localhost:9121"]
附:常见Redis指标
- redis_connected_clients:当前连接的客户端数量。
- redis_memory_used_bytes:Redis使用的内存字节数。
- redis_keyspace_hits:缓存命中次数。
- redis_keyspace_misses:缓存未命中次数。
3、服务器运行环境的指标获取
1、数据来源:服务器操作系统指标
服务器环境指标(如CPU、内存、磁盘I/O)需要通过Node Exporter来采集,它会读取/proc文件系统或调用系统命令获取数据。
简单来说:
在需要检测指标的服务器上部署Node Exporter组件。该组件会通过相关Linux命令获取到机器的指标。之后Prometheus Serve调用Node Exporter的接口,间接获取到了服务器的相关指标数据。
2、实现步骤
(1)、安装Node Exporter
下载并启动 Node Exporter。
bash示例:
java
# 下载
wget https://github.com/prometheus/node_exporter/releases/latest/download/node_exporter-*.linux-amd64.tar.gz
# 解压
tar xvfz node_exporter-*.linux-amd64.tar.gz
# 进入指定目录
cd node_exporter-*.linux-amd64
# 启动(默认端口9100)
./node_exporter
(2)、验证指标暴露
访问http://localhost:9100/metrics,会看到服务器的指标数据。
输出示例:
java
# HELP node_cpu_seconds_total Seconds the CPUs spent in each mode.
# TYPE node_cpu_seconds_total counter
node_cpu_seconds_total{mode="idle",device="cpu0"} 12345.67

# HELP node_memory_MemFree_bytes Free memory in bytes.
# TYPE node_memory_MemFree_bytes gauge
node_memory_MemFree_bytes 1073741824
(3)、Prometheus配置抓取
在prometheus.yml中配置抓取Node Exporter的指标。
yaml示例:
java
scrape_configs:
  - job_name: "node"
    static_configs:
      - targets: ["localhost:9100"]
附:常见服务器指标
- node_cpu_seconds_total:CPU使用时间(按模式分组)。
- node_memory_MemFree_bytes:空闲内存大小。
- node_disk_io_time_seconds_total:磁盘I/O时间。
- node_network_receive_bytes_total:网络接收字节数。
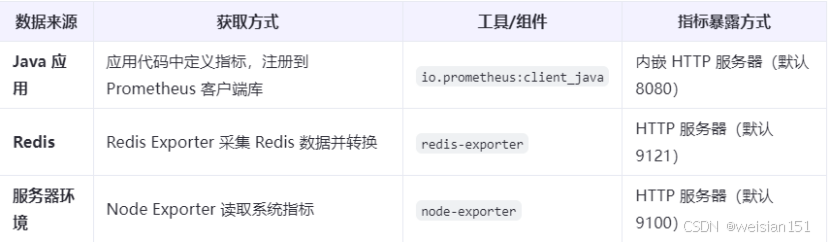
4、总结:三类指标的获取流程
5、验证和调试
1、检查指标是否暴露
- 使用curl或浏览器访问/metrics端点。
bash示例:
java
curl http://localhost:8080/metrics2、Prometheus界面验证
- 登录Prometheus Web UI(默认http://localhost:9090)。
- 输入指标名称(如http_requests_total)进行查询。
3、Grafana可视化
- 安装Grafana,配置Prometheus数据源。
- 导入预定义的Dashboard(如Node Exporter Full、Redis Exporter)。
通过以上步骤,你可以将Java应用、Redis中间件和服务器环境的指标集成到Prometheus监控体系中,并通过Grafana可视化展示。
向阳前行,Dare To Be!!!