最近有个需求,需要使用自然资源部的中国地势图作为底图绘制地图,不是墨卡托投影,没搞过这种投影,emmm~头大!
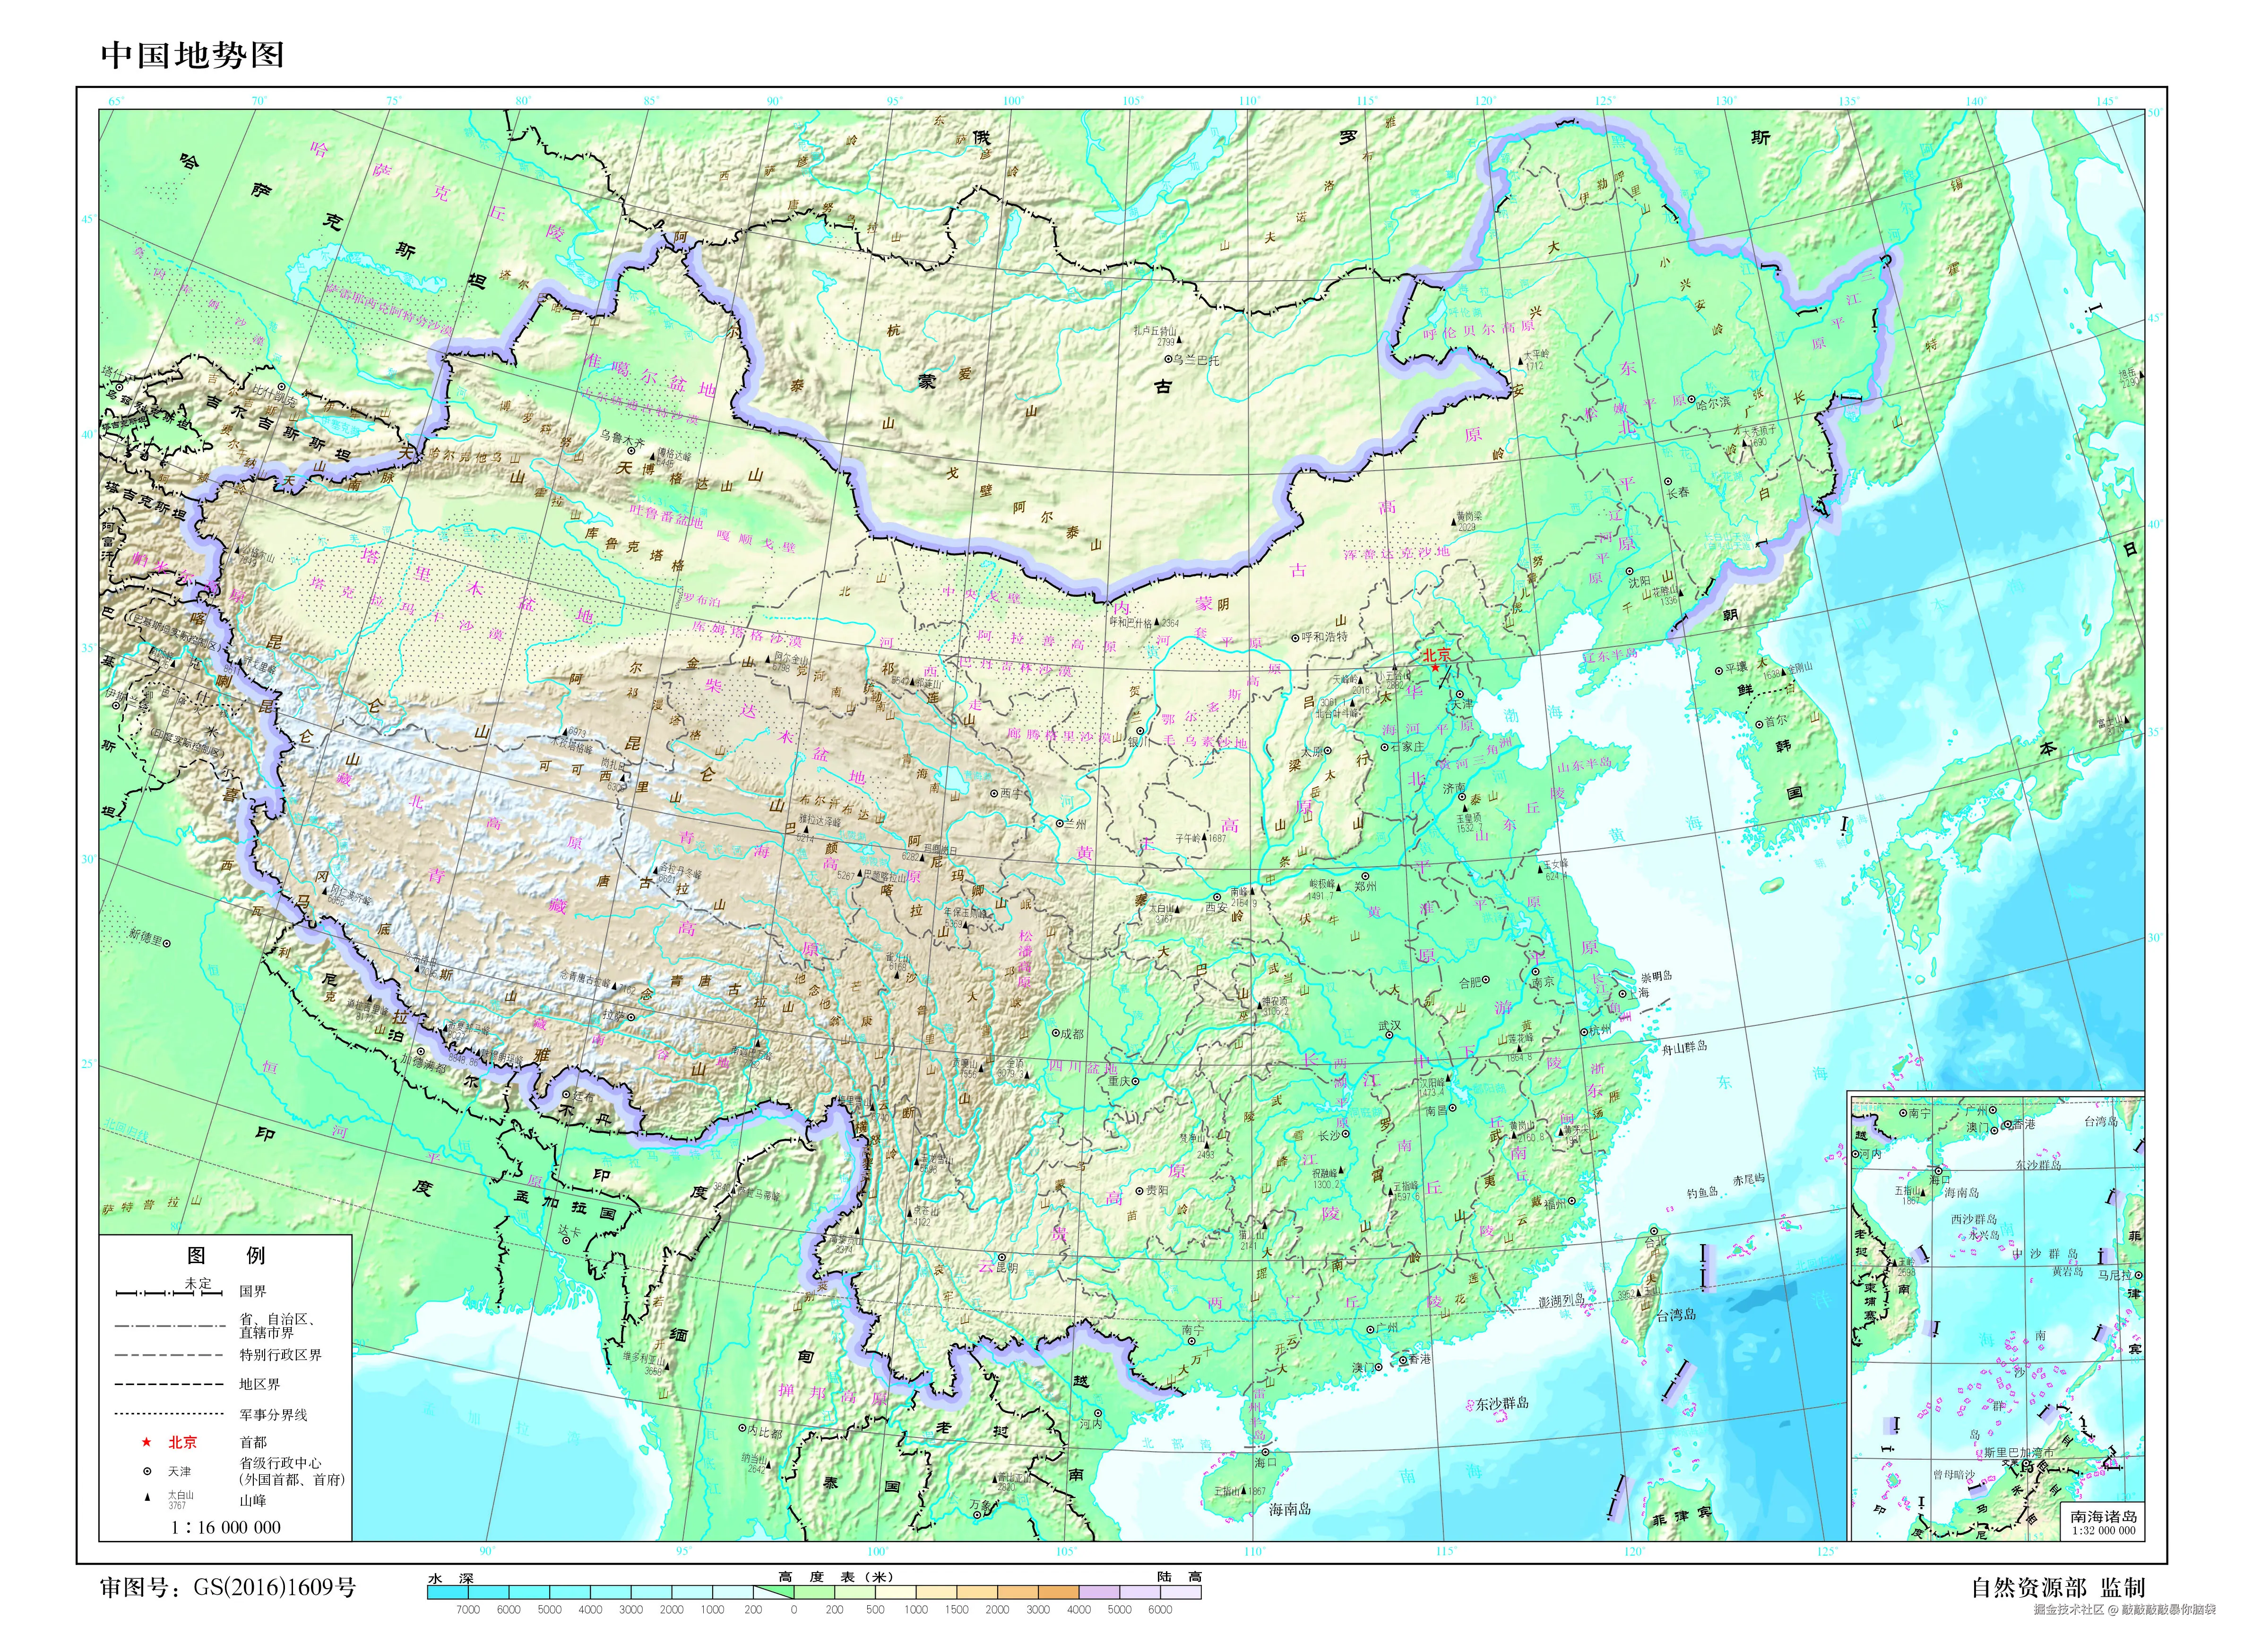
找了一圈资料,了解到该图使用了兰伯特等角圆锥投影,有个标准,那可以研究研究!
1. 兰伯特等角圆锥投影
兰勃特投影是由德国数学家兰勃特(J.H.Lambert)拟定的正形圆锥投影。有两种:
- 等角圆锥投影。设想用一个正圆锥切于或割于球面,应用等角条件将地球面投影到圆锥面上,然后沿一母线展开成平面。投影后纬线为同心圆圆弧,经线为同心圆半径。没有角度变形,经线长度比和纬线长度比相等。适于制作沿纬线分布的中纬度地区中、小比例尺地图。国际上用此投影编制1∶100万地形图和航空图;
- 等积方位投影。设想球面与平面切于一点,按等积条件将经纬线投影于平面而成。
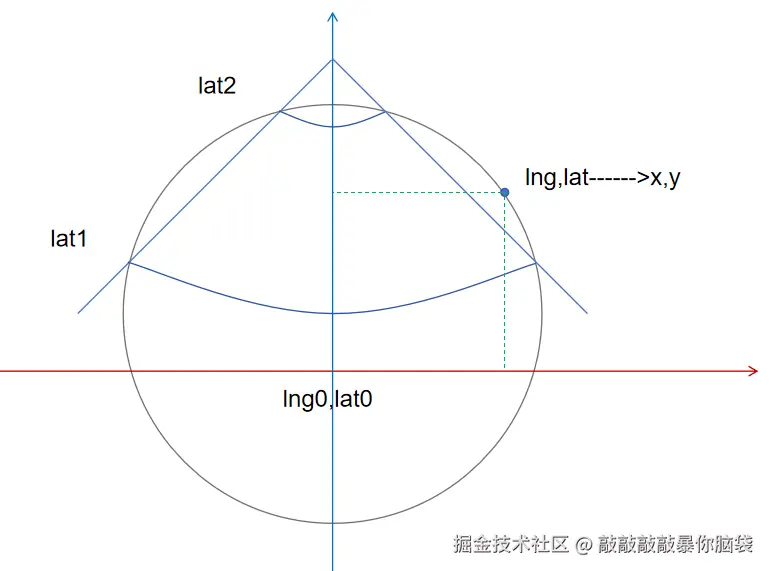
常用的兰伯特等角圆锥投影,简单来说
- 以
lat1,lat2作为切割线,该线旋转一圈,变成一个圆锥体斜表面 - 取
lng0,lat0作为原点,展开圆锥斜面,做二维坐标系 - 取球体上某个点
lng,lat,转换为该二维坐标系的x,y坐标点
2. 使用proj4.js实现地图投影
proj4.js用于将点坐标从一个坐标系转换到另一个坐标系统,包括基准转换。官网:http://proj4js.org/
proj4.js源于PROJ,参数一致,可以参考PROJ的官网 https://proj.org/en/stable/
- 安装
proj4.js
sh
pnpm add proj4- 参数配置,可以通过epsg.io搜索常用的地图投影标准。
我们常用的球面墨卡托投影Spherical Mercator对应编号EPSG:3857
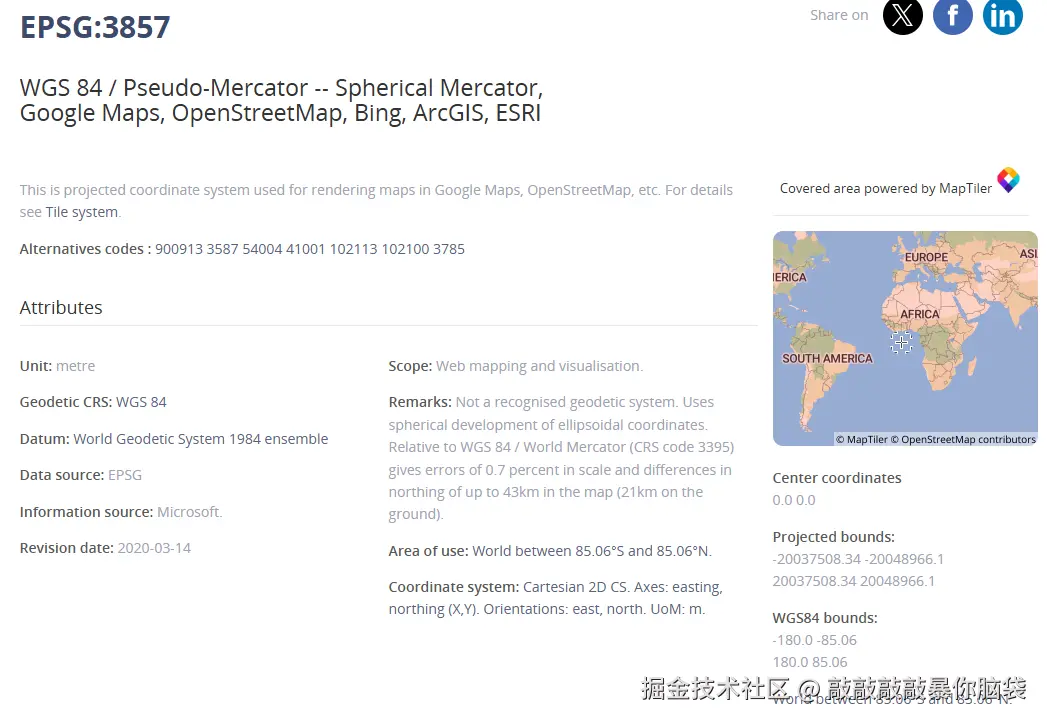
EPSG:3857的投影参数设置
js
proj4.defs("EPSG:3857","+proj=merc +a=6378137 +b=6378137 +lat_ts=0 +lon_0=0 +x_0=0 +y_0=0 +k=1 +units=m +nadgrids=@null +wktext +no_defs +type=crs");proj4.defs(投影名称,投影参数)定义投影+proj=merc投影类型为merc墨卡托投影,可设置参数可以通过PROJ搜索
+lat_ts=0:真实比例的纬度。定义比例不扭曲的纬度。默认为0.0+lon_0=0:投影中心的经度。默认为0.0+x_0=0:偏移x,单位米。默认为0.0+y_0=0:偏移y,单位米。默认为0.0+a=6378137 +b=6378137: 椭球长半径和短半径,单位米。
使用定义的投影
ts
//将经纬度转换为对应投影坐标
proj4(projection).forward([lng,lat])

proj4('EPSG:3857').forward([116,39])
//[12913060.932019735,4721671.572580107]

//将投影坐标转换为经纬度
proj4(projection).inverse([12913060.932019735,4721671.572580107]);
//[116.00000000000001, 38.999999999999986]
投影坐标与经纬度相互转换有些许偏差是正常的,不必介意。
3. 定义兰伯特投影
+lat_1=<value>第一条纬线纬度+lat_2=<value>第一条纬线纬度+lat_0=<value>原点纬度+lon_0=<value>原点经度
使用epsg.io搜索中国兰伯特投影,结果只有中国南海的兰伯特投影
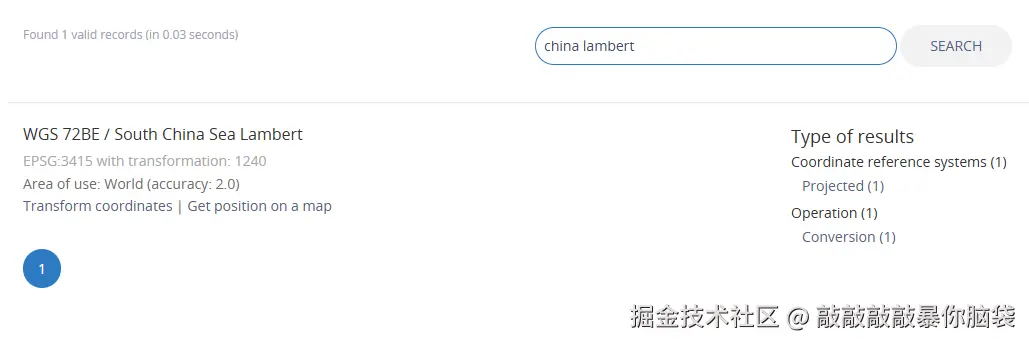
虽然参数配置可能对不上,但是可以作为参考
js
proj4.defs("EPSG:3415","+proj=lcc +lat_0=21 +lon_0=114 +lat_1=18 +lat_2=24 +x_0=500000 +y_0=500000 +ellps=WGS72 +towgs84=0,0,1.9,0,0,0.814,-0.38 +units=m +no_defs +type=crs");从别人的博客中了解到中国兰伯特投影参数(China Lambert)
- 第一条纬线:
25度 - 第二条纬线:
47度 - 投影原点:
经度105,纬度0
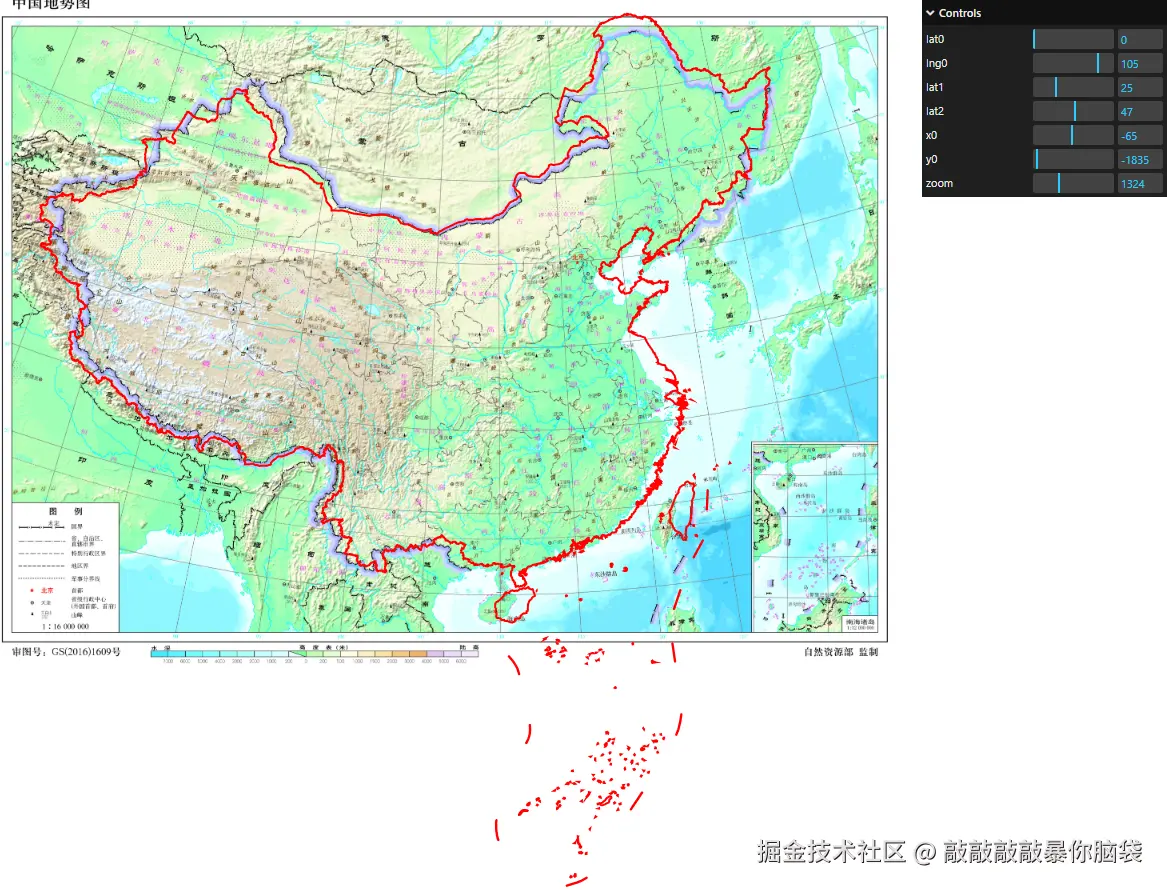
校验投影参数
用Canvas绘制底图和中国边界,调整参数,两者边界尽量重叠。
ts
drawGeo() {
    const image = this.image!;
    const data = this.data;
    const canvas = this.canvas;
    const ctx = this.ctx;

    proj4.defs(
      this.projection,
      `+proj=lcc +lat_0=${data.lat0} +lon_0=${data.lng0} +lat_1=${data.lat1} +lat_2=${data.lat2} +x_0=${
        data.x0 * 1000
      } +y_0=${data.y0 * 1000} +ellps=WGS72 +towgs84=0,0,1.9,0,0,0.814,-0.38 +units=m +no_defs +type=crs`
    );

    ctx.clearRect(0, 0, canvas.width, canvas.height);
    //绘制底图
    ctx.drawImage(image, 0, 0, this.imageWidth * this.scaleVal, this.imageHeight * this.scaleVal);
    ctx.strokeStyle = 'red';
    ctx.lineWidth = 2;
    //中国边界
    travelGeo(ChinaJson, (path: Array<[number, number]>) => {
      ctx.beginPath();
      const p0 = this.lnglat2px(path[0]);
      ctx.moveTo(p0[0], p0[1]);
      for (let i = 1; i < path.length; i++) {
        const p = this.lnglat2px(path[i]);
        ctx.lineTo(p[0], p[1]);
      }
      ctx.closePath();
      ctx.stroke();
    });
  }
经纬度转投影坐标
ts
lnglat2px(a: [number, number]) {
    const xy = proj4(this.projection)
      .forward(a)
      .map((t) => t / this.data.zoom);

    return [this.scaleVal * (xy[0] + this.imageWidth * 0.5), this.scaleVal * (this.imageHeight - xy[1])];
}使用lil-gui修改参数并重绘
ts
  gui() {
    createGui(
      [
        {
          //原点纬度
          name: 'lat0',
          type: 'number',
          min: 0,
          max: 30,
          step: 0.1,
          onChange: this.drawGeo.bind(this)
        },
        {
          //原点经度
          name: 'lng0',
          type: 'number',
          min: 40,
          max: 120,
          step: 0.1,
          onChange: this.drawGeo.bind(this)
        },
        {
          //第一条纬线纬度
          name: 'lat1',
          type: 'number',
          min: 0,
          max: 90,
          step: 0.1,
          onChange: this.drawGeo.bind(this)
        },
        {
          //第二条纬线纬度
          name: 'lat2',
          type: 'number',
          min: 0,
          max: 90,
          step: 0.1,
          onChange: this.drawGeo.bind(this)
        },
        {
          //左偏移量
          name: 'x0',
          type: 'number',
          min: -2000,
          max: 2000,
          step: 1,
          onChange: this.drawGeo.bind(this)
        },
        {
          //上偏移量
          name: 'y0',
          type: 'number',
          min: -2000,
          max: 2000,
          step: 1,
          onChange: this.drawGeo.bind(this)
        },
        {
          //缩放等级
          name: 'zoom',
          type: 'number',
          min: 1000,
          max: 2000,
          step: 1,
          onChange: this.drawGeo.bind(this)
        }
      ],
      this.data
    );
  }
按照此中国兰伯特投影参数已经尽量调整了,边界之间还是存在较大的偏差,决定放弃此参数配置,自己定义!
ts
{
    lat0: 0,
    lng0: 105,
    lat1: 25,
    lat2: 47,
    x0: -65,
    y0: -1835,
    zoom: 1324
  }
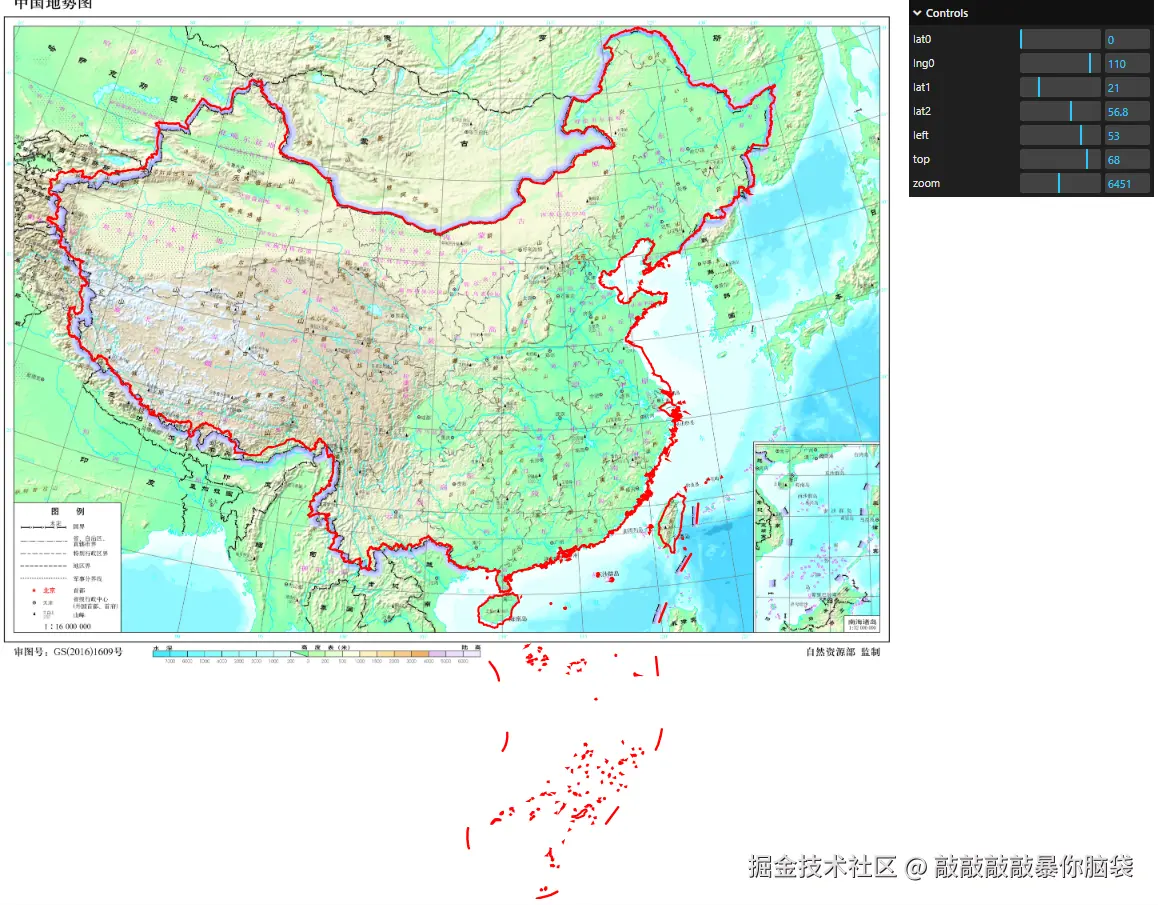
最终一点点修改后,得到一个最符合的兰伯特投影参数设置。
ts
{
    lat0: 0,
    lng0: 110,
    lat1: 21,
    lat2: 56.8,
    x0: 350,
    y0: -1835,
    zoom: 1300
  }
4. 用canvas绘制地图
4.1 封装中国地势图兰伯特投影
根据缩放大小,中国地势图图片大小来计算经纬度与像素坐标之间的转换。
ts
class ChinaLambertProj {
  projection = 'China Lambert';
  //兰伯特投影参数
  data = {
    lat0: 0,
    lng0: 110,
    lat1: 21,
    lat2: 56.8,
    x0: 350,
    y0: -1835,
    zoom: 1300
  };
  //中国地势图图片宽高
  imageWidth = 100;
  imageHeight = 100;
  //缩放比例
  scaleVal = 0.2;
  constructor() {
    const data = this.data;
    proj4.defs(
      this.projection,
      `+proj=lcc +lat_0=${data.lat0} +lon_0=${data.lng0} +lat_1=${data.lat1} +lat_2=${data.lat2} +x_0=${
        data.x0 * 1000
      } +y_0=${data.y0 * 1000} +ellps=WGS72 +towgs84=0,0,1.9,0,0,0.814,-0.38 +units=m +no_defs +type=crs`
    );
  }
  //设置缩放比例
  setScale(v: number) {
    this.scaleVal = v;
  }
  //经纬度转像素
  lnglat2px(a: LngLatXY) {
    const xy = proj4(this.projection)
      .forward(a)
      .map((t) => t / this.data.zoom);

    return [this.scaleVal * (xy[0] + this.imageWidth * 0.5), this.scaleVal * (this.imageHeight - xy[1])];
  }
  //像素转经纬度
  px2lnglat(a: LngLatXY) {
    const p = [
      (a[0] / this.scaleVal - this.imageWidth * 0.5) * this.data.zoom,
      (this.imageHeight - a[1] / this.scaleVal) * this.data.zoom
    ];
    return proj4(this.projection).inverse(p);
  }
  //设置图片大小
  setImageSize(w: number, h: number) {
    this.imageWidth = w;
    this.imageHeight = h;
  }
}
4.2 绘制底图
相比墨卡托投影的瓦片地图,这里只需直接使用ctx.drawImage根据底图缩放后的大小和移动位置绘制底图,十分方便
ts
  async drawLayer() {
    if (this.isDrawLayer) return;
    this.isDrawLayer = true;
    this.renderer.clear();
    const ctx = this.ctx;
    ctx.drawImage(
      this.image!,
      //地图移动的位置
      this.move.offsetX,
      this.move.offsetY,
      //缩放后底图宽高
      this.projection.imageWidth * this.projection.scaleVal,
      this.projection.imageHeight * this.projection.scaleVal
    );
    this.isDrawLayer = false;
    this.isFirst = false;
    //绘制形状
    this.drawShape();
    //绘制html
    this.renderHtml();
  }
4.5 设置视图
在canvas上的经纬度和像素坐标转换
ts
//经纬度转canvas上的像素坐标
  lnglat2Canvas(lnglat: LngLatXY): LngLatXY {
    const [x, y] = this.projection.lnglat2px(lnglat);
    return [x + this.move.offsetX, y + this.move.offsetY];
  }
  //canvas上的像素坐标转经纬度
  canvas2lnglat(xy: LngLatXY): LngLatXY {
    const p = this.projection.px2lnglat([xy[0] - this.move.offsetX, xy[1] - this.move.offsetY]);
    return p as LngLatXY;
  }
设置地图缩放大小和地图中心点位置
ts
  setZoom(z: number) {
    if (z >= this.minZoom && z <= this.maxZoom) {
      this.zoom = z;

      this.projection.setScale(z * 0.1);
      this.setCenter(this.center);
    }
  }
  setCenter(center: LngLatXY) {
    if (center[0] >= -180 && center[0] <= 180 && center && center[1] >= -90 && center[1] <= 90) {
      this.center = center;
      const pos = this.projection.lnglat2px(center);
      this.move.offsetX = -pos[0] + this.canvas.width * 0.5;
      this.move.offsetY = -pos[1] + this.canvas.height * 0.5;
      this.drawLayer();
    }
  }
4.3 移动地图和缩放地图
监听鼠标按下记录起始坐标,监听鼠标移动计算移动距离,监听鼠标放开计算新的地图中心位置和绘制更新底图。
ts
  onMouseDown(ev: MouseEvent) {
    this.move.enable = true;
    this.move.isMove = false;
    //鼠标开始位置
    this.move.startX = ev.pageX;
    this.move.startY = ev.pageY;
    //鼠标初始位置
    this.move.originX = ev.pageX;
    this.move.originY = ev.pageY;
  }
  onMouseMove(ev: MouseEvent) {
    if (this.move.enable) {
      //鼠标移动超过5px则为移动地图
      if (Math.abs(ev.pageX - this.move.originX) >= 5 || Math.abs(ev.pageY - this.move.originY) >= 5) {
        this.move.isMove = true;
      }
      //地图移动距离XY
      this.move.offsetX += ev.pageX - this.move.startX;
      this.move.offsetY += ev.pageY - this.move.startY;
      this.move.startX = ev.pageX;
      this.move.startY = ev.pageY;
    }
  }
  onMouseUp(ev: MouseEvent) {
    //移动地图
    if (this.move.enable && this.move.isMove) {
      //计算新的中心位置
      const newcenter = this.canvas2lnglat([this.canvas.width * 0.5, this.canvas.height * 0.5]);
      this.center = newcenter;
      this.drawLayer();
    } else {
      //点击地图
      this.clickMap(ev);
    }
    this.move.isMove = false;
    this.move.enable = false;
  }
监听滚轮动作,设置缩放大小
ts
onWheel(ev: WheelEvent) {
if (ev.deltaY > 0) {
//down
this.setZoom(this.zoom - this.zoomStep);
} else {
//up
this.setZoom(this.zoom + this.zoomStep);
}
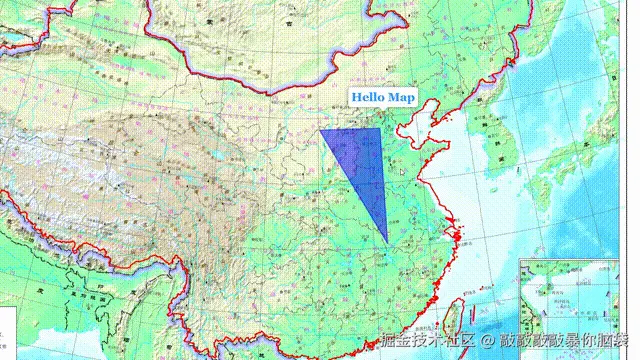
}4.4 添加形状和HTML
用canvas绘制形状,渲染HTML元素,监听这些元素的动作跟我之前的文从零开始用Canvas画一个2D地图一致。
ts
const resourcemap = new ResourceMap({
  container: document.getElementById('container')!,
  center: [116.407387, 39.904179],
  zoom: 2
});
resourcemap.init();
let index = 0;
//绘制中国边界
travelGeo(ChinaJson, (path: LngLatXY[], a: any) => {
  resourcemap.add({
    id: a.properties.name + ++index,
    type: 'Line',
    path: path,
    isClose: true,
    style: {
      lineColor: 'red',
      lineWidth: 3
    }
  });
});
//添加多边形
resourcemap.add({
  id: 'Polygon',
  type: 'Polygon',
  path: [
    [110, 39],
    [116, 39],
    [116, 30]
  ],
  style: {
    fillColor: 'blue',
    fillOpacity: 0.5,
    lineColor: 'blue',
    lineWidth: 3
  },
  isAction: true
});
//添加html
resourcemap.addHtml({
  type: 'html',
  content: `<div class="text-box"><div>Hello Map</div></div>`,
  pos: [116.3912757, 39.906217],
  id: 'textbox',
  isAction: true
});
//监听点击动作
resourcemap.events.on('click', ({ objs, lnglat, htmls }: any) => {
  console.log('click', objs, lnglat, htmls);
});
Github地址
https://github.com/xiaolidan00/demo-vite-ts
参考