1 基本情况
1.1 简介
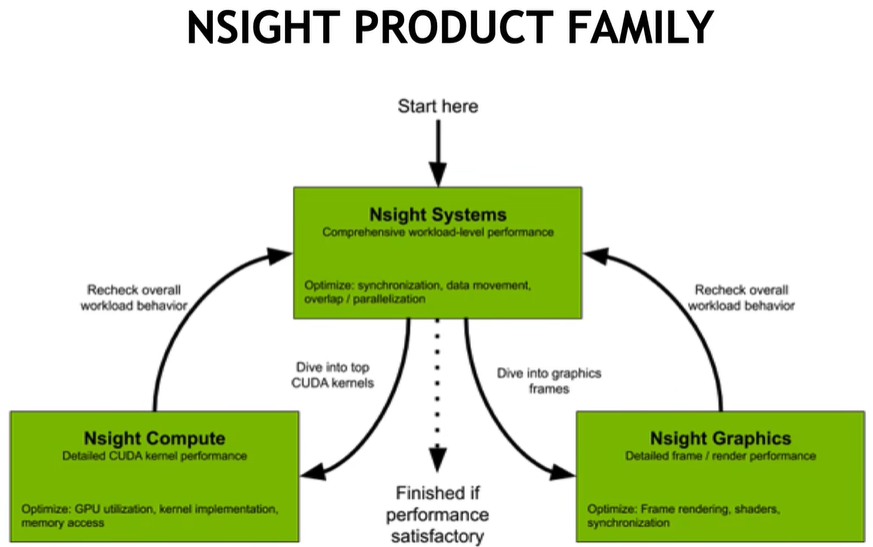
Nsight Systems(简称nsys)是NVIDIA推出的一款系统级性能分析工具,主要用于优化 GPU 加速应用程序(尤其是基于 CUDA、OpenCL、DirectX、Vulkan 等 API 开发的程序)的性能,帮助开发者定位和解决计算、内存、通信等环节的瓶颈。所谓系统层面的分析工具,除了分析GPU的使用,还要分析CPU的使用,以及CPU和GPU的交互情况,可以捕捉CPU和GPU的各种事件,发现CPU和GPU上的等待以及不必要的同步,可以通过Nsight systems将任务均匀的分配到CPU和GPU上。做为NVIDIA核心分析工具之一,它和Compute以及Graphics有各自的侧重点:
Nsight Systems: A system-wide performance analysis tool
Nsight Compute: An interactive kernel profiler for CUDA applications
Nsight Graphics: A standalone developer tool to debug, profile, and export frames built with Direct3D, Vulkan, OpenGL, OpenVR
下图给出了CUDA程序整理优化流程,对于Nsight Systems侧重点在CPU&GPU同步、数据拷贝以及处理重叠同步运行等方面,优化后再分别用Compute完成Kernel层或者用Graphics完成图像层优化,这之后再重新进行系统层分析及优化,不断迭代最终完成应用程序优化。
接下来用下面的图来初步了解下Nsight Systems的强大功能,图中matrix_mul_test是一个GPU程序,在它执行过程中ntoskernl.exe会以线程形式参与到内存管理和设备驱动交互等环节,红色、橙色、绿色分别表示CPU占用率、当前CPU核(不同颜色表示线程运行在不同CPU核上)、线程状态(不同颜色表示不同状态Running,Ready to run,Blocked),图中标记1处于Running状态,标记2处于Ready to run状态,这时可能是ntoskernl线程在当前CPU核上时间片运行结束,CPU核已经调度给其他线程,比如标记3表示的ToDesk程序的相应线程。
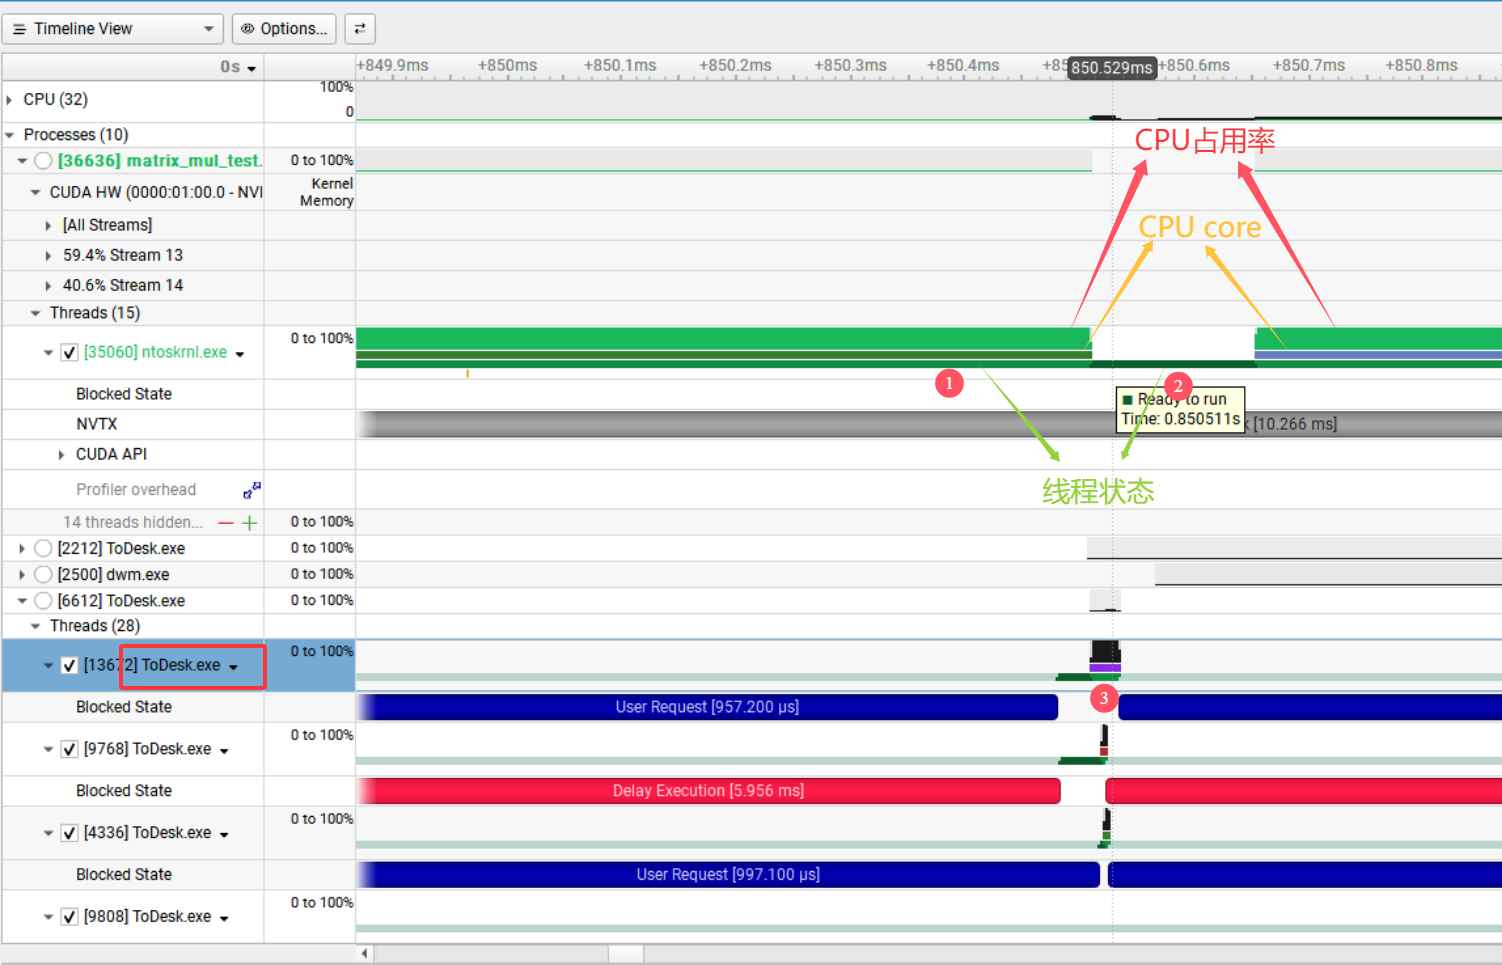
通过上图可以看到,借助Nsight Systems的图形显示可以直观方便的对GPU程序的运行过程进行分析。
1.2 安装
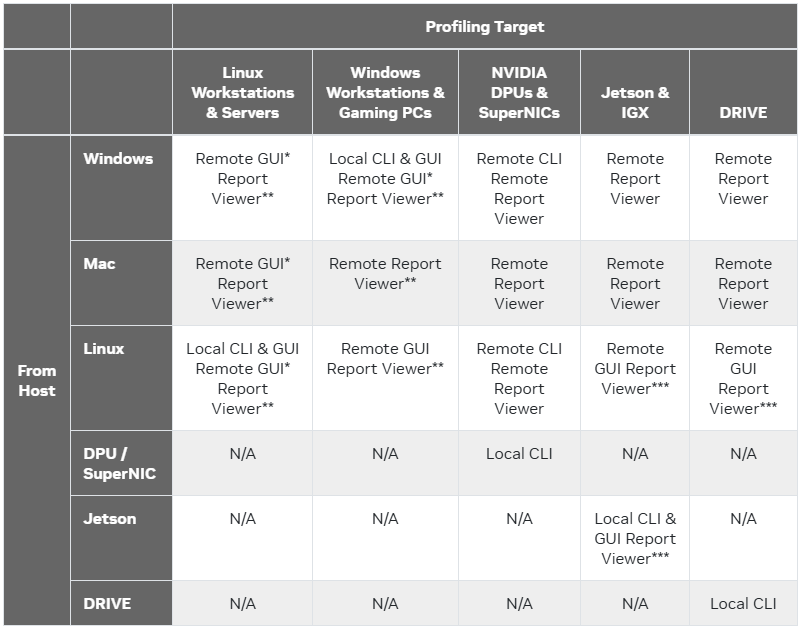
Nsight Systems是一款跨平台应用工具,根据主机平台的不同,它支持本地或远程Profiling目标程序,简单来说就是在Linxu和Windows下既支持本地分析有支持远程分析目标程序,对于Mac系统来说,只支持远程分析目标程序,以下是完整的支持列表:
不同平台的用户,可从最后参考1地址获得相应平台的安装程序,工具当前最新版本为2025.5.1。
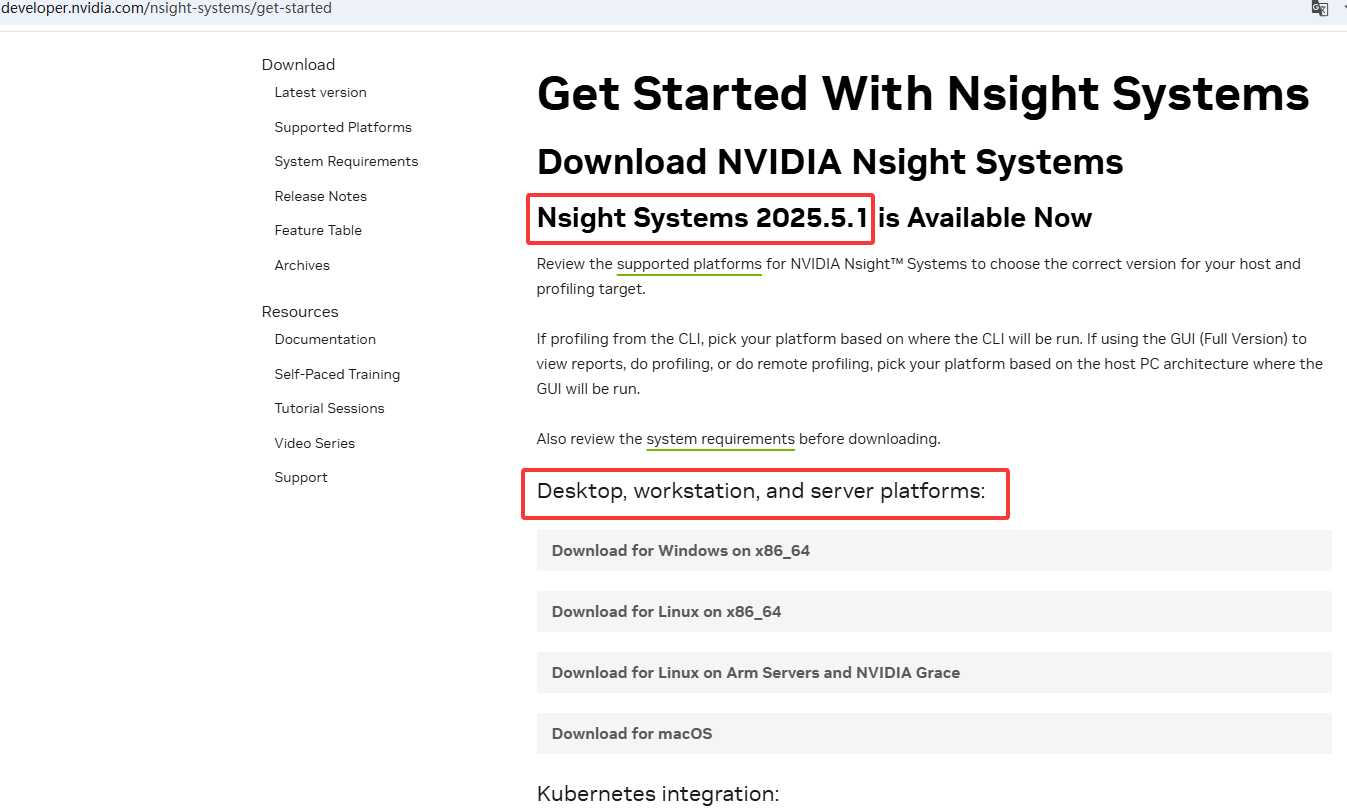
以Windows平台为例,下载以后直接安装NsightSystems-2025xxxxx.msi文件即可,另外如果之前安装toolkit,其实已经在在其中包含Nsight Systems,当然可能不是最新版本。其他平台看着请参考官网说明进行安装。
2 使用说明
2.1 图形界面
1. 创建工程
打开NsightSystems后,工具中默认会创建一个Project 1的工程,可以将该工程进行重命名,如改为HelloNsight,之后需要在右侧指定一个分析目标,工具支持多种方式的目标,以下进行详细解释:
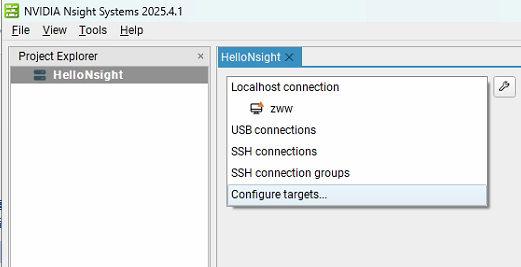
(1)Localhost connection
表示本地主机连接,即对运行 Nsight Systems 的本机进行性能分析、调试。可监测和分析本机上运行的程序,收集其性能数据,像 CPU、GPU 的使用情况,线程活动等。图图中 "zwv" 是已识别我的电脑名称。
(2)USB connections
指通过 USB 连接的调试目标。可用于分析连接到本机 USB 接口的设备上运行的程序性能,比如Jetson和Rive平台等,只要设备支持且正确配置,就能通过该连接进行性能数据采集。
(3)SSH connections
基于 SSH(Secure Shell)协议的远程连接。借助 SSH 安全通道,可连接到远程主机(如另一台服务器、开发机等),对远程主机上运行的程序进行性能分析和调试,方便管理不在本地的设备或集群环境中的程序性能。
(4)SSH connection groups
是 SSH 连接组,可将多个 SSH 连接进行分组管理。比如有多个远程服务器需要调试,可把它们的 SSH 连接归为一组,便于批量操作、统一管理和快速切换不同远程目标,提升对多远程环境调试的效率。
(5)Configure targets:
用于配置调试目标相关参数,比如添加新的调试目标、设置目标连接的认证信息(SSH 连接的用户名密码、密钥等 )、调整连接超时时间等,对调试目标进行个性化设置和管理,确保能正确连接、识别和调试各类目标设备或程序 。
这里以本地可执行程序vectorAdd.exe为例进行解析,该程序是NVIDIA官方提供cuda-samples中的示例程序,可以从官方Github主页上下载,主要功能就是计算两个数组之和,其源码如下:


  1 /* Copyright (c) 2022, NVIDIA CORPORATION. All rights reserved.
  2  *
  3  * Redistribution and use in source and binary forms, with or without
  4  * modification, are permitted provided that the following conditions
  5  * are met:
  6  *  * Redistributions of source code must retain the above copyright
  7  *    notice, this list of conditions and the following disclaimer.
  8  *  * Redistributions in binary form must reproduce the above copyright
  9  *    notice, this list of conditions and the following disclaimer in the
 10  *    documentation and/or other materials provided with the distribution.
 11  *  * Neither the name of NVIDIA CORPORATION nor the names of its
 12  *    contributors may be used to endorse or promote products derived
 13  *    from this software without specific prior written permission.
 14  *
 15  * THIS SOFTWARE IS PROVIDED BY THE COPYRIGHT HOLDERS ``AS IS'' AND ANY
 16  * EXPRESS OR IMPLIED WARRANTIES, INCLUDING, BUT NOT LIMITED TO, THE
 17  * IMPLIED WARRANTIES OF MERCHANTABILITY AND FITNESS FOR A PARTICULAR
 18  * PURPOSE ARE DISCLAIMED.  IN NO EVENT SHALL THE COPYRIGHT OWNER OR
 19  * CONTRIBUTORS BE LIABLE FOR ANY DIRECT, INDIRECT, INCIDENTAL, SPECIAL,
 20  * EXEMPLARY, OR CONSEQUENTIAL DAMAGES (INCLUDING, BUT NOT LIMITED TO,
 21  * PROCUREMENT OF SUBSTITUTE GOODS OR SERVICES; LOSS OF USE, DATA, OR
 22  * PROFITS; OR BUSINESS INTERRUPTION) HOWEVER CAUSED AND ON ANY THEORY
 23  * OF LIABILITY, WHETHER IN CONTRACT, STRICT LIABILITY, OR TORT
 24  * (INCLUDING NEGLIGENCE OR OTHERWISE) ARISING IN ANY WAY OUT OF THE USE
 25  * OF THIS SOFTWARE, EVEN IF ADVISED OF THE POSSIBILITY OF SUCH DAMAGE.
 26  */
 27
 28 /**
 29  * Vector addition: C = A + B.
 30  *
 31  * This sample is a very basic sample that implements element by element
 32  * vector addition. It is the same as the sample illustrating Chapter 2
 33  * of the programming guide with some additions like error checking.
 34  */
 35
 36 #include <stdio.h>
 37
 38 // For the CUDA runtime routines (prefixed with "cuda_")
 39 #include <cuda_runtime.h>
 40
 41 #include <helper_cuda.h>
 42 /**
 43  * CUDA Kernel Device code
 44  *
 45  * Computes the vector addition of A and B into C. The 3 vectors have the same
 46  * number of elements numElements.
 47  */
 48 __global__ void vectorAdd(const float *A, const float *B, float *C,
 49                           int numElements) {
 50   int i = blockDim.x * blockIdx.x + threadIdx.x;
 51
 52   if (i < numElements) {
 53     C[i] = A[i] + B[i] + 0.0f;
 54   }
 55 }
 56
 57 /**
 58  * Host main routine
 59  */
 60 int main(void) {
 61   // Error code to check return values for CUDA calls
 62   cudaError_t err = cudaSuccess;
 63
 64   // Print the vector length to be used, and compute its size
 65   int numElements = 50000;
 66   size_t size = numElements * sizeof(float);
 67   printf("[Vector addition of %d elements]\n", numElements);
 68
 69   // Allocate the host input vector A
 70   float *h_A = (float *)malloc(size);
 71
 72   // Allocate the host input vector B
 73   float *h_B = (float *)malloc(size);
 74
 75   // Allocate the host output vector C
 76   float *h_C = (float *)malloc(size);
 77
 78   // Verify that allocations succeeded
 79   if (h_A == NULL || h_B == NULL || h_C == NULL) {
 80     fprintf(stderr, "Failed to allocate host vectors!\n");
 81     exit(EXIT_FAILURE);
 82   }
 83
 84   // Initialize the host input vectors
 85   for (int i = 0; i < numElements; ++i) {
 86     h_A[i] = rand() / (float)RAND_MAX;
 87     h_B[i] = rand() / (float)RAND_MAX;
 88   }
 89
 90   // Allocate the device input vector A
 91   float *d_A = NULL;
 92   err = cudaMalloc((void **)&d_A, size);
 93
 94   if (err != cudaSuccess) {
 95     fprintf(stderr, "Failed to allocate device vector A (error code %s)!\n",
 96             cudaGetErrorString(err));
 97     exit(EXIT_FAILURE);
 98   }
 99
100   // Allocate the device input vector B
101   float *d_B = NULL;
102   err = cudaMalloc((void **)&d_B, size);
103
104   if (err != cudaSuccess) {
105     fprintf(stderr, "Failed to allocate device vector B (error code %s)!\n",
106             cudaGetErrorString(err));
107     exit(EXIT_FAILURE);
108   }
109
110   // Allocate the device output vector C
111   float *d_C = NULL;
112   err = cudaMalloc((void **)&d_C, size);
113
114   if (err != cudaSuccess) {
115     fprintf(stderr, "Failed to allocate device vector C (error code %s)!\n",
116             cudaGetErrorString(err));
117     exit(EXIT_FAILURE);
118   }
119
120   // Copy the host input vectors A and B in host memory to the device input
121   // vectors in
122   // device memory
123   printf("Copy input data from the host memory to the CUDA device\n");
124   err = cudaMemcpy(d_A, h_A, size, cudaMemcpyHostToDevice);
125
126   if (err != cudaSuccess) {
127     fprintf(stderr,
128             "Failed to copy vector A from host to device (error code %s)!\n",
129             cudaGetErrorString(err));
130     exit(EXIT_FAILURE);
131   }
132
133   err = cudaMemcpy(d_B, h_B, size, cudaMemcpyHostToDevice);
134
135   if (err != cudaSuccess) {
136     fprintf(stderr,
137             "Failed to copy vector B from host to device (error code %s)!\n",
138             cudaGetErrorString(err));
139     exit(EXIT_FAILURE);
140   }
141
142   // Launch the Vector Add CUDA Kernel
143   int threadsPerBlock = 256;
144   int blocksPerGrid = (numElements + threadsPerBlock - 1) / threadsPerBlock;
145   printf("CUDA kernel launch with %d blocks of %d threads\n", blocksPerGrid,
146          threadsPerBlock);
147   vectorAdd<<<blocksPerGrid, threadsPerBlock>>>(d_A, d_B, d_C, numElements);
148   err = cudaGetLastError();
149
150   if (err != cudaSuccess) {
151     fprintf(stderr, "Failed to launch vectorAdd kernel (error code %s)!\n",
152             cudaGetErrorString(err));
153     exit(EXIT_FAILURE);
154   }
155
156   // Copy the device result vector in device memory to the host result vector
157   // in host memory.
158   printf("Copy output data from the CUDA device to the host memory\n");
159   err = cudaMemcpy(h_C, d_C, size, cudaMemcpyDeviceToHost);
160
161   if (err != cudaSuccess) {
162     fprintf(stderr,
163             "Failed to copy vector C from device to host (error code %s)!\n",
164             cudaGetErrorString(err));
165     exit(EXIT_FAILURE);
166   }
167
168   // Verify that the result vector is correct
169   for (int i = 0; i < numElements; ++i) {
170     if (fabs(h_A[i] + h_B[i] - h_C[i]) > 1e-5) {
171       fprintf(stderr, "Result verification failed at element %d!\n", i);
172       exit(EXIT_FAILURE);
173     }
174   }
175
176   printf("Test PASSED\n");
177
178   // Free device global memory
179   err = cudaFree(d_A);
180
181   if (err != cudaSuccess) {
182     fprintf(stderr, "Failed to free device vector A (error code %s)!\n",
183             cudaGetErrorString(err));
184     exit(EXIT_FAILURE);
185   }
186
187   err = cudaFree(d_B);
188
189   if (err != cudaSuccess) {
190     fprintf(stderr, "Failed to free device vector B (error code %s)!\n",
191             cudaGetErrorString(err));
192     exit(EXIT_FAILURE);
193   }
194
195   err = cudaFree(d_C);
196
197   if (err != cudaSuccess) {
198     fprintf(stderr, "Failed to free device vector C (error code %s)!\n",
199             cudaGetErrorString(err));
200     exit(EXIT_FAILURE);
201   }
202
203   // Free host memory
204   free(h_A);
205   free(h_B);
206   free(h_C);
207
208   printf("Done\n");
209   return 0;
210 }配置待分析的可执行程序,以及设置相应的工作目录是进行分析的必选项,其他选项都是可以定制,如下所示:
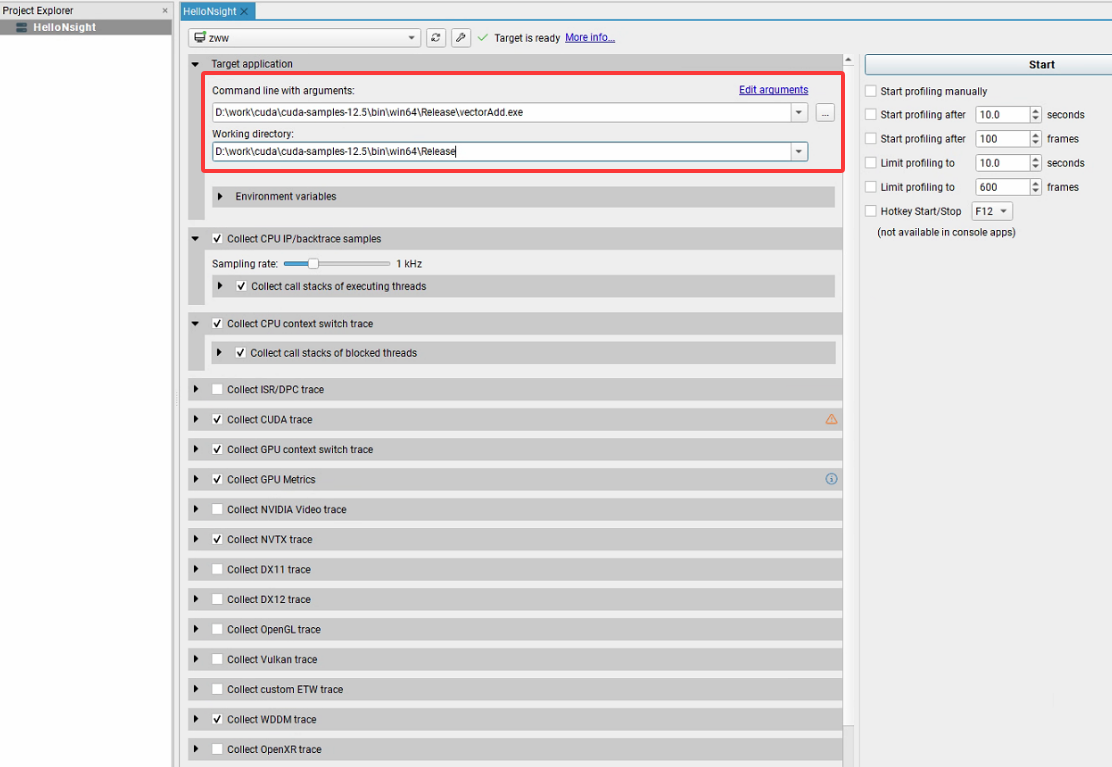
2. 配置采集项
上图中采集配置项主要可以分为6个方面:
(1)CPU相关采集项
- Collect CPU IP/backtrace samples(CPU 指令指针 / 回溯采样)
以设置的采样率(如 1kHz)记录 CPU 指令执行位置,结合调用栈,帮你定位程序耗时在哪些函数、代码段,分析 CPU 计算瓶颈。
**Sampling rate:**控制采样频率,频率越高数据越细但采集开销越大,按需平衡精度和性能。
**Collect call stacks of executing threads:**记录 "活跃线程" 的调用栈,明确 CPU 周期到底用在哪些函数调用里。
- Collect CPU context switch trace(CPU 上下文切换追踪)
记录线程在 CPU 核心间切换、阻塞 / 唤醒等事件,分析线程调度效率,排查因频繁切换导致的性能损耗。
**Collect call stacks of blocked threads:**记录 "阻塞线程" 的调用栈,找到线程等待资源(锁、IO 等)的原因,优化同步逻辑。
(2)异构计算相关采集(GPU及特定API)
- Collect CUDA trace
深度追踪 CUDA 调用(如核函数启动、内存分配),分析 GPU 任务调度、内存传输瓶颈,是 CUDA 程序性能优化核心配置。
**Flush data periodically:**定期将采集的CUDA追踪数据从内存刷写到磁盘/存储,避免因程序崩溃、异常退出导致采集数据丢失,例如10.00 seconds表示每10秒执行依次存盘操作。
**Flush CUDA trace buffers on cudaProfilerStop():**调用cudaProfilerStop() API时,强制将CUDA追踪缓冲区的数据存盘,
**Skip some API calls:**跳过部分低价值、高频次的CUDA API调用追踪,可以降低采集开销简化分析数据,让你更专注kernel launch、memory copy等关键操作。
**CUDA Event trace mode:**控制CUDA Event的追踪模式,Off表示关闭,如果开启,可追踪cudaEventRecord/cudaEventSynchronize等事件,分析GPU任务同步、耗时依赖。
**CUDA graph trace granularity:**设置CUDA Graph(任务图)的追踪粒度,如Graph(图级),Graph表示把整个CUDA Graph当作一个整体追踪,Node会细化到Graph内部的每个Node。
**Trace CUDA graphs launched from device codes:**追踪由设备端代码启动的CUDA Graphs。
**Collect GPU memory usage:**采集GPU内存的使用数据,配合核函数、内存传输的追踪,分析"内存占用"与"计算性能"的关联(如现存带宽瓶颈时,内存分配策略是否可优化)。
**Collect hardware-based trace:**启动硬件级追踪,采集更底层的硬件指标(如SM利用率、warp调度效率、指令吞吐率),适合深度优化核函数。
- Collect GPU context switch trace
追踪 GPU 上下文切换事件(如不同 CUDA 上下文切换),排查 GPU 资源竞争、调度延迟问题。
- Collect GPU Metrics
采集 GPU 硬件指标(如 SM 利用率、显存带宽),从硬件层面定位性能瓶颈,需 GPU 支持对应 metrics 采集。
- Collect NVTX trace
识别程序中通过 NVTX(NVIDIA 工具扩展)标记的自定义事件 / 区间,方便关联业务逻辑(如 "模型推理阶段""数据预处理"),分析各阶段耗时。
- Collect WDDM trace(Windows 环境)
采集 WDDM(Windows 显示驱动模型)相关事件,分析 GPU 与系统显示子系统交互性能,对图形渲染、游戏等程序有帮助。
(3)图形API追踪(按需启用)
- Collect DX11/DX12/OpenGL/Vulkan trace
针对对应图形 API 的程序,采集 API 调用、渲染管线事件,分析图形渲染性能,优化画面卡顿、帧率低等问题。
- Collect OpenXR trace
追踪 OpenXR(跨平台 AR/VR 标准)相关事件,分析 VR/AR 应用在设备交互、场景渲染的性能表现。
(4)其他特殊采集
- Collect ISR/DPCC trace
采集 ISR(中断服务程序)、DPCC(特定 GPU 调试事件),一般用于深度系统级调试,普通应用优化较少用到。
- Collect custom ETW trace(Windows 环境)
采集自定义 ETW(Event Tracing for Windows)事件,可整合系统级或其他工具的自定义性能数据。
- Collect Reflex SDK events
追踪 NVIDIA Reflex(低延迟优化 SDK)相关事件,分析游戏等应用的输入延迟、渲染同步性能。
(5)Python profiling options
针对 Python 程序,可配置 Python 性能分析参数(如采集 Python 函数调用栈、追踪解释器事件 ),分析 Python 脚本在 CPU/GPU 交互、第三方库调用的性能问题。
(6)右侧采集触发控制
Start profiling manually: 手动点击开始 / 停止采集,灵活控制采集区间(如只抓 "程序关键流程")。
Start profiling after/ Limit profiling to(seconds/frames): 设置延迟启动、限制采集时长 / 帧数,避免采集无关数据,聚焦目标阶段(如 "前 10 秒初始化不采集,只抓后续 600 帧渲染" )。
**Hotkey Start/Stop:**设置快捷键(如 F12)控制采集,方便运行程序时快速触发,无需切回界面操作。
由于这些选项覆盖了从 CPU 基础分析→GPU 异构计算→图形 / VR 渲染→特殊场景(如 Python、AR/VR ) 的全链路性能采集能力,在进行配置时,按需勾选配置,以最大限度地减少跟踪开销。
3. 结果分析
首先看看在只选择"Collect CUDA trace"时的report结果:
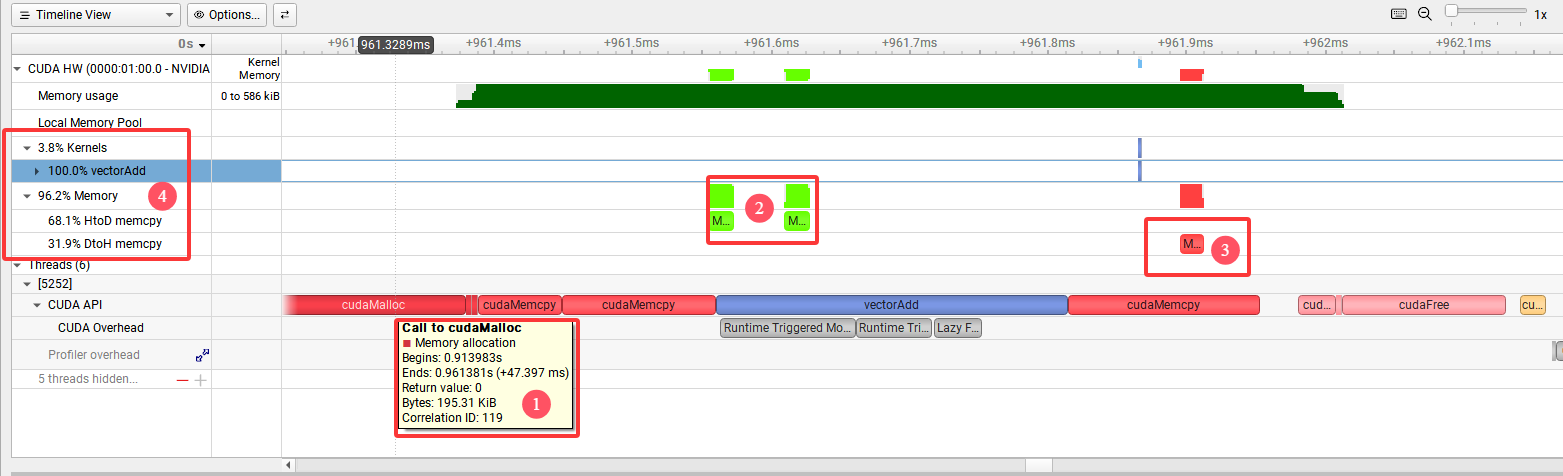
在图中的timeline视图中可以清楚的看到主要函数调用时间线,其中三个cudaMalloc调用中,第一个调用所花费的时间要远远大于剩余两个图中标记1,这是因为在第一次调用任何CUDA API(包括cudaMalloc)时,CUDA runtime 会进行:CUDA 上下文创建(Context Creation),驱动和设备初始化,内核模块加载等操作,这部分开销通常是毫秒级,所以第一次cudaMalloc看起来很慢,图中标记2是HostToDevice内存拷贝,标记3是DeviceToHost内存拷贝,由于程序比较简单可见这两部分内存拷贝占用绝大部分的运行时间,而真正的Kernel函数调用仅仅占用3.8%,见标记4。
Report中的分析汇总给出了解析过程依赖的主要硬件资源:
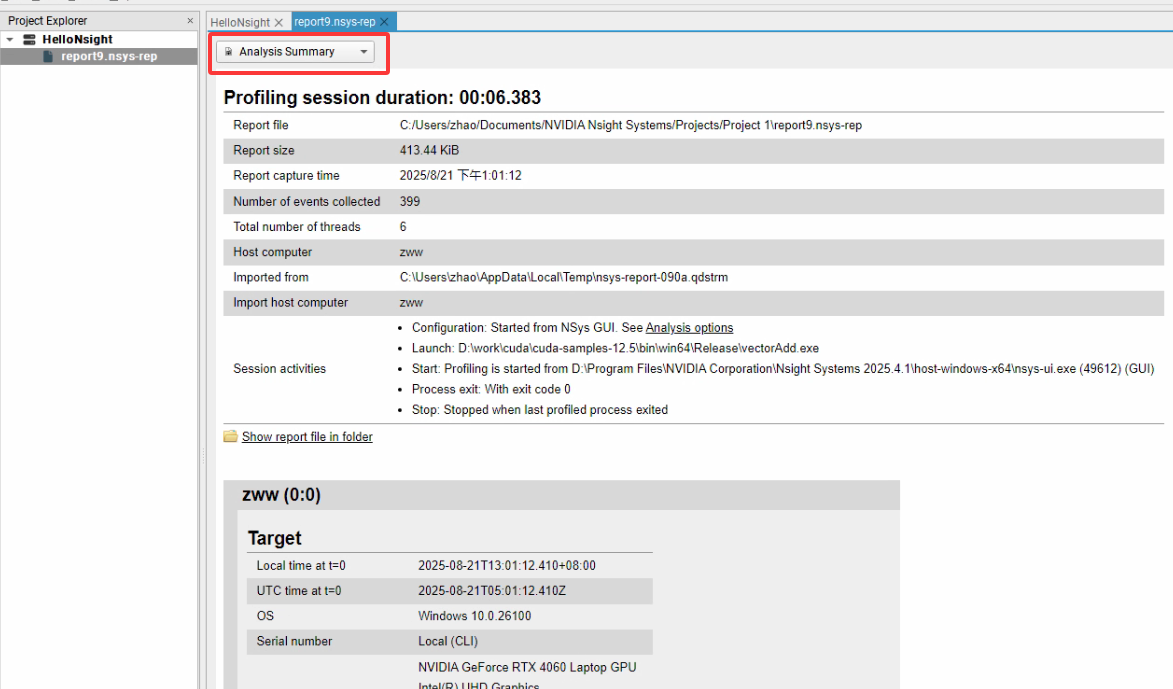
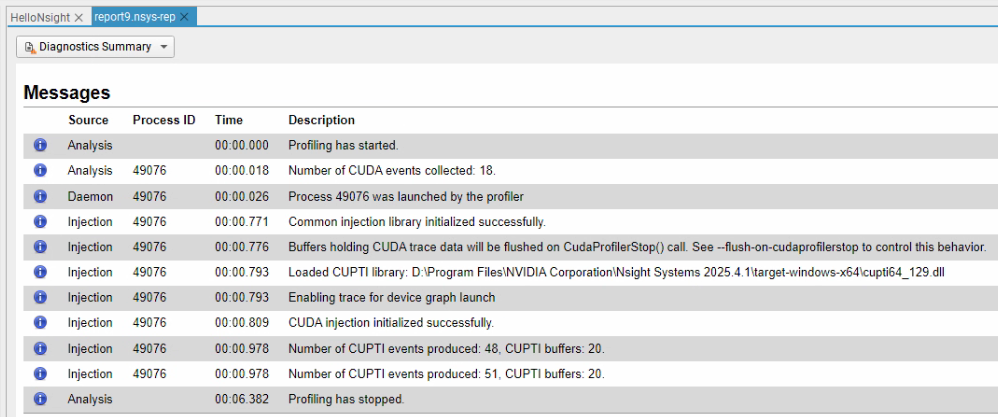
诊断汇总给出了解析过程中的主要事件线索:
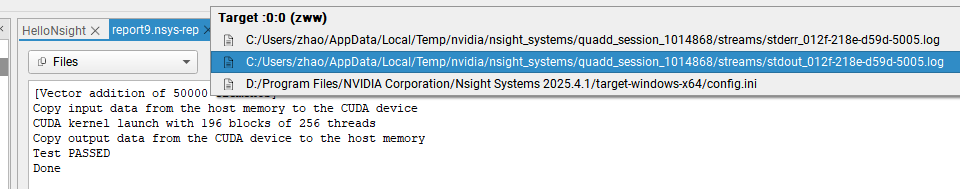
最后,Files给出了标准错误输出log信息,标准输出log信息,以及配置信息。
2.2 命令行
1. Nsight Systems 进行分析
命令行方式主要应用在Linux操作系统下,仍使用之前的vectorAdd作为分析对象,直接使用如下命令进行分析:
nsys profile -o report ./vectorAdd命令执行后会生成report.nsys-rep分析文件,后续可以通过命令行获取相关信息或者Nsight Systems GUI工具直接打开该文件进行分析。
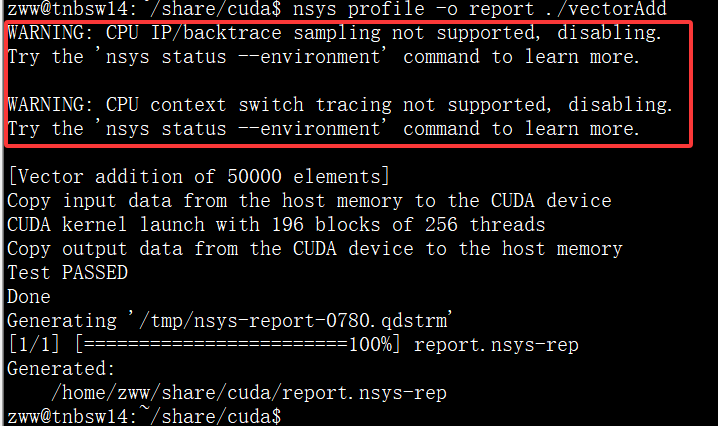
需要注意的是图中在输出结果前还有两个警告信息,它表明在当前环境下的某些功能不可用(CPU相关),所以它自动关掉了,出现这个警告,可能是和当前CPU架构或者操作系统内核等相关,可以使用nsys status --environment命令查看当前环境对 Nsight Systems 各种功能的支持情况,如输出信息如下:
1 Timestamp counter supported: Yes
2
3 CPU Profiling Environment Check
4 Root privilege: disabled
5 Linux Kernel Paranoid Level = 4
6 Linux Distribution = Ubuntu
7 Linux Kernel Version = 6.8.0-65-generic: OK
8 Linux perf_event_open syscall available: Fail
9 Sampling trigger event available: Fail
10 Intel(c) Last Branch Record support: Not Available
11 CPU Profiling Environment (process-tree): Fail
12 CPU Profiling Environment (system-wide): Fail
13
14 See the product documentation at https://docs.nvidia.com/nsight-systems for more information,
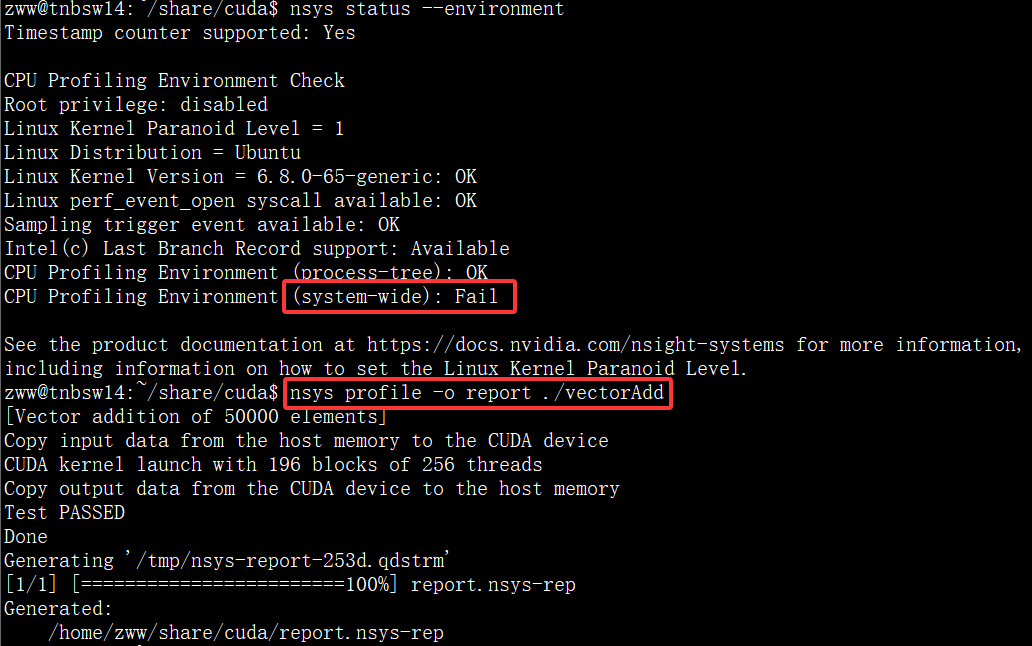
15 including information on how to set the Linux Kernel Paranoid Level.可见在9~12行,有好几处Fail所以导致了相关CPU profiling不支持,后搜索解决方案发现,进行如下操作可能解决该问题:
# 安装 libunwind
sudo apt install libunwind-dev
# 确认用户有权限访问 perf_event
sudo sysctl -w kernel.perf_event_paranoid=1
进行上述操作后,再次检测环境,虽然仍有一个错误提示,但是再次运行nsys分析时已经不再显示两个警告信息:
2. 分析结果
可使用如下命令分析结果:
nsys stats report.nsys-rep关键输出信息类似:
 1  ** CUDA API Summary (cuda_api_sum):
 2
 3  Time (%)  Total Time (ns)  Num Calls    Avg (ns)    Med (ns)  Min (ns)   Max (ns)   StdDev (ns)         Name
 4  --------  ---------------  ---------  ------------  --------  --------  ----------  ------------  ----------------
 5      99.6       86,755,035          3  28,918,345.0   5,369.0     3,688  86,745,978  50,080,199.2  cudaMalloc
 6       0.3          223,020          3      74,340.0  43,770.0    39,025     140,225      57,107.4  cudaMemcpy
 7       0.1           92,533          3      30,844.3  21,988.0     4,057      66,488      32,143.9  cudaFree
 8       0.0           21,241          1      21,241.0  21,241.0    21,241      21,241           0.0  cudaLaunchKernel
 9
10 Processing [report.sqlite] with [/opt/nvidia/nsight-systems/2023.1.2/host-linux-x64/reports/cuda_gpu_kern_sum.py]...
11
12  ** CUDA GPU Kernel Summary (cuda_gpu_kern_sum):
13
14  Time (%)  Total Time (ns)  Instances  Avg (ns)  Med (ns)  Min (ns)  Max (ns)  StdDev (ns)                          Name
15  --------  ---------------  ---------  --------  --------  --------  --------  -----------  -----------------------------------------------------
16     100.0            4,128          1   4,128.0   4,128.0     4,128     4,128          0.0  vectorAdd(const float *, const float *, float *, int)
17
18 Processing [report.sqlite] with [/opt/nvidia/nsight-systems/2023.1.2/host-linux-x64/reports/cuda_gpu_mem_time_sum.py]...
19
20  ** CUDA GPU MemOps Summary (by Time) (cuda_gpu_mem_time_sum):
21
22  Time (%)  Total Time (ns)  Count  Avg (ns)  Med (ns)  Min (ns)  Max (ns)  StdDev (ns)      Operation
23  --------  ---------------  -----  --------  --------  --------  --------  -----------  ------------------
24      67.5           33,122      2  16,561.0  16,561.0    16,513    16,609         67.9  [CUDA memcpy HtoD]
25      32.5           15,937      1  15,937.0  15,937.0    15,937    15,937          0.0  [CUDA memcpy DtoH]
输出信息第1~8行是CPU API 调用耗时统计,其中Avg是平均时间,例如cudaMalloc函数在程序中一共被调用了3次,第1次由于包含GPU初始化相关内容运行时间最长,为Max值为86,745,978ns,第2次调用时间为中位数时间Med,值为5,369ns,第3次调用用时最少为Min,值为3,688ns,3次调用的平均时间Avg为28,918,345ns,StdDev为运行时间的标准偏差,其计算公式为sqrt(Σpow((xi-xavg), 2)/(n -1)),该值用于衡量数据的离散程度,即各数据点与平均值之间的平均偏离程度,其大小直接反映API调用时长的稳定性。由第8行可知,在Linux平台下整个cudaLaunchKernel调用时间仅有21,241 ns,在整个程序运行时间中的占比基本可以被忽略。输出信息第10~16行是Kernel函数vectorAdd的运行时间为4128ns,输出信息第20~25行是设备和主机内存互拷所用时间,分别是33123ns和15937ns,这三部分时间中,Kernel运行时间只占4128.0/(4128+33122+15937)=0.0776,即7.8%左右。
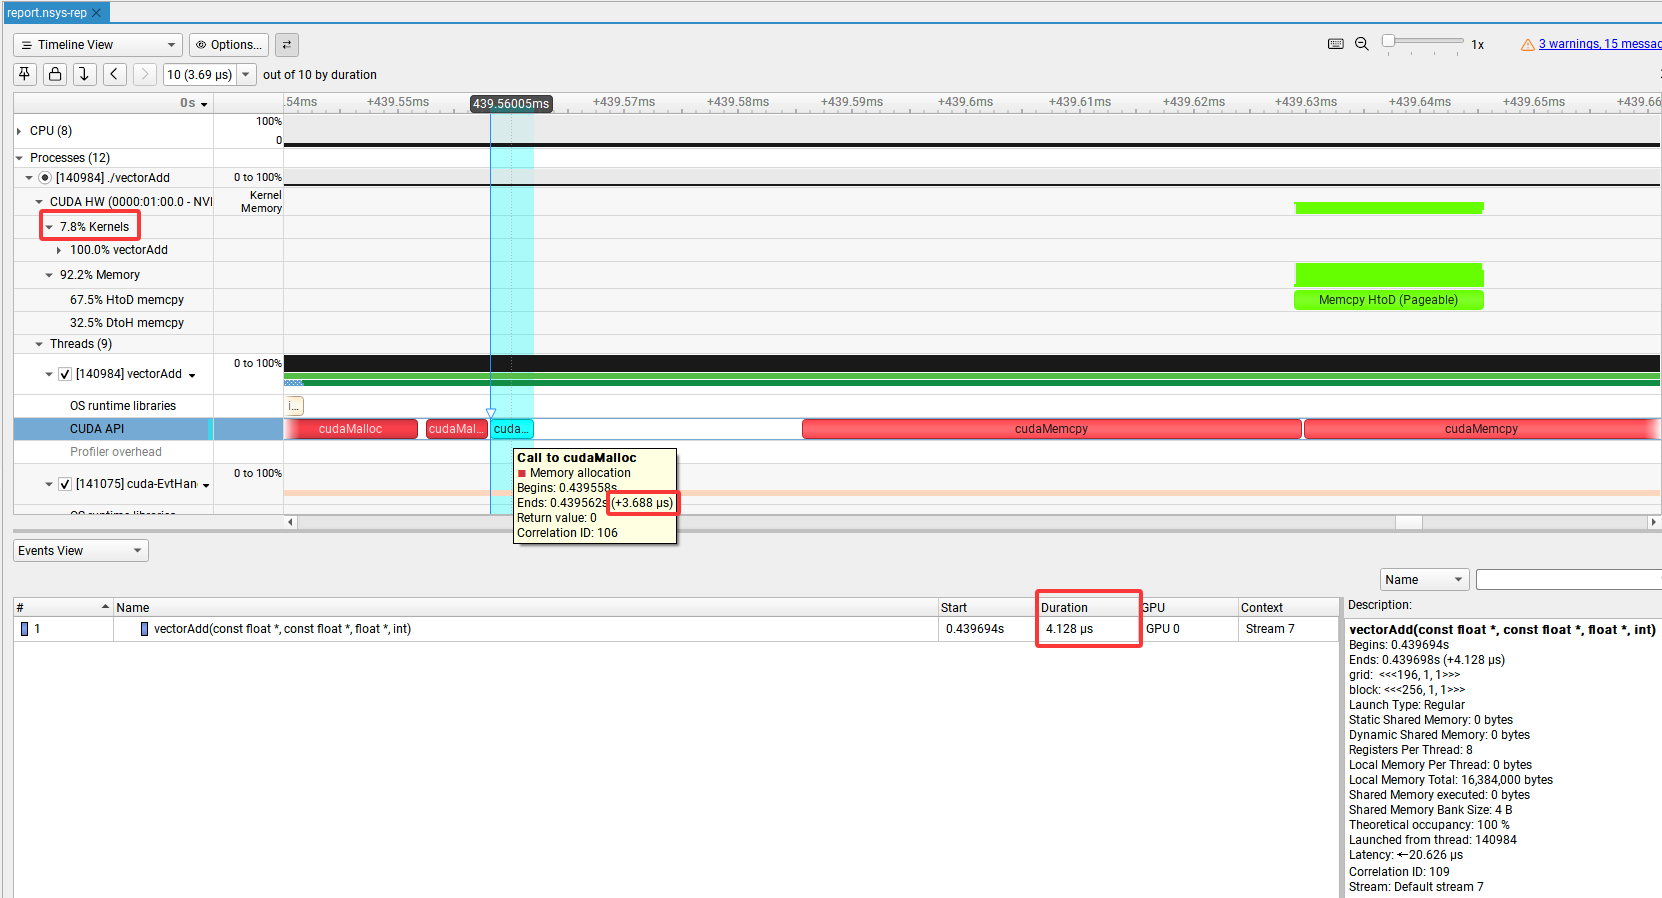
此外在命令行输出的report文件也可以在Nsight system GUI里直接打开,图中分别框出了Kernels运行占比、第3次cudaMalloc调用及Kernel函数vectorAdd运行时间,显示值也是和命令行中的输出信息及分析结果一致的:
3. 其他内容
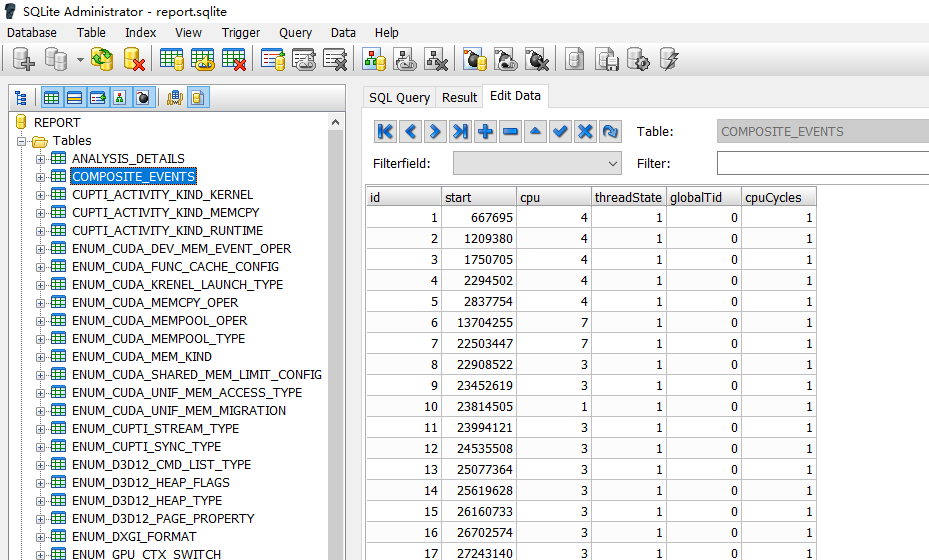
在 Nsight Systems 中使用nsys profile命令时,加上--stats=true参数会产生.sqlite文件,参数会使 Nsight Systems 在收集性能数据的过程中,额外收集并整理统计信息, 而.sqlite格式在存储结构化数据和统计信息方面有较好的支持和优势。开启该参数后,工具为了更方便地存储和组织这些额外的统计数据,会生成.sqlite文件,以充分利用 SQLite 数据库在数据管理和查询上的特性,便于后续对性能统计信息进行分析、检索 。用sqlite工具打开相应文件,内容如下,由于本人对数据库操作不熟悉对此不再详细分析。
更多命令行参数请参考官方文档。