如何在 Kubernetes 上高效部署 Alertmanager 告警系统?下面将详细介绍如何部署,一起看看吧!
- Kubernetes:v1.29.0
- Alertmanager:v0.28.1
- Prometheus:v3.5.0
- 部署 Prometheus:【Kubernetes】在 K8s 上部署 Prometheus-CSDN博客
1、创建命名空间
bash
### 为监控组件创建一个专用命名空间:monitoring

# monitoring-namespace.yaml
apiVersion: v1
kind: Namespace
metadata:
  name: monitoring

# 应用
kubectl apply -f monitoring-namespace.yaml
2、部署 Alertmanager
2.1、部署应用
bash
### 容器端口为 9093,部署成功后可通过 svc 暴露的端口在浏览器访问 alertmanager 页面
### 结合实际选择是否持久化挂载数据目录 storage-volume

# alertmanager-service.yaml
apiVersion: v1
kind: Service
metadata:
  name: alertmanager
  namespace: monitoring
spec:
  type: NodePort
  ports:
  - port: 9093
    targetPort: http
  selector:
    app: alertmanager
---
# alertmanager-deployment.yaml
apiVersion: apps/v1
kind: Deployment
metadata:
  name: alertmanager
  namespace: monitoring
spec:
  replicas: 1
  selector:
    matchLabels:
      app: alertmanager
  template:
    metadata:
      labels:
        app: alertmanager
    spec:
      containers:
      - name: alertmanager
        image: prom/alertmanager:v0.28.1
        args:
        - "--config.file=/etc/alertmanager/alertmanager.yml"
        - "--storage.path=/alertmanager"
        ports:
        - containerPort: 9093
          name: http
        volumeMounts:
        - name: config-volume
          mountPath: /etc/alertmanager
        - name: storage-volume
          mountPath: /alertmanager
      volumes:
      - name: config-volume
        configMap:
          name: alertmanager-config
      - name: storage-volume
        emptyDir: {}
2.2、告警通知配置
bash
# alertmanager-config.yaml
apiVersion: v1
kind: ConfigMap
metadata:
  name: alertmanager-config
  namespace: monitoring
data:
  alertmanager.yml: |
    global:
      resolve_timeout: 5m

    route:
      group_by: ['alertname']
      group_wait: 10s
      group_interval: 10s
      repeat_interval: 1h
      receiver: 'web.hook'

    receivers:
    - name: 'web.hook'                   # 需结合实际配置告警发送的服务端
      webhook_configs:
      - url: 'http://example.com/webhook'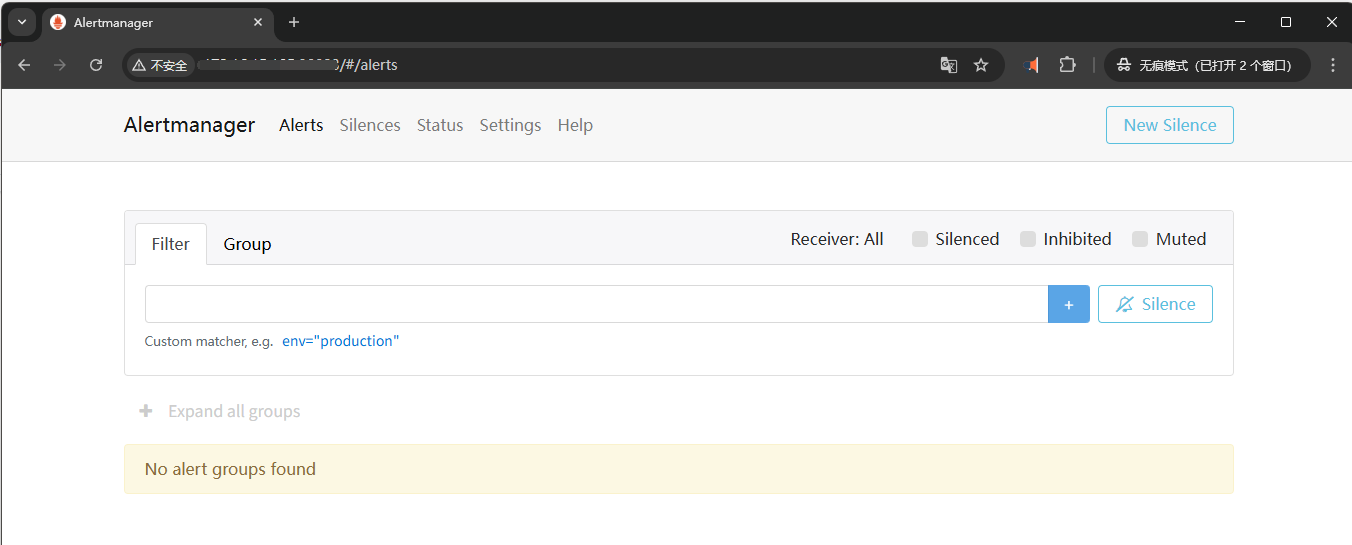
3、配置 Prometheus
3.1、添加告警规则配置
bash
# Deployment -> prometheus
apiVersion: apps/v1
kind: Deployment
metadata:
  name: prometheus
  namespace: monitoring
spec:
  replicas: 1
  selector:
    matchLabels:
      app: prometheus
  template:
    metadata:
      labels:
        app: prometheus
    spec:
      serviceAccountName: prometheus
      serviceAccount: prometheus
      containers:
      - name: prometheus
        image: prom/prometheus:v3.5.0
        args:
        - '--config.file=/etc/prometheus/prometheus.yml'
        - '--web.enable-lifecycle'
        - '--no-storage.tsdb.wal-compression'
        ports:
        - containerPort: 9090
          protocol: TCP
        volumeMounts:
        - name: prometheus-config
          mountPath: /etc/prometheus
        - name: rule-volume
          mountPath: /etc/prometheus/rules
        - name: data-volume
          mountPath: /prometheus
      volumes:
      - name: prometheus-config
        configMap:
          name: prometheus-config
      - name: data-volume
        emptyDir: {}
      - name: rule-volume                            # 添加告警规则 volume
        configMap:
          name: prometheus-rule

# ConfigMap - Prometheus
apiVersion: v1
kind: ConfigMap
metadata:
  name: prometheus-config
  namespace: monitoring
data:
  prometheus.yml: |
    global:
      scrape_interval:     15s
      evaluation_interval: 15s
    scrape_configs:
    - job_name: 'prometheus'
      static_configs:
      - targets: ['localhost:9090']
    - job_name: 'coredns'
      metrics_path: '/metrics'
      static_configs:
      - targets: ['kube-dns.kube-system.svc.cluster.local:9153']
    rule_files:                                     # 添加规则文件(实际使用 ConfigMap 挂载)
    - "/etc/prometheus/rules/rules.yml"
    alerting:
      alertmanagers:                                # 配置 alertmanager 地址(此处使用 svc -> alertmanger-svc)
      - static_configs:
        - targets:
          - "alertmanager:9093"
3.2、配置告警规则
bash
# prometheus-rules.yaml
kind: ConfigMap
apiVersion: v1
metadata:
  name: prometheus-rule
  namespace: monitoring
data:
  rules.yml: |
    ---
    groups:
    - name: "coredns"               # 此处规则是为了方便手动触发告警,需结合实际情况配置
      rules:
      - alert: "coredns_status"
        annotations:
          summary: "coredns:{{ $labels.instance }} 10 分钟内域名解析增长率 > 0"
        expr: "sum(rate(coredns_dns_requests_total{job=\"coredns\"}[10m])) by (instance) > 0"
        for: "30s"

# 配置完成后,可在 prometheus 界面看到告警规则(见下方截图)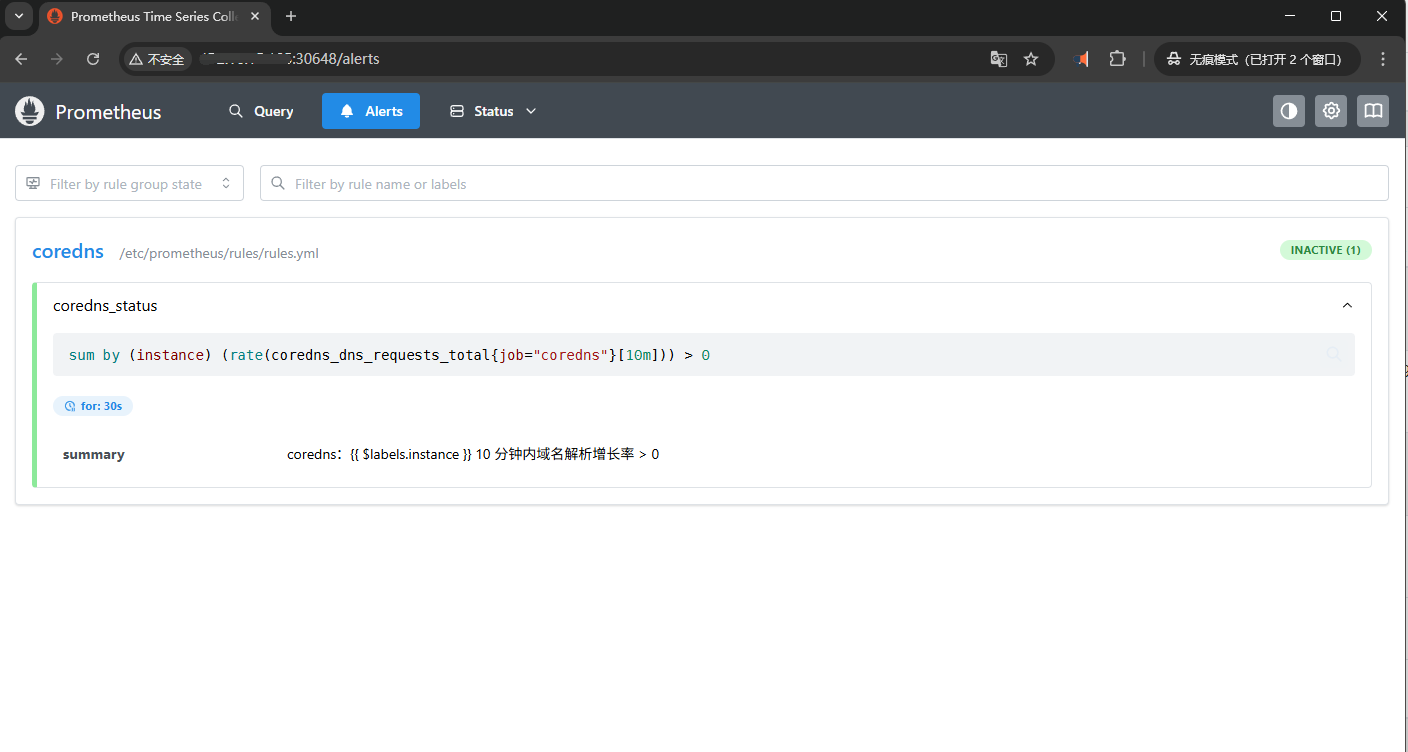
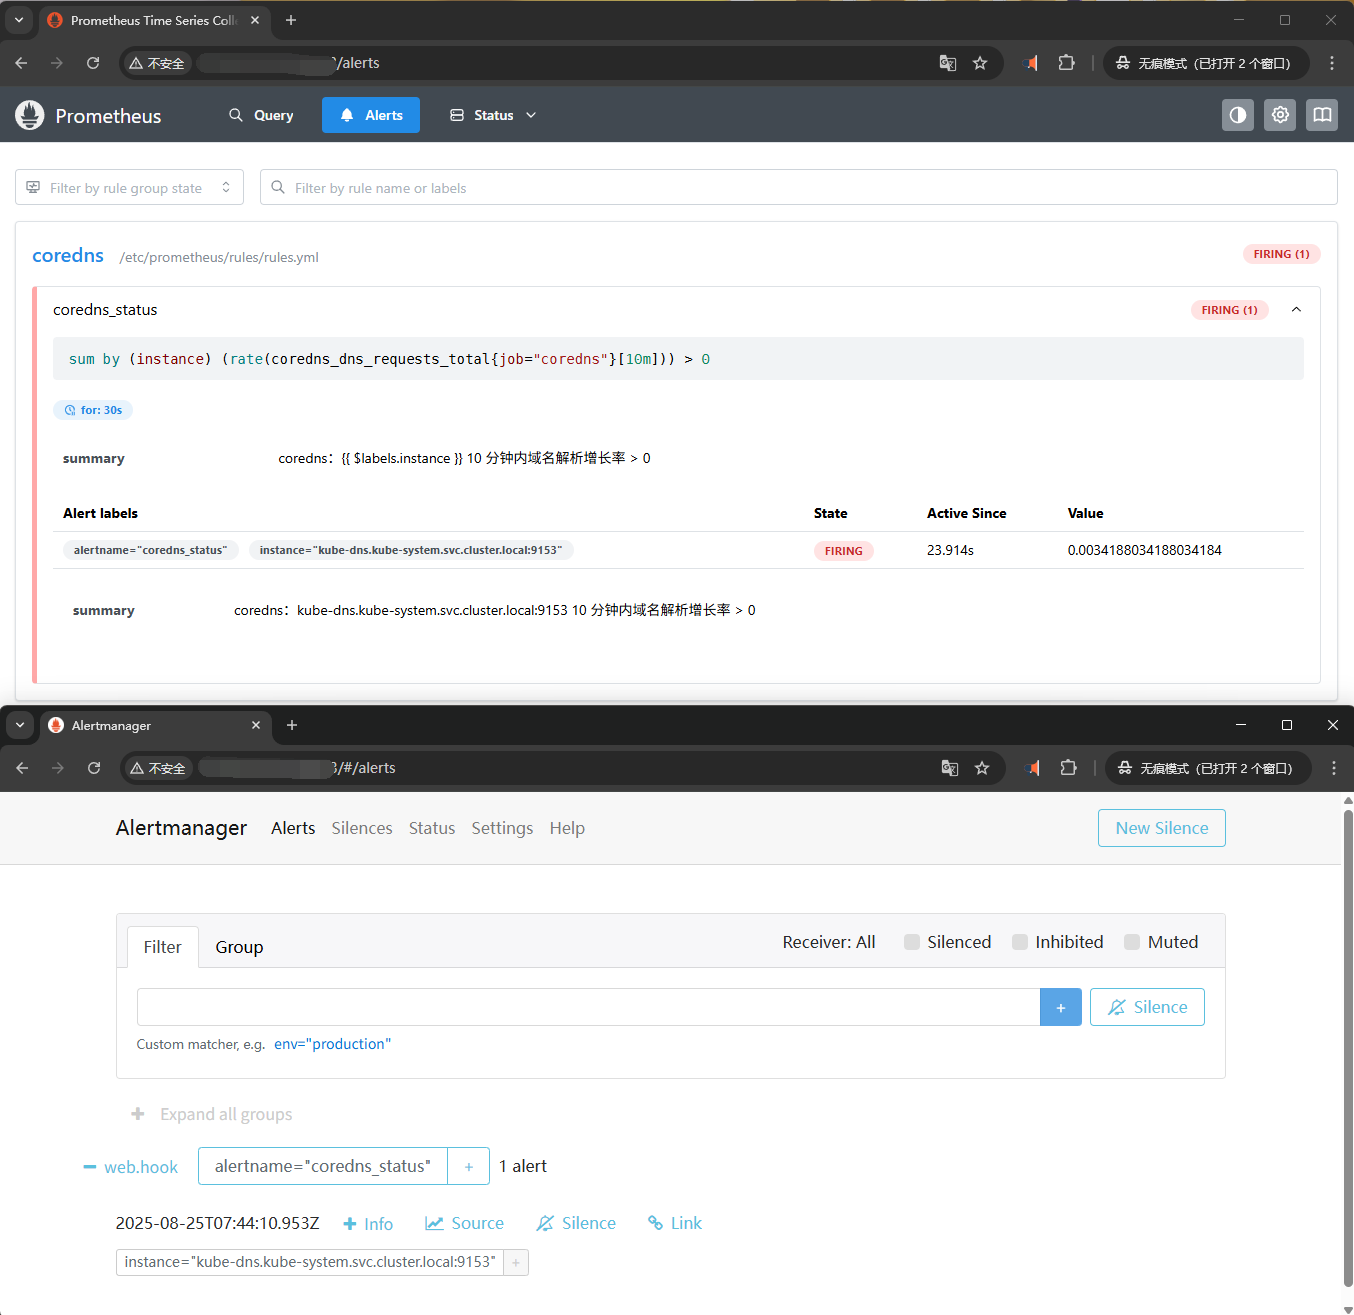
4、触发告警
- 手动触发告警后就可在 alertmanager 界面上看到告警
- 上方为 Prometheus 界面,下方为 Alertmanager 界面