🏞️ 基于Python+Streamlit的旅游数据分析与预测系统:从数据可视化到机器学习预测的完整实现
📝 前言
在大数据时代,旅游行业的数据分析变得越来越重要。如何从海量的旅游数据中挖掘有价值的信息,并进行准确的销量预测,是每个数据分析师和产品经理都关心的问题。
本文将详细介绍一个完整的旅游数据分析与预测系统的设计与实现,该系统集成了数据可视化、地理分析、文本挖掘和机器学习预测等多个功能模块,采用现代化的Web界面,为用户提供直观、交互式的数据分析体验。
🎯 项目概述
系统功能
- 📊 多维度数据可视化:销量排行、星级分布、城市分析
- 🗺️ 地理数据分析:基于地理坐标的热力图展示
- 🔮 智能销量预测:基于机器学习的景点销量预测
- ☁️ 文本数据挖掘:景点简介词云分析
- 📈 实时数据概览:关键指标监控面板
技术亮点
- 🚀 现代化Web界面:基于Streamlit构建的响应式界面
- 🎨 自定义UI设计:CSS样式优化,提升用户体验
- ⚡ 性能优化:数据缓存机制,提高加载速度
- 🔧 容错处理:优雅的依赖包处理和错误处理机制
- 📱 多设备适配:支持不同屏幕尺寸的响应式布局
🛠️ 技术架构
技术栈选择
前端框架
python
streamlit >= 1.28.0 # Web应用框架选择理由:Streamlit是专为数据科学和机器学习应用设计的Python Web框架,具有以下优势:
- 纯Python开发,学习成本低
- 内置丰富的数据可视化组件
- 支持实时交互和状态管理
- 部署简单,适合快速原型开发
数据处理层
python
pandas >= 1.5.0     # 数据处理
numpy >= 1.24.0     # 数值计算
可视化层
python
plotly >= 5.15.0    # 交互式图表
pydeck >= 0.8.0     # 地理数据可视化
matplotlib >= 3.7.0 # 基础图表
机器学习层
python
scikit-learn >= 1.3.0 # 机器学习算法文本处理层
python
wordcloud >= 1.9.2     # 词云生成
Pillow >= 9.5.0        # 图像处理
系统架构图
用户界面 Streamlit 数据处理层 Pandas 可视化层 Plotly/Pydeck 预测模型层 Sklearn 文本分析层 WordCloud 原始数据 CSV 特征数据 CSV 交互式图表 地理热力图 线性回归模型 特征工程 词频统计 词云图像
📊 数据结构设计
原始数据表结构
python
# tourism_raw_data.csv
columns = [
    '城市',      # 景点所在城市
    '名称',      # 景点名称
    '星级',      # 景点星级(如4A、5A等)
    '评分',      # 用户评分
    '销量',      # 历史销量
    '价格',      # 门票价格
    '是否免费',   # 是否免费景点
    '具体地址',   # 详细地址
    '坐标',      # 经纬度坐标
    '简介'       # 景点简介文本
]
特征工程数据表
python
# tourism_feature_data.csv
# 经过特征工程处理的数据,用于机器学习训练
processed_columns = [
    '城市',      # 类别特征
    '名称',      # 类别特征
    '星级',      # 数值特征(已处理)
    '评分',      # 数值特征
    '是否免费',   # 布尔特征
    '销量'       # 目标变量
]
🎨 界面设计与实现
整体布局设计
系统采用侧边栏导航 + 主内容区的经典布局:
python
# 页面配置
st.set_page_config(
    page_title="旅游数据分析与预测系统",
    page_icon="🏞️",
    layout="wide",                    # 宽屏布局
    initial_sidebar_state="expanded"  # 默认展开侧边栏
)
自定义CSS样式
python
st.markdown("""
<style>
    .main-header {
        font-size: 2.5rem;
        color: #1f77b4;
        text-align: center;
        margin-bottom: 2rem;
        padding: 1rem;
        background: linear-gradient(90deg, #e3f2fd, #bbdefb);
        border-radius: 10px;
    }
    .section-header {
        font-size: 1.5rem;
        color: #2c3e50;
        margin: 1.5rem 0 1rem 0;
        padding: 0.5rem;
        border-left: 4px solid #3498db;
        background-color: #f8f9fa;
    }
    .prediction-container {
        background-color: #f0f8ff;
        padding: 1.5rem;
        border-radius: 10px;
        border: 1px solid #dde7f0;
        margin: 1rem 0;
    }
</style>
""", unsafe_allow_html=True)
功能模块导航
python
# 侧边栏导航
page = st.sidebar.selectbox(
    "选择功能模块",
    ["🏠 首页概览", "📊 数据可视化", "🔮 销量预测",
     "🗺️ 地理分布", "☁️ 词云分析"]
)
📈 数据可视化实现
1. 首页概览模块
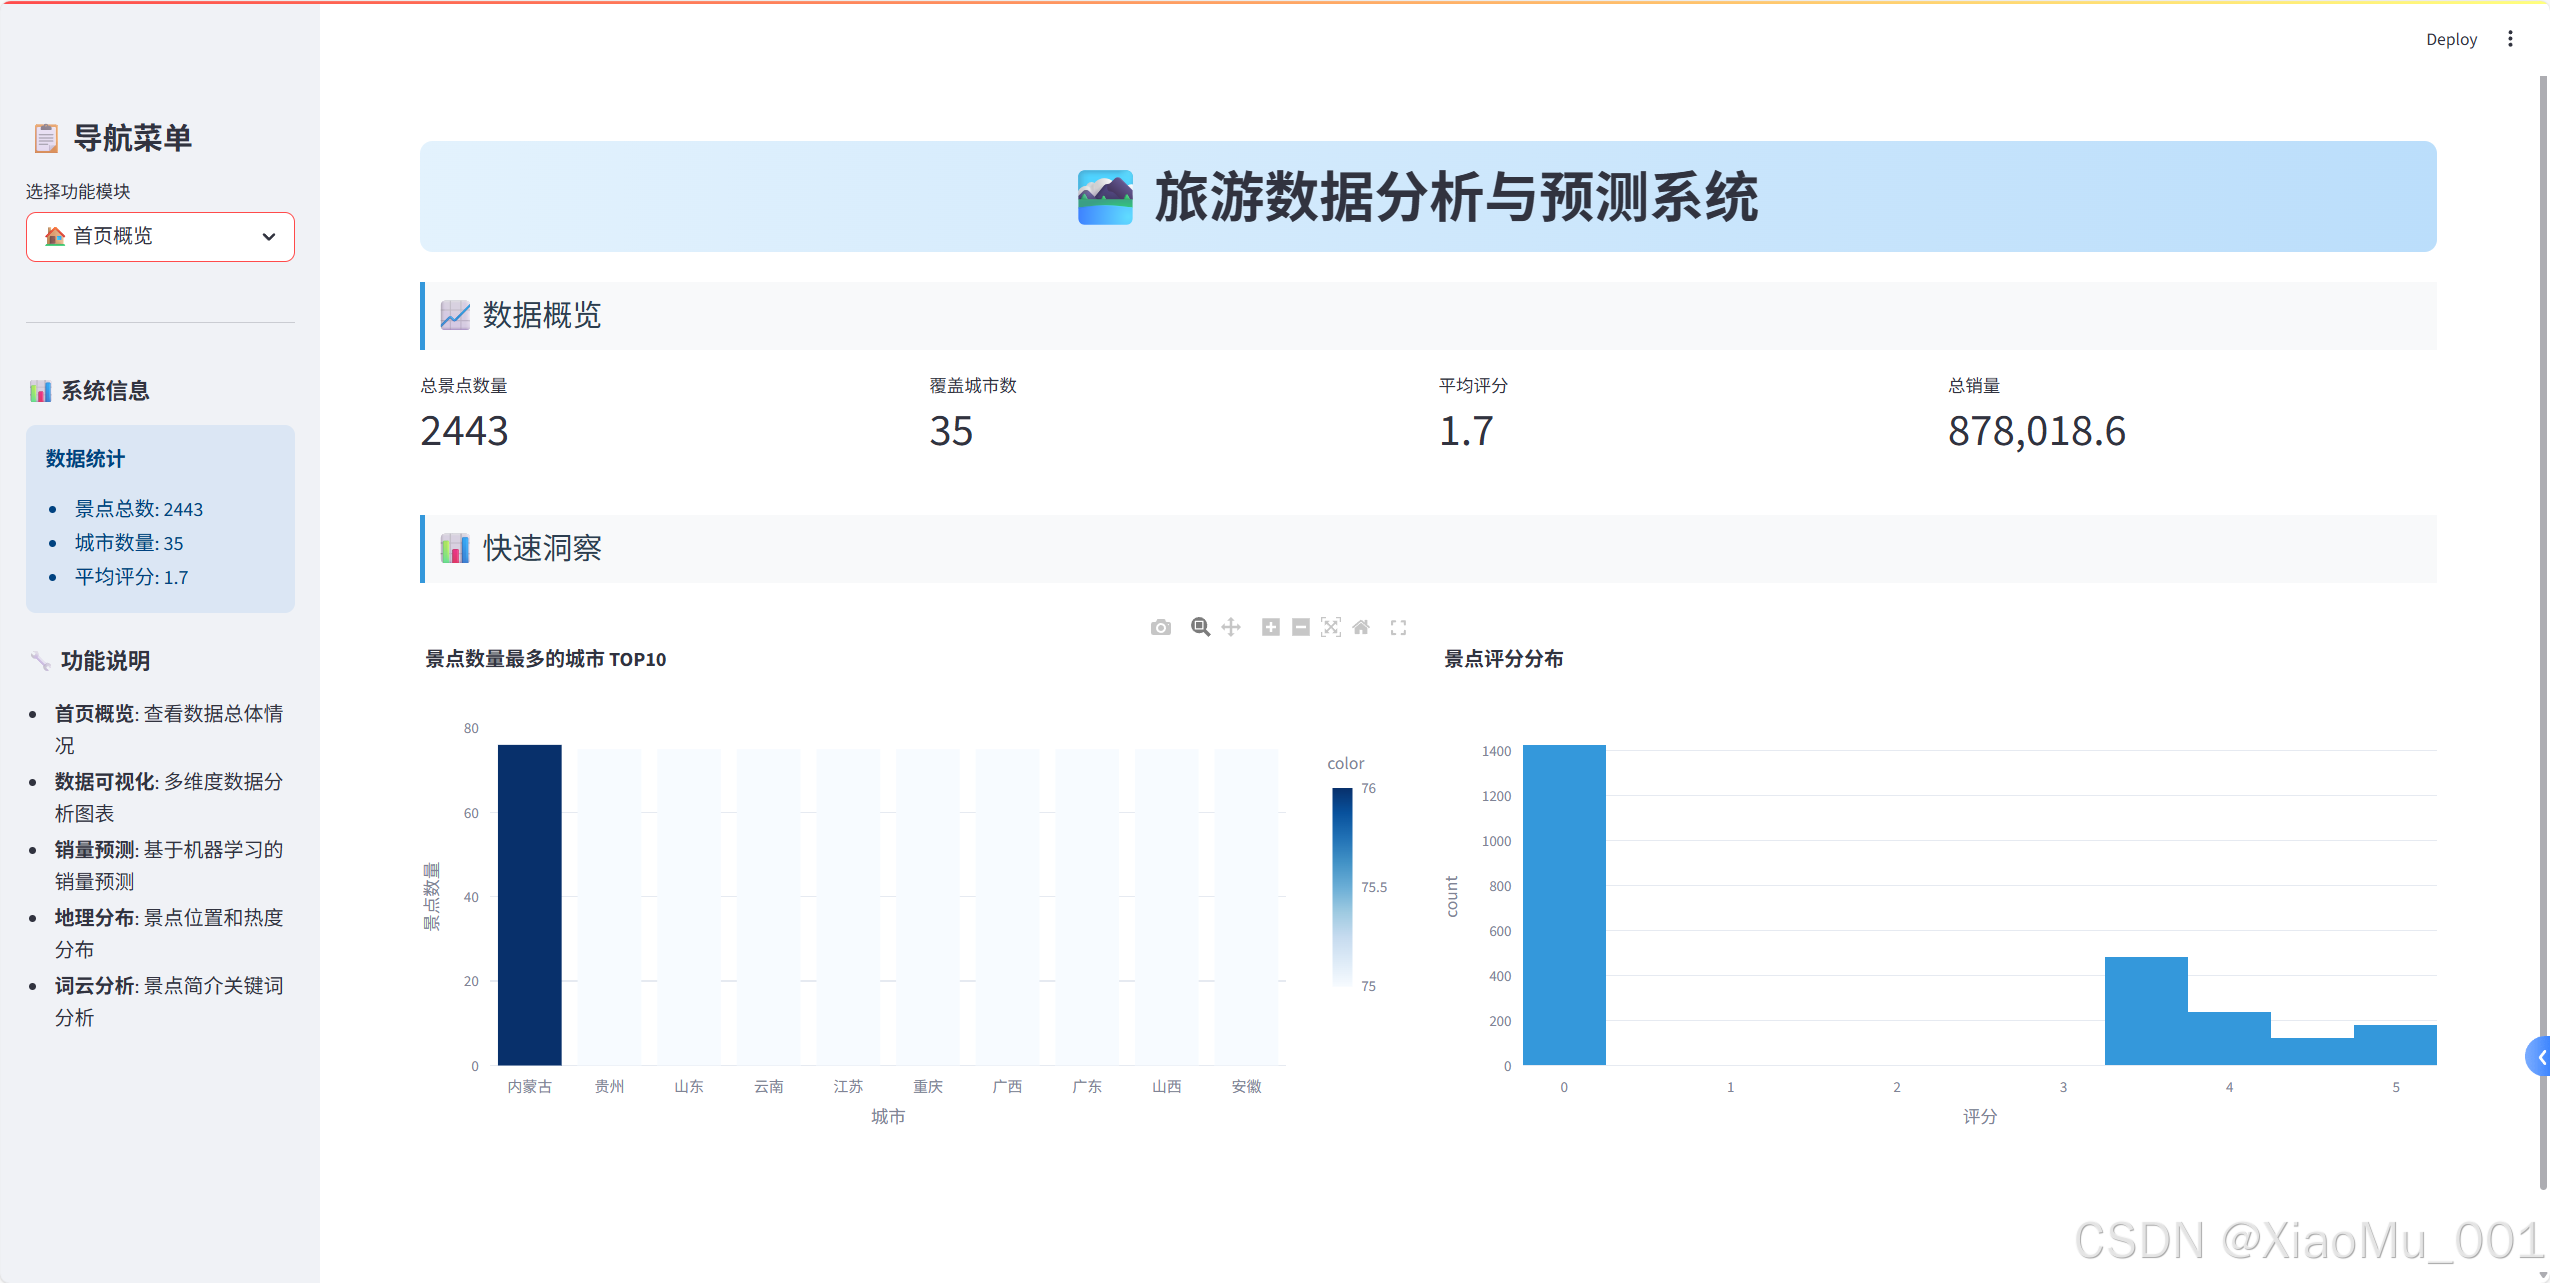
关键指标展示
python
# 创建四列布局显示关键指标
col1, col2, col3, col4 = st.columns(4)

with col1:
    st.metric("总景点数量", len(raw_data))
with col2:
    st.metric("覆盖城市数", raw_data['城市'].nunique())
with col3:
    avg_rating = raw_data['评分'].mean()
    st.metric("平均评分", f"{avg_rating:.1f}")
with col4:
    total_sales = raw_data['销量'].sum()
    st.metric("总销量", f"{total_sales:,}")
快速洞察图表
python
# 城市景点数量分布
city_counts = raw_data['城市'].value_counts().head(10)
fig_city = px.bar(
    x=city_counts.index,
    y=city_counts.values,
    title="景点数量最多的城市 TOP10",
    labels={'x': '城市', 'y': '景点数量'},
    color=city_counts.values,
    color_continuous_scale='Blues'
)
st.plotly_chart(fig_city, use_container_width=True)
2. 数据可视化模块
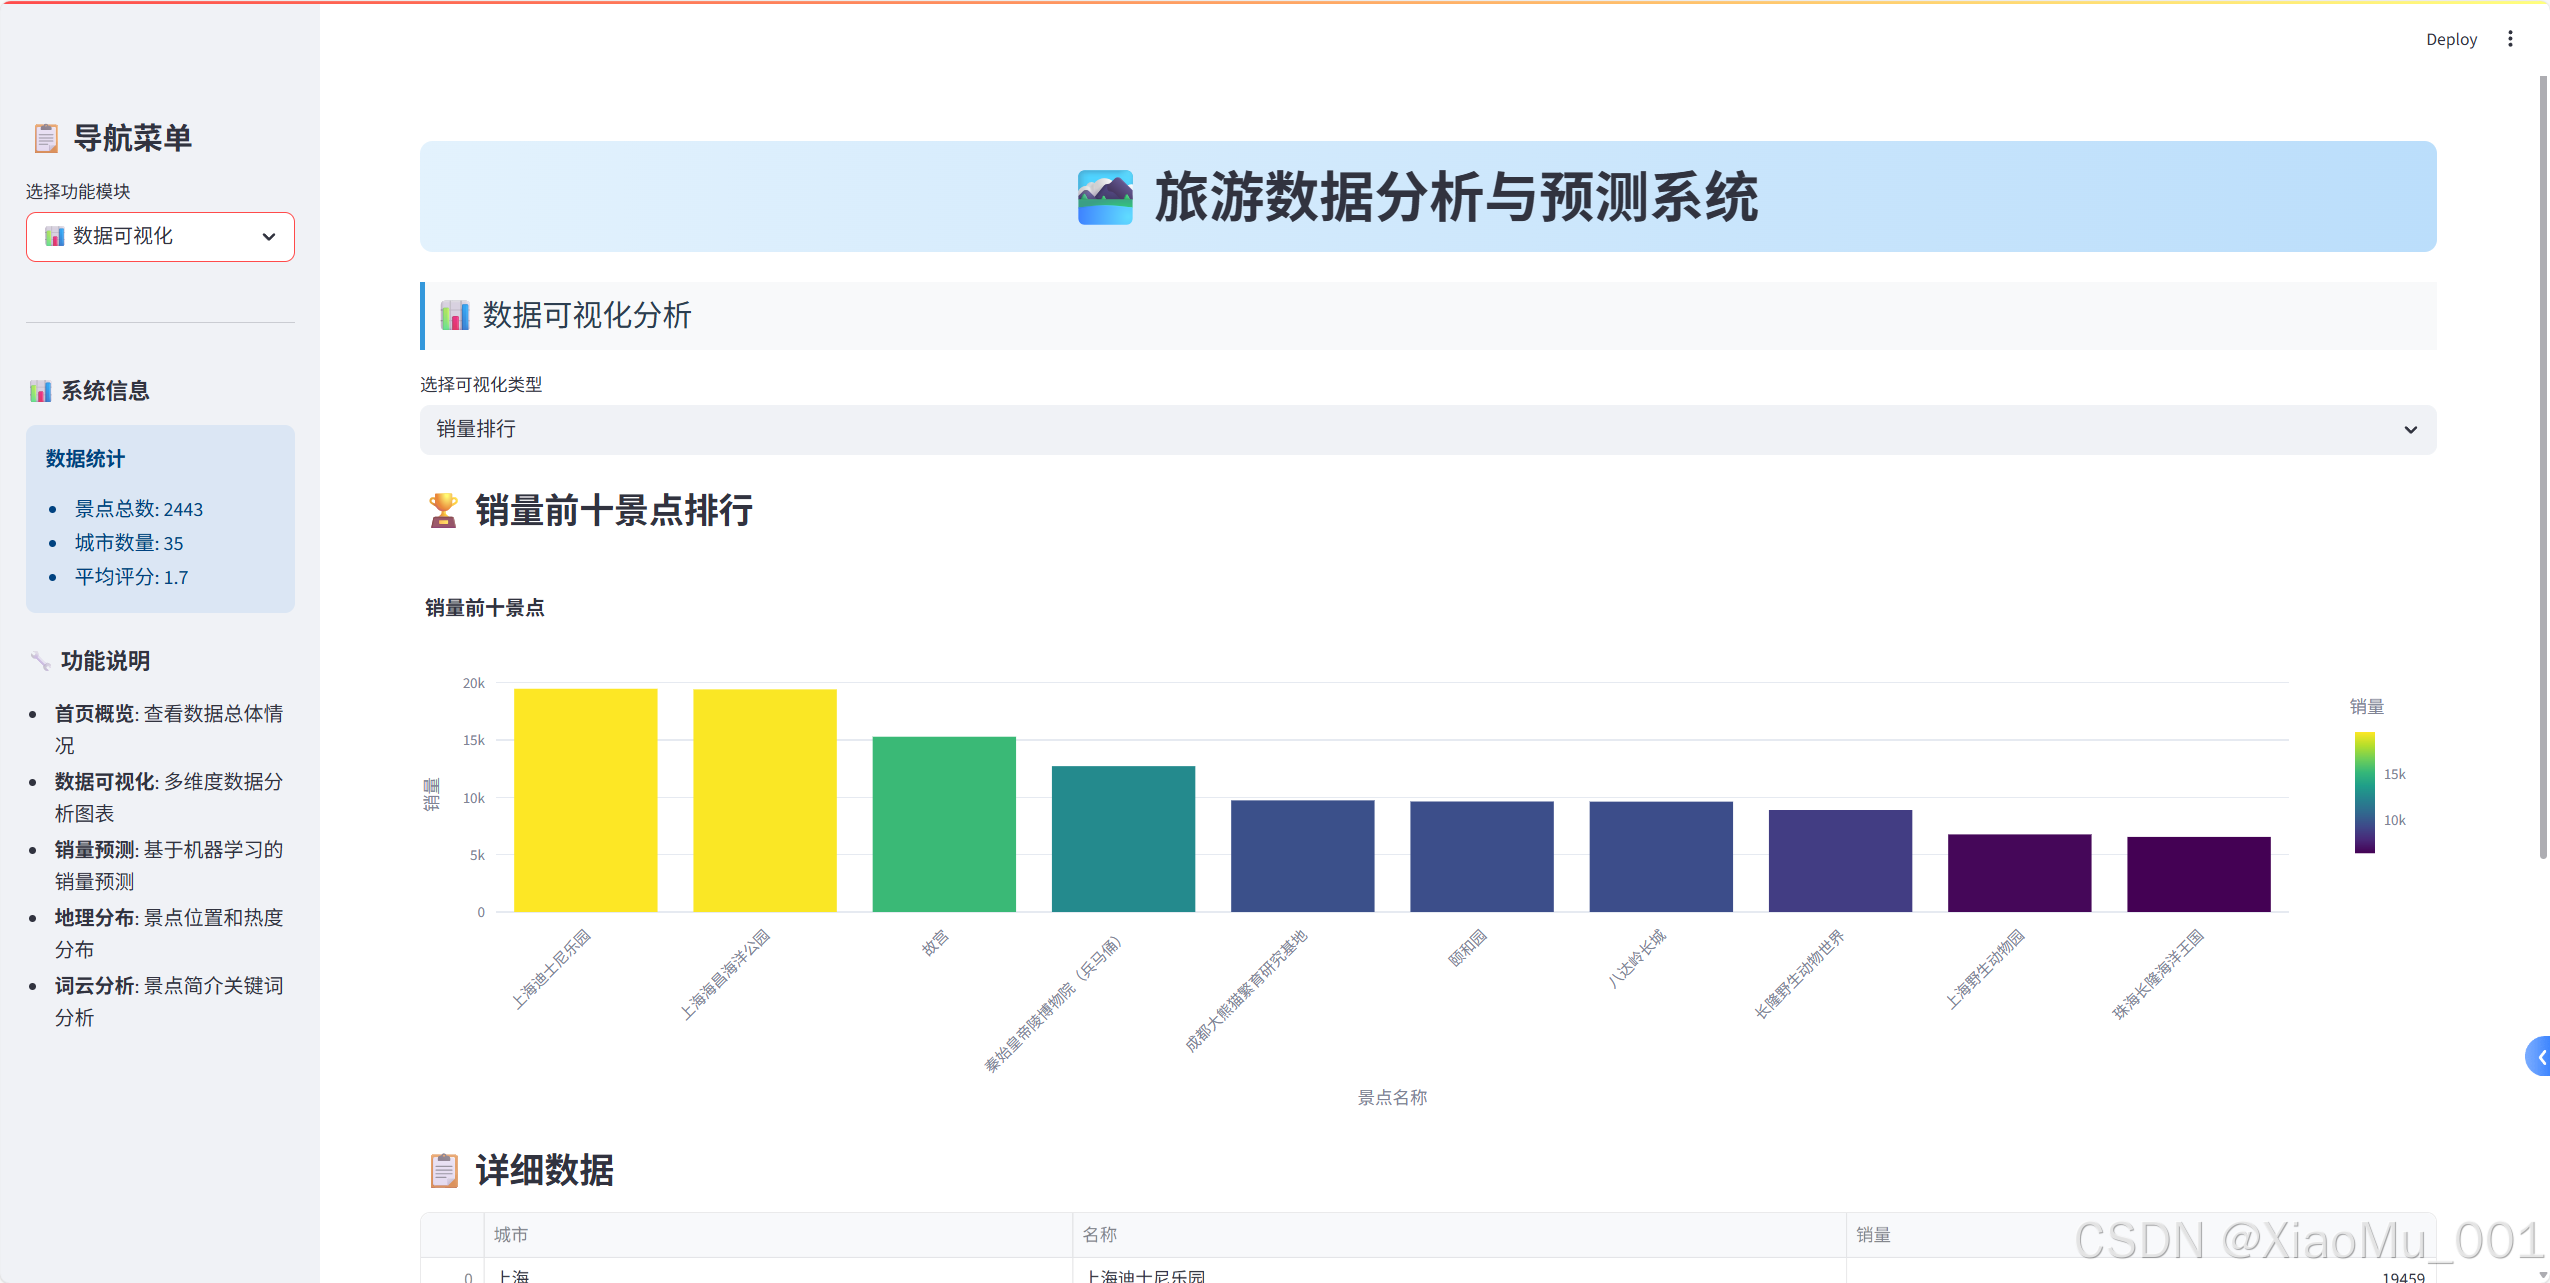
销量排行分析
python
def create_sales_ranking():
    """创建销量排行图表"""
    top_10_sales = raw_data[['城市', '名称', '销量']]\
        .sort_values(by='销量', ascending=False).head(10)

    bar_chart = px.bar(
        top_10_sales,
        x='名称',
        y='销量',
        color='销量',
        color_continuous_scale='Viridis',
        title="销量前十景点",
        labels={'名称': '景点名称', '销量': '销量'}
    )
    bar_chart.update_layout(xaxis_tickangle=-45)
    return bar_chart
星级分布分析
python
def create_star_distribution():
    """创建星级分布图表"""
    star_distribution = raw_data['星级'].value_counts().reset_index()
    star_distribution.columns = ['星级', '数量']

    # 饼图
    pie_chart = px.pie(
        star_distribution,
        names='星级',
        values='数量',
        title="星级分布饼图",
        color_discrete_sequence=px.colors.qualitative.Set3
    )

    # 柱状图
    bar_chart = px.bar(
        star_distribution,
        x='星级',
        y='数量',
        title="星级分布柱状图",
        color='数量',
        color_continuous_scale='Blues'
    )

    return pie_chart, bar_chart
城市评分与价格关联分析
python
def create_city_analysis():
    """创建城市分析散点图"""
    # 排除异常值
    df_no_sanqing = raw_data[raw_data['名称'] != '三清山']

    # 计算城市平均值
    avg_score_price = df_no_sanqing.groupby('城市').agg({
        '评分': 'mean',
        '价格': 'mean'
    }).reset_index()

    avg_score_price = avg_score_price.sort_values(
        by='评分', ascending=False
    ).head(10)

    scatter_chart = px.scatter(
        avg_score_price,
        x='评分',
        y='价格',
        color='城市',
        size='评分',
        size_max=20,
        title="平均评分前十城市与价格散点图",
        labels={'评分': '平均评分', '价格': '平均价格(元)'},
        hover_data=['城市']
    )

    return scatter_chart
🔮 机器学习预测系统
预测模型设计
1. 特征工程
python
def process_star(x):
    """处理星级特征"""
    if 'A' in str(x):
        return int(str(x)[0])  # 提取数字部分
    else:
        return 0  # 无星级设为0
2. 数据预处理Pipeline
python
from sklearn.compose import ColumnTransformer
from sklearn.preprocessing import OneHotEncoder, StandardScaler

# 创建预处理器
preprocessor = ColumnTransformer(
    transformers=[
        # 类别特征:独热编码
        ('cat', OneHotEncoder(handle_unknown='ignore'),
         ['城市', '名称']),
        # 数值特征:标准化
        ('num', StandardScaler(),
         ['星级', '评分'])
    ])
3. 模型训练Pipeline
python
from sklearn.pipeline import Pipeline
from sklearn.linear_model import LinearRegression

# 创建完整的ML Pipeline
model = Pipeline(steps=[
    ('preprocessor', preprocessor),
    ('regressor', LinearRegression())
])

# 特征和目标变量
X = df[['城市', '名称', '星级', '评分', '是否免费']]
y = df['销量']

# 训练模型
model.fit(X, y)
4. 预测接口实现
python
def predict_sales(city, spot_name, star_rating, rating, is_free):
"""销量预测函数"""
# 构建输入数据
user_input = pd.DataFrame({
'城市': [city],
'名称': [spot_name],
'星级': [star_rating],
'评分': [rating],
'是否免费': [is_free]
})
# 进行预测
predicted_sales = model.predict(user_input)
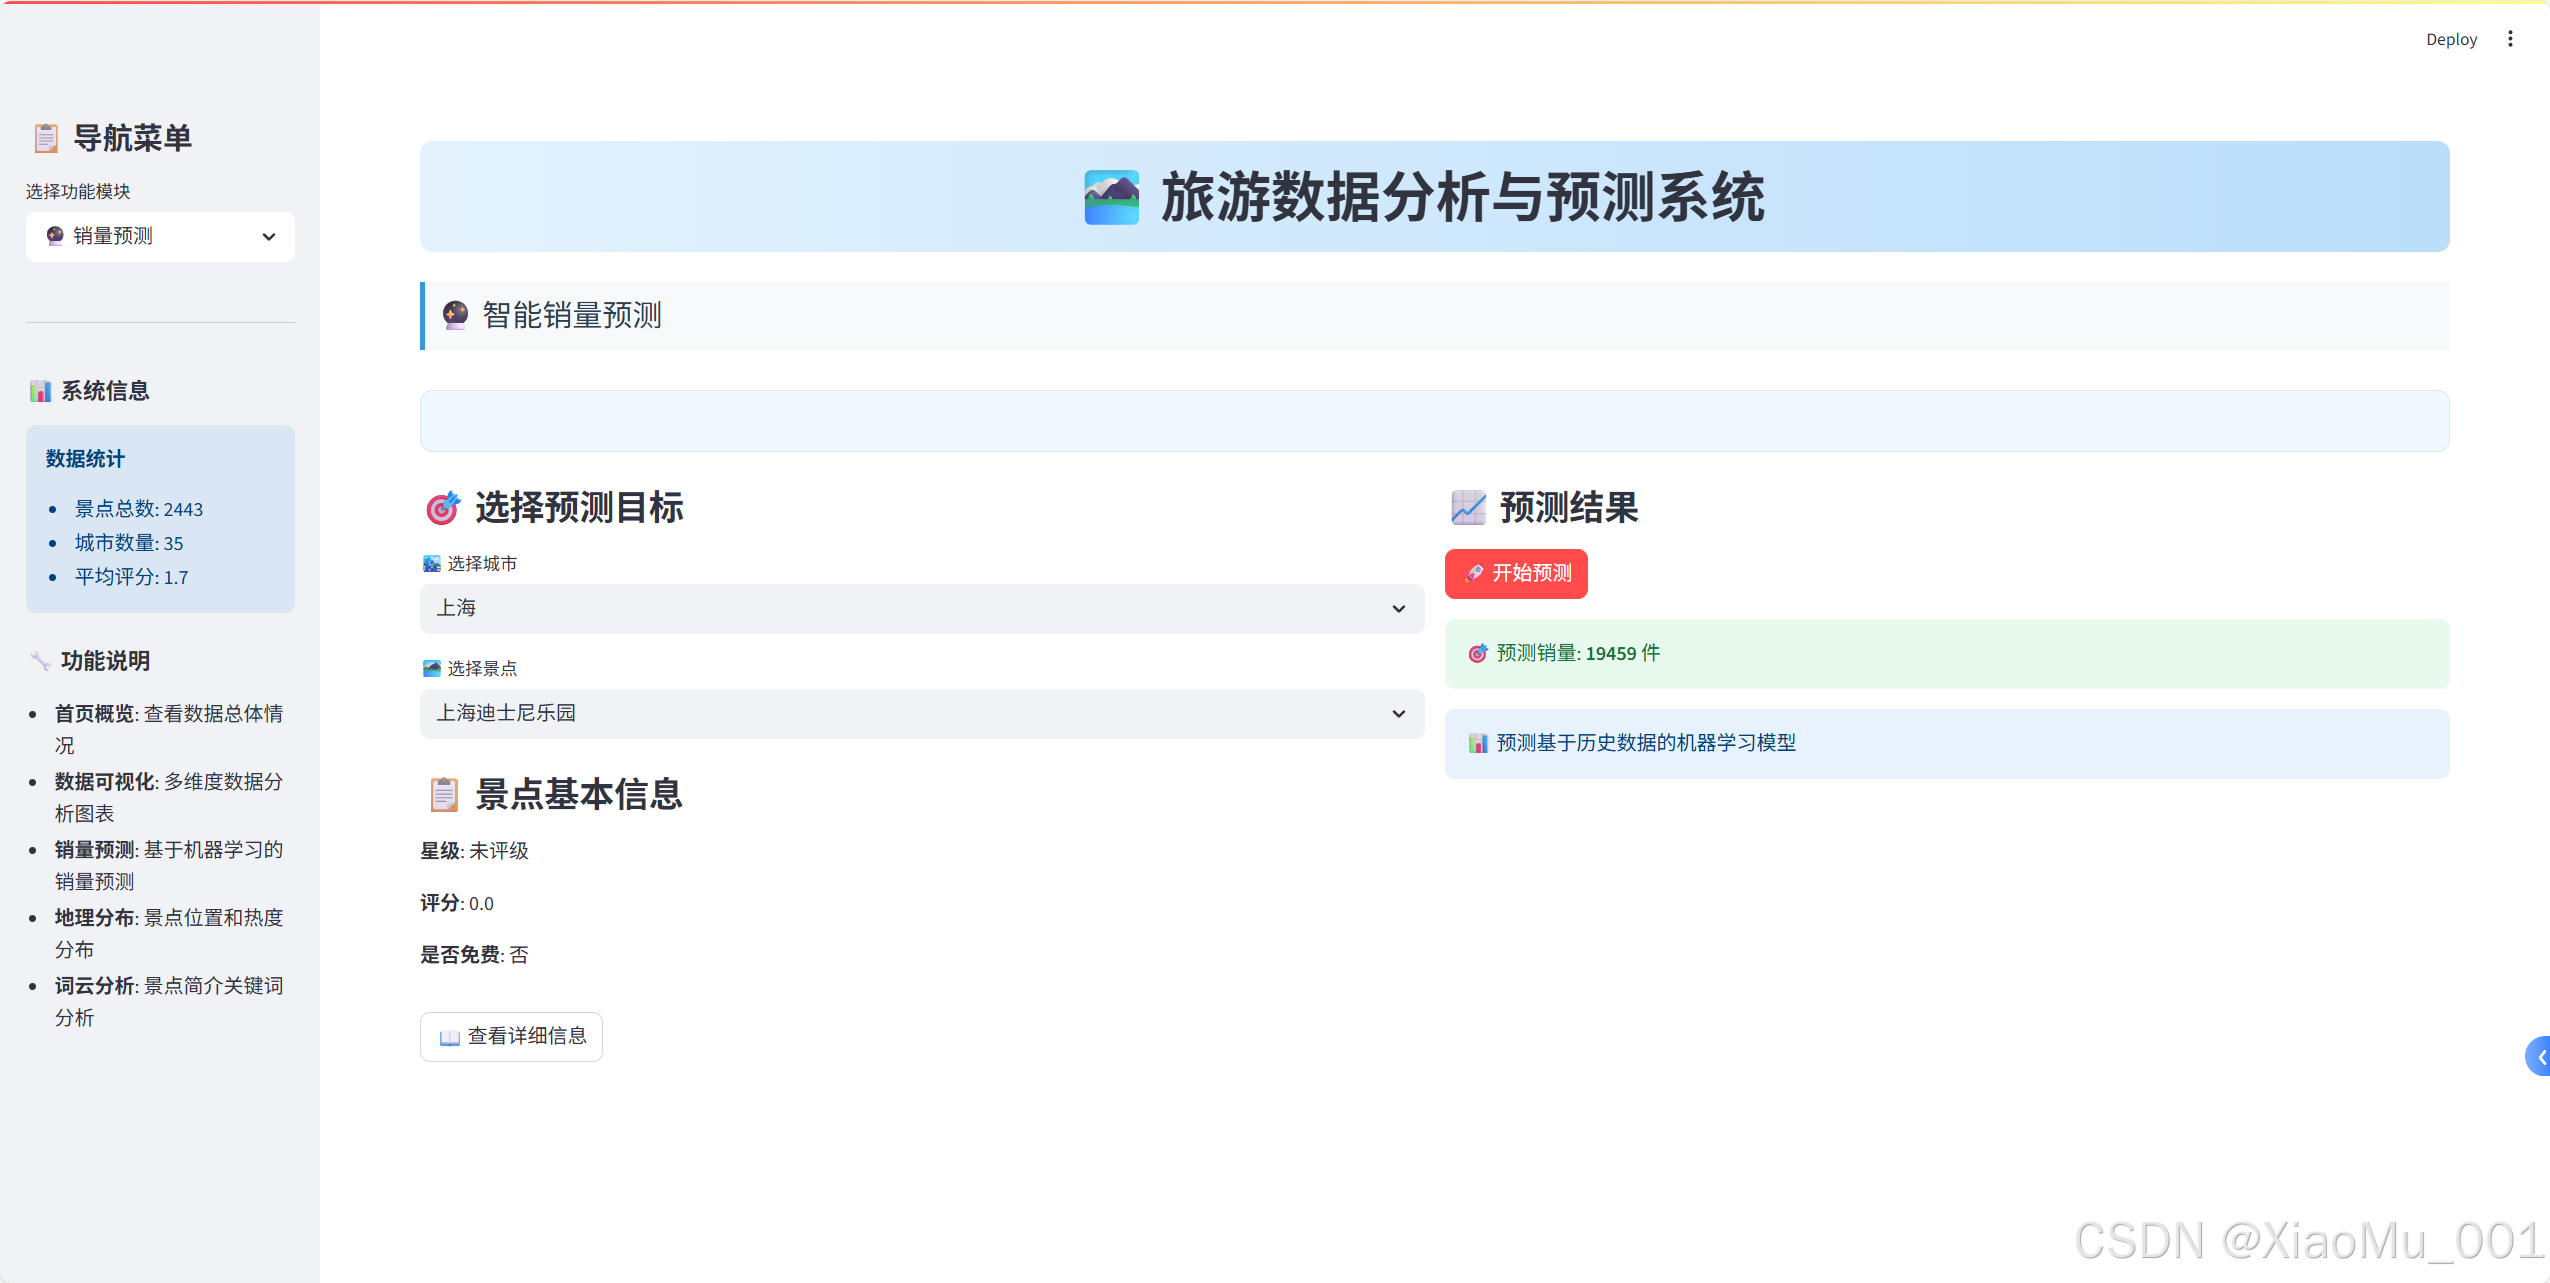
return predicted_sales[0]预测界面实现
python
def create_prediction_interface():
    """创建预测界面"""
    with st.container():
        col1, col2 = st.columns(2)

        with col1:
            st.subheader("🎯 选择预测目标")

            # 城市选择
            cities = feature_data['城市'].unique()
            selected_city = st.selectbox('🏙️ 选择城市', cities)

            # 景点选择
            city_spots = feature_data[
                feature_data['城市'] == selected_city
            ]['名称'].unique()
            selected_spot = st.selectbox('🏞️ 选择景点', city_spots)

        with col2:
            st.subheader("📈 预测结果")

            if st.button('🚀 开始预测', type='primary'):
                # 获取景点信息
                spot_data = get_spot_data(selected_city, selected_spot)

                # 进行预测
                prediction = predict_sales(
                    selected_city, selected_spot,
                    spot_data['星级'], spot_data['评分'],
                    spot_data['是否免费']
                )

                # 显示结果
                st.success(f"🎯 预测销量: **{prediction:.0f}** 件")
🗺️ 地理数据可视化
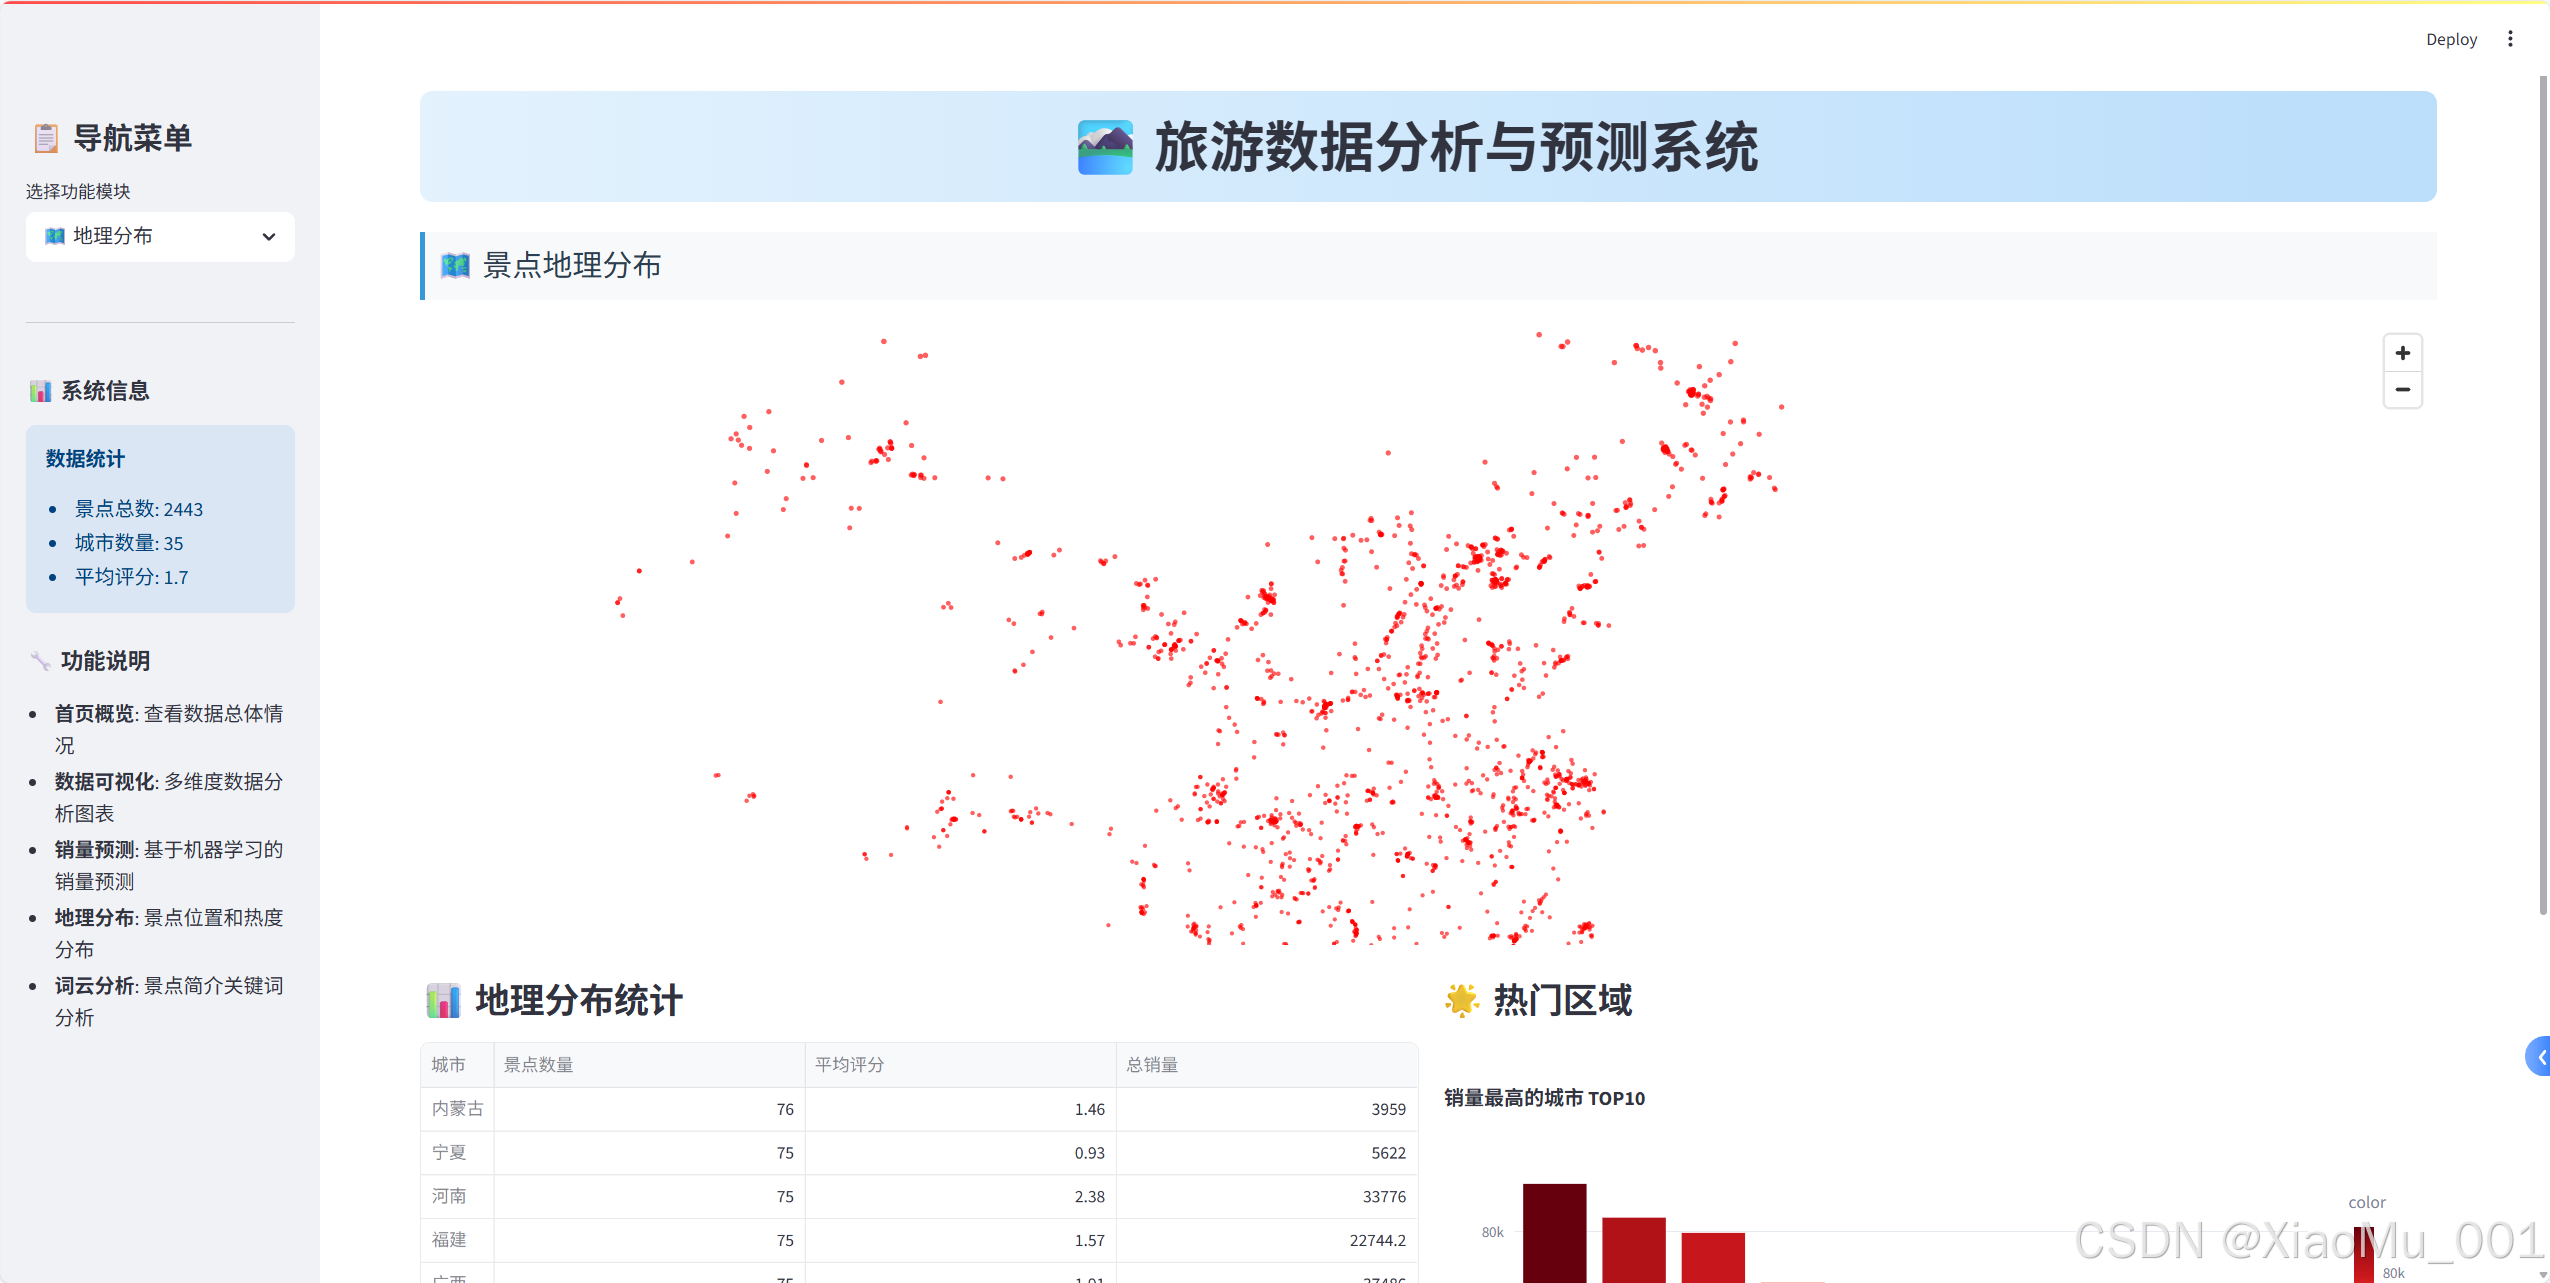
Pydeck地图实现
1. 坐标数据处理
python
def process_coordinates(df):
    """处理坐标数据"""
    # 分离经纬度
    df[['longitude', 'latitude']] = df['坐标'].str.split(',', expand=True)
    df['longitude'] = pd.to_numeric(df['longitude'], errors='coerce')
    df['latitude'] = pd.to_numeric(df['latitude'], errors='coerce')

    # 过滤无效坐标
    return df.dropna(subset=['longitude', 'latitude'])
2. 地图视图配置
python
import pydeck as pdk

# 设置地图视图
view_state = pdk.ViewState(
    latitude=35.8617,   # 中国中心纬度
    longitude=104.1954, # 中国中心经度
    zoom=3,            # 缩放级别
    pitch=0,           # 俯仰角度
)
3. 散点图层创建
python
# 创建散点图层
layer = pdk.Layer(
    "ScatterplotLayer",
    df_map,
    get_position=["longitude", "latitude"],
    get_radius=10000,              # 点的半径
    get_color=[255, 0, 0, 160],    # 红色半透明
    pickable=True,                 # 可点击
)
4. 交互式地图组装
python
# 创建地图对象
deck = pdk.Deck(
    layers=[layer],
    initial_view_state=view_state,
    tooltip={
        "text": "{名称}\n城市: {城市}\n评分: {评分}\n销量: {销量}"
    },
    map_style="mapbox://styles/mapbox/light-v10"  # 浅色主题
)

# 在Streamlit中显示
st.pydeck_chart(deck, use_container_width=True)
地理统计分析
python
def create_geographic_stats(df_map):
"""创建地理统计信息"""
# 按城市统计
region_stats = df_map.groupby('城市').agg({
'名称': 'count', # 景点数量
'评分': 'mean', # 平均评分
'销量': 'sum' # 总销量
}).round(2)
region_stats.columns = ['景点数量', '平均评分', '总销量']
# 热门区域分析
hot_regions = df_map.groupby('城市')['销量'].sum()\
.sort_values(ascending=False).head(10)
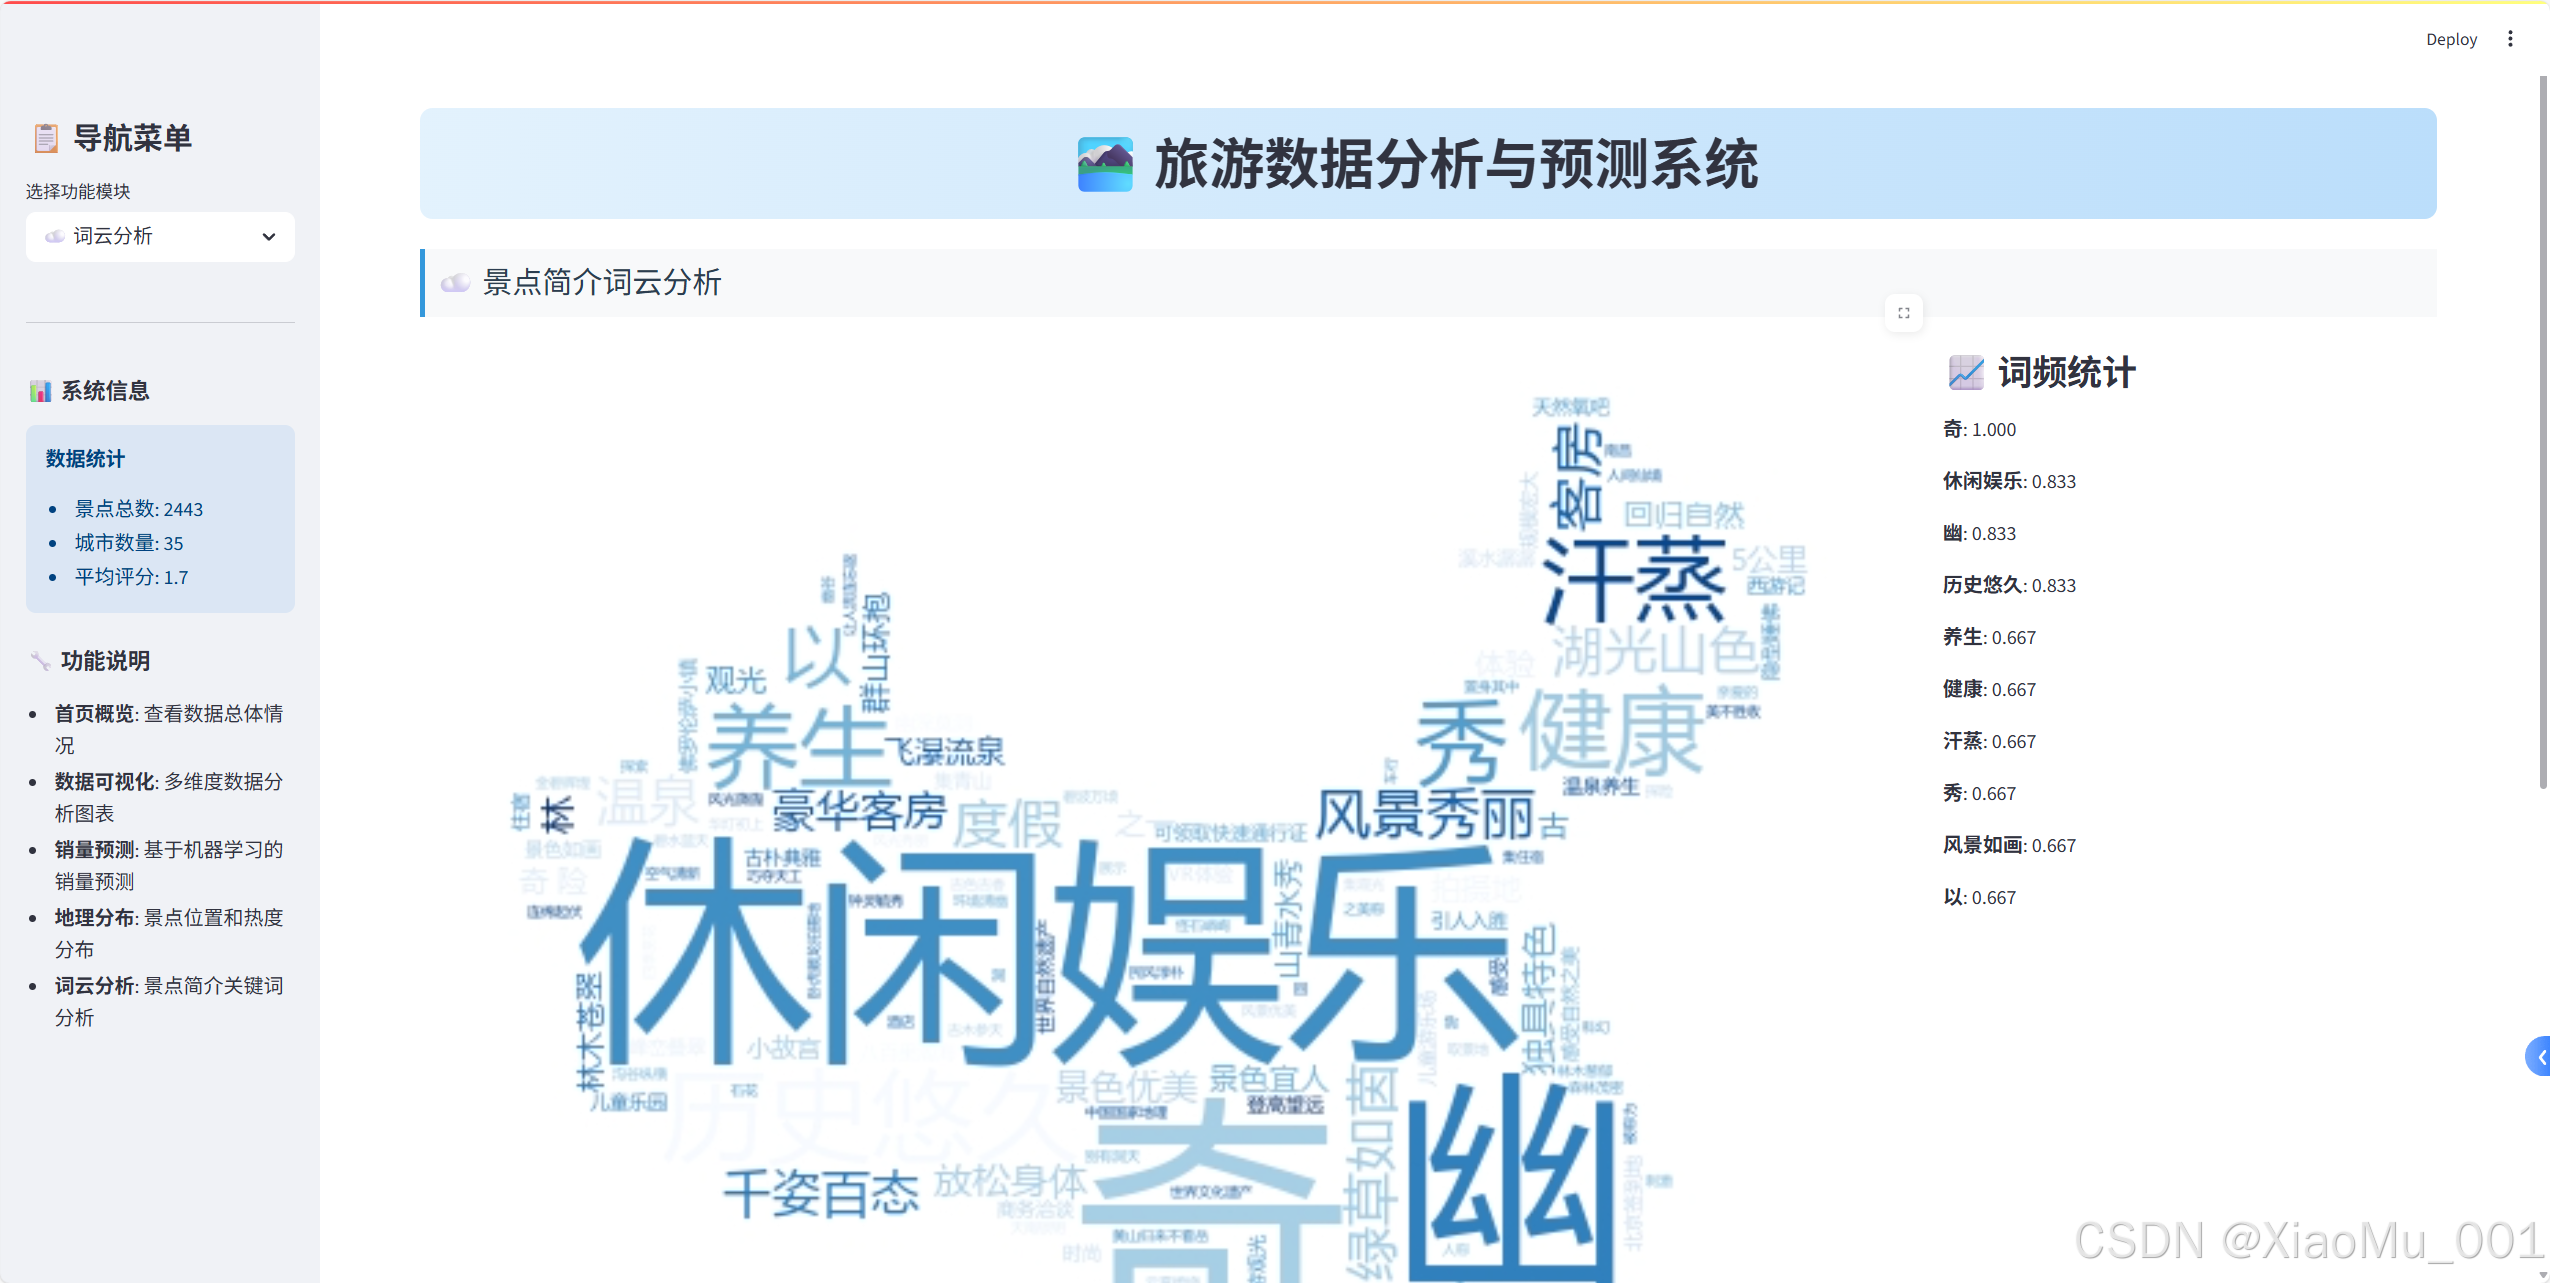
return region_stats, hot_regions☁️ 文本数据挖掘
词云生成实现
1. 文本预处理
python
def preprocess_text(descriptions):
    """文本预处理"""
    # 合并所有简介文本
    text = " ".join(descriptions.dropna().values)

    # 定义停用词
    stopwords = set([
        "被誉为", "有", "之称", "和", "是", "的", "在", "为",
        "一", "名", "景点", "素有", "餐饮", "中国", "世界",
        "最", "大", "多", "被", "包含", "这", "些", "该",
        "多个", "此", "风景", "之誉", "在这里", "旅游", "娱乐"
    ])

    return text, stopwords
2. 词云参数配置
python
def create_wordcloud_config(text, stopwords, mask=None):
    """创建词云配置"""
    config = {
        'width': 800,
        'height': 400,
        'max_words': 200,
        'max_font_size': 100,
        'contour_width': 1,
        'contour_color': 'white',
        'colormap': 'Blues',
        'background_color': 'white',
        'font_path': "C:/Windows/Fonts/msyh.ttc",  # 中文字体
        'stopwords': stopwords
    }

    # 添加自定义形状
    if mask is not None:
        config['mask'] = mask

    return config
3. 词云生成与展示
python
def generate_and_display_wordcloud():
    """生成并显示词云"""
    try:
        # 加载自定义形状
        custom_mask = np.array(Image.open('map_copy.png'))
        mask_available = True
    except:
        mask_available = False
        st.warning("未找到自定义形状文件,将使用默认形状")

    # 生成词云
    wordcloud_params = create_wordcloud_config(
        text, stopwords,
        custom_mask if mask_available else None
    )

    wordcloud = WordCloud(**wordcloud_params).generate(text)

    # 双列布局展示
    col1, col2 = st.columns([3, 1])

    with col1:
        st.image(wordcloud.to_array(), use_container_width=True)

    with col2:
        st.subheader("📈 词频统计")
        word_freq = wordcloud.words_
        top_words = dict(list(word_freq.items())[:10])

        for word, freq in top_words.items():
            st.write(f"**{word}**: {freq:.3f}")
替代方案:词频统计图表
python
def create_word_frequency_chart(text, stopwords):
    """创建词频统计图表(WordCloud不可用时的替代方案)"""
    from collections import Counter

    # 简单分词和过滤
    words = text.split()
    filtered_words = [
        word for word in words
        if word not in stopwords and len(word) > 1
    ]

    # 统计词频
    word_counts = Counter(filtered_words).most_common(20)

    # 创建DataFrame
    words_df = pd.DataFrame(word_counts, columns=['词语', '频次'])

    # 创建柱状图
    fig = px.bar(
        words_df,
        x='词语',
        y='频次',
        title="关键词频率统计 TOP20",
        color='频次',
        color_continuous_scale='Blues'
    )
    fig.update_layout(xaxis_tickangle=-45)

    return fig, words_df
⚡ 性能优化策略
1. 数据缓存机制
python
@st.cache_data
def load_data():
    """缓存数据加载"""
    raw_data = pd.read_csv('tourism_raw_data.csv')
    feature_data = pd.read_csv('tourism_feature_data.csv')
    return raw_data, feature_data

@st.cache_resource
def train_model(feature_data):
    """缓存模型训练"""
    # 模型训练代码
    # ...
return model缓存策略说明:
@st.cache_data:用于缓存数据加载操作@st.cache_resource:用于缓存资源密集型操作(如模型训练)- 避免重复计算,显著提升应用响应速度
2. 条件导入处理
python
# 优雅处理可选依赖
try:
    from wordcloud import WordCloud
    WORDCLOUD_AVAILABLE = True
except ImportError:
    WORDCLOUD_AVAILABLE = False
    st.warning("WordCloud 库未安装,词云功能将不可用。")
3. 异步加载策略
python
def lazy_load_components():
    """延迟加载组件"""
    if 'model_trained' not in st.session_state:
        with st.spinner('正在训练模型...'):
            st.session_state.model_trained = train_model(feature_data)

    return st.session_state.model_trained
🔧 容错处理与用户体验
1. 错误处理机制
python
def safe_execute(func, error_msg="操作失败"):
    """安全执行函数"""
    try:
        return func()
    except Exception as e:
        st.error(f"{error_msg}: {str(e)}")
        return None
2. 用户反馈系统
python
def show_loading_progress():
    """显示加载进度"""
    progress_bar = st.progress(0)
    status_text = st.empty()

    for i in range(100):
        progress_bar.progress(i + 1)
        status_text.text(f'加载中... {i+1}%')
        time.sleep(0.01)

    status_text.text('加载完成!')
3. 响应式设计
python
def create_responsive_layout():
    """创建响应式布局"""
    # 根据屏幕宽度调整列数
    if st.session_state.get('mobile_view', False):
        col1, col2 = st.columns(1), st.columns(1)
    else:
        col1, col2 = st.columns(2)
📦 部署与配置
1. 依赖管理
txt
# requirements.txt
streamlit
pandas
numpy
plotly
pydeck
matplotlib
scikit-learn
Pillow
wordcloud
collections-extended
2. 启动脚本
bash
#!/bin/bash
# run_app.sh
echo "启动旅游数据分析系统..."
streamlit run streamlit_integrated_app.py --server.port 8501
3. Docker部署(可选)
dockerfile
FROM python:3.9-slim

WORKDIR /app
COPY requirements.txt .
RUN pip install -r requirements.txt

COPY . .
EXPOSE 8501

CMD ["streamlit", "run", "streamlit_integrated_app.py"]
🚀 项目运行指南
环境准备
bash
# 1. 克隆项目
git clone <repository-url>
cd tourism-analysis-system

# 2. 安装依赖
pip install -r requirements.txt

# 3. 准备数据文件
# 确保以下文件存在:
# - tourism_raw_data.csv
# - tourism_feature_data.csv
# - map_copy.png (可选)

# 4. 启动应用
streamlit run streamlit_integrated_app.py
使用流程
- 数据概览:查看整体数据情况
- 可视化分析:深入分析各维度数据
- 销量预测:选择景点进行销量预测
- 地理分析:查看景点地理分布
- 文本挖掘:分析景点描述特征
📊 技术特色与创新点
1. 模块化设计
- 清晰的功能分离
- 可扩展的架构设计
- 易于维护和升级
2. 用户体验优化
- 直观的导航设计
- 丰富的交互功能
- 美观的视觉效果
3. 性能优化
- 智能缓存机制
- 异步加载策略
- 资源使用优化
4. 容错能力
- 优雅的错误处理
- 依赖包兼容性处理
- 用户友好的提示信息
🔮 未来扩展方向
1. 功能扩展
- 添加时间序列分析
- 集成更多ML算法对比
- 支持数据导出功能
- 添加用户管理系统
2. 技术优化
- 数据库集成
- 实时数据更新
- 移动端适配优化
- 性能监控系统
3. 业务拓展
- 多数据源集成
- 定制化报告生成
- API接口开发
- 第三方系统集成
💡 经验总结
技术选型心得
- Streamlit vs Flask/Django:对于数据分析应用,Streamlit的开发效率更高
- Plotly vs Matplotlib:Plotly的交互性更好,用户体验更佳
- 缓存策略:合理使用缓存可以显著提升应用性能
开发最佳实践
- 模块化开发:将功能拆分为独立模块,便于维护
- 错误处理:预见性地处理各种异常情况
- 用户体验:始终从用户角度考虑界面设计
- 性能优化:在开发初期就考虑性能问题
项目管理经验
- 版本控制:使用Git进行代码版本管理
- 文档编写:详细的文档是项目成功的关键
- 测试策略:多环境测试确保应用稳定性
- 用户反馈:及时收集和处理用户反馈
🎯 总结
本项目成功实现了一个完整的旅游数据分析与预测系统,集成了数据可视化、机器学习预测、地理分析和文本挖掘等多个功能模块。通过现代化的Web界面设计和优化的用户体验,为旅游行业的数据分析提供了一个实用的解决方案。
项目亮点:
- 🏗️ 完整的技术栈:从数据处理到模型部署的全流程实现
- 🎨 现代化界面:美观、直观、易用的Web界面
- ⚡ 高性能设计:缓存机制和性能优化策略
- 🔧 容错能力强:完善的错误处理和用户提示
- 📈 实用价值高:真实业务场景的完整解决方案
这个项目不仅展示了Python在数据分析和Web开发方面的强大能力,也为类似的数据分析应用提供了一个很好的参考模板。希望本文的详细介绍能够帮助读者理解现代数据分析应用的开发流程和技术要点。