前言:
在开发 内存监控工具 或类似中间件时,我们通常会面临两个需求:
1. SDK 供开发者集成使用
- 功能封装:SDK 封装了完整的内存监控功能,包括数据采集、分析、报告生成等
- 通用性:支持多种环境(浏览器、Node.js、现代前端工具链)
- 易集成 :开发者只需
import MemoryMonitor from 'memory-monitor-sdk'即可开始使用 - 类型安全:提供完整的 TypeScript 类型定义,支持智能提示和类型检查
2. 独立 HTML 可视化页面
- 数据展示:提供直观的图表和统计信息,让开发者快速了解内存使用情况
- 交互功能:支持文件上传、数据导出、实时图表展示等
- 独立运行:不依赖特定项目环境,可直接在浏览器中打开使用
- 演示效果:方便向团队展示监控工具的效果和价值
为什么同时做 SDK 和 HTML 可视化页面?
- 解耦设计:SDK 专注数据采集和业务逻辑,HTML 页面专注数据展示和用户体验
- 复用性高:SDK 可以在多个项目中复用,HTML 页面可以直接演示效果
- 快速迭代:独立 HTML 页面方便测试和演示,加速开发流程
- 用户体验友好:开发者可以直接通过浏览器查看监控结果,降低上手门槛
- 完整解决方案:从数据采集到结果展示,提供端到端的解决方案
核心思想 :SDK 是"数据采集引擎",HTML 页面是"结果可视化前端"。两者结合,可以同时满足 集成开发 和 结果展示 的需求。
一、项目架构设计
1. 项目结构
memory-monitor-sdk/
├── src/
│   ├── index.ts              # SDK 入口文件
│   ├── memory-monitor.ts     # 核心监控类
│   └── index.html            # 可视化页面
├── dist/                     # 构建输出目录
│   ├── memory-monitor.es.js  # ES 模块格式
│   ├── memory-monitor.umd.js # UMD 格式
│   ├── memory-monitor.cjs.js # CommonJS 格式
│   ├── memory-monitor.d.ts   # 类型定义文件
│   └── index.html            # 压缩后的可视化页面
├── package.json              # 项目配置
├── tsconfig.json             # TypeScript 配置
└── vite.config.ts            # Vite 构建配置
└── README.md     # 使用说明文档
2. 核心功能模块
(1) SDK 核心功能:
- 内存使用情况实时监控
- 峰值变化检测和告警
- 页面路由跟踪
- 数据持久化和导出
- 详细的报告生成
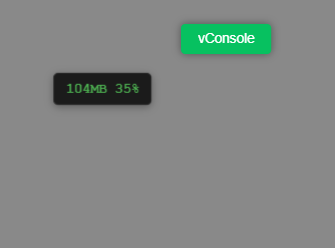
- 可拖拽的 DOM 显示面板
typescript
/**
* 内存监控工具
* 用于检测内存泄漏和性能问题(主要在 PC 上调试,模拟手机环境)
*/
declare const getCurrentPages: any; // 临时声明,TS 不报错
interface MemoryInfo {
usedJSHeapSize: number
totalJSHeapSize: number
jsHeapSizeLimit: number
}
class MemoryMonitor {
private static instance: MemoryMonitor
private memoryLogs: Map<number, MemoryInfo> = new Map()
private intervalId: any = null
private lastMemoryMB: number = 0
private peakThresholdMB: number = 20 // 峰值变化阈值(MB)
private appStartTime: number = Date.now() // 应用启动时间
private currentPage: string = 'unknown' // 当前页面
private pageHistory: Map<number, string> = new Map() // 页面历史记录
private memoryPageLogs: Map<number, string> = new Map() // 内存记录时的页面信息
// 模拟手机内存上限(默认 300MB)
private SIMULATED_LIMIT_MB = 300
// DOM 显示相关
private displayElement: HTMLElement | null = null
private isDisplayVisible: boolean = false
private shouldShowDisplay: boolean = false
static getInstance(): MemoryMonitor {
if (!MemoryMonitor.instance) {
MemoryMonitor.instance = new MemoryMonitor()
}
return MemoryMonitor.instance
}
/**
* 开始监控内存使用情况
* @param intervalMs 监控间隔(毫秒,默认2秒)
* @param simulatedLimitMB 模拟手机内存上限(默认 300MB)
* @param peakThresholdMB 峰值变化阈值(MB,默认20MB)
* @param showDisplay 是否显示DOM面板(开发环境默认true)
*/
startMonitoring(intervalMs: number = 2000, simulatedLimitMB: number = 300, peakThresholdMB: number = 20, showDisplay: boolean = true) {
if (this.intervalId) {
clearInterval(this.intervalId)
}
this.SIMULATED_LIMIT_MB = simulatedLimitMB
this.peakThresholdMB = peakThresholdMB
this.appStartTime = Date.now() // 重置启动时间
// 存储显示设置,在第一次采集时创建DOM
this.shouldShowDisplay = showDisplay && process.env.NODE_ENV === 'development'
this.intervalId = setInterval(() => {
this.logMemoryUsage()
}, intervalMs)
console.log(`🔍 内存监控已启动(采样间隔: ${intervalMs}ms,模拟上限: ${this.SIMULATED_LIMIT_MB}MB,峰值阈值: ${peakThresholdMB}MB)`)
if (this.shouldShowDisplay) {
console.log('📱 DOM面板将在首次采集到内存数据时创建')
}
}
/**
* 设置当前页面
* @param pageName 页面名称
*/
setCurrentPage(pageName: string) {
this.currentPage = pageName
// 记录页面变化历史
this.pageHistory.set(Date.now(), pageName)
// 只保留最近100条页面记录
if (this.pageHistory.size > 100) {
const oldestKey = Math.min(...this.pageHistory.keys())
this.pageHistory.delete(oldestKey)
}
}
/**
* 获取应用运行时长(分钟)
*/
private getAppRuntimeMinutes(): number {
return Math.round((Date.now() - this.appStartTime) / 1000 / 60)
}
/**
* 获取应用运行时长(秒)
*/
private getAppRuntimeSeconds(): number {
return Math.round((Date.now() - this.appStartTime) / 1000)
}
/**
* 格式化运行时长显示
*/
private formatRuntime(): string {
const totalSeconds = this.getAppRuntimeSeconds()
const minutes = Math.floor(totalSeconds / 60)
const seconds = totalSeconds % 60
return `${minutes}分${seconds}秒`
}
/**
* 获取当前页面信息
*/
private getCurrentPageInfo(): string {
// 尝试从不同来源获取页面信息
if (typeof window !== 'undefined') {
// 浏览器环境
if (window.location) {
const pagePath = window.location.pathname || window.location.href
if (pagePath !== this.currentPage) {
this.currentPage = pagePath
// 记录页面变化
this.pageHistory.set(Date.now(), pagePath)
}
return pagePath
}
// uni-app 环境
if (typeof getCurrentPages === 'function') {
const pages = getCurrentPages()
if (pages.length > 0) {
const currentPage = pages[pages.length - 1]
const pageRoute = (currentPage as any).route || (currentPage as any).$page?.route || 'unknown'
if (pageRoute !== this.currentPage) {
this.currentPage = pageRoute
// 记录页面变化
this.pageHistory.set(Date.now(), pageRoute)
}
return pageRoute
}
}
}
return this.currentPage
}
/**
* 获取指定时间点的页面信息
* @param timestamp 时间戳
*/
private getPageAtTime(timestamp: number): string {
// 优先从内存记录时的页面信息中获取
if (this.memoryPageLogs.has(timestamp)) {
return this.memoryPageLogs.get(timestamp) || 'unknown'
}
// 如果没有精确匹配,查找最接近的页面记录
const pageKeys = Array.from(this.pageHistory.keys()).sort()
let closestPage = this.currentPage
for (let i = 0; i < pageKeys.length; i++) {
if (pageKeys[i] <= timestamp) {
closestPage = this.pageHistory.get(pageKeys[i]) || this.currentPage
} else {
break
}
}
return closestPage
}
/**
* 停止监控
*/
stopMonitoring() {
if (this.intervalId) {
clearInterval(this.intervalId)
this.intervalId = null
}
this.removeDisplayElement()
console.log('⏹️ 内存监控已停止')
}
/**
* 创建DOM显示元素
*/
private createDisplayElement() {
if (typeof window === 'undefined' || this.displayElement) {
return
}
// 创建主容器
const container = document.createElement('div')
container.id = 'memory-monitor-display'
container.style.cssText = `
position: fixed;
top: 20px;
right: 20px;
z-index: 9999;
background: rgba(0, 0, 0, 0.8);
color: #fff;
font-family: 'Courier New', monospace;
font-size: 14px;
border-radius: 6px;
padding: 8px 12px;
box-shadow: 0 2px 8px rgba(0, 0, 0, 0.3);
backdrop-filter: blur(10px);
border: 1px solid rgba(255, 255, 255, 0.1);
user-select: none;
cursor: move;
transition: all 0.3s ease;
`
// 创建内容区域
const content = document.createElement('div')
content.id = 'memory-monitor-content'
content.style.cssText = `
text-align: center;
font-weight: bold;
`
// 添加到页面
container.appendChild(content)
document.body.appendChild(container)
this.displayElement = container
this.isDisplayVisible = true
// 添加拖拽功能
this.addDragFunctionality(container, container)
}
/**
* 移除DOM显示元素
*/
private removeDisplayElement() {
if (this.displayElement && this.displayElement.parentNode) {
// 清理拖拽事件监听器
const dragListeners = (this.displayElement as any)._dragListeners
if (dragListeners) {
// 清理鼠标事件
dragListeners.handle.removeEventListener('mousedown', dragListeners.onMouseDown)
document.removeEventListener('mousemove', dragListeners.onMouseMove)
document.removeEventListener('mouseup', dragListeners.onMouseUp)
// 清理触摸事件
dragListeners.handle.removeEventListener('touchstart', dragListeners.onTouchStart)
document.removeEventListener('touchmove', dragListeners.onTouchMove)
document.removeEventListener('touchend', dragListeners.onTouchEnd)
}
this.displayElement.parentNode.removeChild(this.displayElement)
this.displayElement = null
this.isDisplayVisible = false
}
}
/**
* 添加拖拽功能(支持移动端触摸)
*/
private addDragFunctionality(element: HTMLElement, handle: HTMLElement) {
let isDragging = false
let startX = 0
let startY = 0
let startLeft = 0
let startTop = 0
// 设置拖拽句柄样式
handle.style.cursor = 'move'
handle.style.userSelect = 'none'
handle.style.touchAction = 'none' // 禁用默认触摸行为
// 开始拖拽
const startDrag = (clientX: number, clientY: number) => {
isDragging = true
startX = clientX
startY = clientY
const rect = element.getBoundingClientRect()
startLeft = rect.left
startTop = rect.top
// 添加拖拽时的样式
element.style.transition = 'none'
// 添加拖拽状态类名,用于CSS选择器
element.classList.add('memory-monitor-dragging')
}
// 拖拽移动
const dragMove = (clientX: number, clientY: number) => {
if (!isDragging) return
const deltaX = clientX - startX
const deltaY = clientY - startY
element.style.left = (startLeft + deltaX) + 'px'
element.style.top = (startTop + deltaY) + 'px'
element.style.right = 'auto'
}
// 结束拖拽
const endDrag = () => {
if (isDragging) {
isDragging = false
// 恢复过渡效果
element.style.transition = 'all 0.3s ease'
// 移除拖拽状态类名
element.classList.remove('memory-monitor-dragging')
}
}
// 鼠标事件(桌面端)
const onMouseDown = (e: MouseEvent) => {
// 只有左键点击才开始拖拽
if (e.button === 0) {
startDrag(e.clientX, e.clientY)
// 只阻止默认行为,不阻止事件冒泡
e.preventDefault()
}
}
const onMouseMove = (e: MouseEvent) => {
if (isDragging) {
dragMove(e.clientX, e.clientY)
e.preventDefault()
}
}
const onMouseUp = (e: MouseEvent) => {
if (isDragging) {
endDrag()
e.preventDefault()
}
}
// 触摸事件(移动端)
const onTouchStart = (e: TouchEvent) => {
if (e.touches.length === 1) {
const touch = e.touches[0]
startDrag(touch.clientX, touch.clientY)
// 只阻止默认行为,不阻止事件冒泡
e.preventDefault()
}
}
const onTouchMove = (e: TouchEvent) => {
if (isDragging && e.touches.length === 1) {
const touch = e.touches[0]
dragMove(touch.clientX, touch.clientY)
e.preventDefault()
}
}
const onTouchEnd = (e: TouchEvent) => {
if (isDragging) {
endDrag()
e.preventDefault()
}
}
// 绑定事件
handle.addEventListener('mousedown', onMouseDown)
handle.addEventListener('touchstart', onTouchStart)
document.addEventListener('mousemove', onMouseMove)
document.addEventListener('touchmove', onTouchMove, { passive: false })
document.addEventListener('mouseup', onMouseUp)
document.addEventListener('touchend', onTouchEnd)
// 存储事件监听器以便后续清理
;(element as any)._dragListeners = {
onMouseDown,
onMouseMove,
onMouseUp,
onTouchStart,
onTouchMove,
onTouchEnd,
handle
}
}
/**
* 更新DOM显示内容
*/
private updateDisplayContent(usedMB: number, totalMB: number, usagePercent: number, warningLevel: string, message: string) {
if (!this.displayElement || !this.isDisplayVisible) {
return
}
const content = this.displayElement.querySelector('#memory-monitor-content')
if (!content) return
// 根据警告级别设置颜色
let statusColor = '#4CAF50' // 正常 - 绿色
switch (warningLevel) {
case 'danger':
statusColor = '#F44336' // 危险 - 红色
break
case 'warning':
statusColor = '#FF9800' // 警告 - 橙色
break
case 'caution':
statusColor = '#FFC107' // 注意 - 黄色
break
case 'peak':
statusColor = '#9C27B0' // 峰值 - 紫色
break
}
// content.innerHTML = `
// <div style="color: ${statusColor};">
// ${usedMB}MB / ${this.SIMULATED_LIMIT_MB}MB
// </div>
// <div style="color: ${statusColor}; font-size: 12px; margin-top: 2px;">
// ${usagePercent}%
// </div>
// `
content.innerHTML = `
<div style="color: ${statusColor};">
${usedMB}MB ${usagePercent}%
</div>
`
}
/**
* 记录当前内存使用情况
*/
private async logMemoryUsage() {
const timestamp = Date.now()
let usedMB = 0
let totalMB = 0
let limitMB = this.SIMULATED_LIMIT_MB
let usagePercent = 0
try {
// 桌面 Chrome 才能获取 performance.memory
if ("memory" in performance) {
const memory = (performance as any).memory as MemoryInfo
usedMB = Math.round(memory.usedJSHeapSize / 1024 / 1024)
totalMB = Math.round(memory.totalJSHeapSize / 1024 / 1024)
usagePercent = Math.round((usedMB / limitMB) * 100)
// 使用Map存储,自动去重时间戳
this.memoryLogs.set(timestamp, memory)
// 同时记录当前页面信息
const currentPage = this.getCurrentPageInfo()
this.memoryPageLogs.set(timestamp, currentPage)
} else {
console.warn("⚠️ 当前环境不支持 JS 内存检测,仅支持 PC Chrome")
return
}
} catch (err) {
console.error("内存检测失败:", err)
return
}
// 只保留最近100条记录,使用Map的size属性
if (this.memoryLogs.size > 100) {
const oldestKey = Math.min(...this.memoryLogs.keys())
this.memoryLogs.delete(oldestKey)
this.memoryPageLogs.delete(oldestKey)
}
// 检测峰值变化(跳过第一次检测,因为这是基准值)
const memoryChange = this.lastMemoryMB === 0 ? 0 : Math.abs(usedMB - this.lastMemoryMB)
const isPeakChange = this.lastMemoryMB !== 0 && memoryChange >= this.peakThresholdMB
// 状态判断
let warningLevel = "normal"
let emoji = "🟢"
let message = "正常!内存使用率健康,无需担心!"
let shouldLog = false
if (usagePercent >= 80) {
warningLevel = "danger"
emoji = "🚨"
message = "危险!内存使用率过高,立即处理!"
shouldLog = true
} else if (usagePercent >= 60) {
warningLevel = "warning"
emoji = "⚠️"
message = "警告!内存使用率较高,需要优化!"
shouldLog = true
} else if (usagePercent >= 40) {
warningLevel = "caution"
emoji = "🟡"
message = "注意!内存使用率中等,开始监控!"
shouldLog = false
}
// 峰值变化检测
if (isPeakChange) {
shouldLog = true
if (warningLevel === "normal") {
warningLevel = "peak"
emoji = "📈"
message = `峰值变化!内存使用变化 ${memoryChange}MB,可能存在大量对象创建`
}
}
// 更新DOM显示(开发环境)
if (this.isDisplayVisible) {
this.updateDisplayContent(usedMB, totalMB, usagePercent, warningLevel, message)
} else if (this.shouldShowDisplay && !this.displayElement) {
// 第一次采集到数据时创建DOM元素
this.createDisplayElement()
this.updateDisplayContent(usedMB, totalMB, usagePercent, warningLevel, message)
}
// 只在需要时打印日志
if (shouldLog) {
const logMethod =
warningLevel === "danger" ? "error" :
warningLevel === "warning" ? "warn" :
warningLevel === "peak" ? "warn" :
"log"
const runtimeFormatted = this.formatRuntime()
const currentPage = this.getCurrentPageInfo()
const logData: any = {
used: `${usedMB}MB`,
total: `${totalMB}MB`,
limit: `${limitMB}MB (模拟手机上限)`,
usage: `${usagePercent}%`,
status: message,
level: warningLevel,
runtime: runtimeFormatted,
page: currentPage
}
if (isPeakChange) {
logData.change = `+${memoryChange}MB`
logData.timestamp = new Date(timestamp).toLocaleTimeString()
}
console[logMethod](`${emoji} 内存使用情况:`, logData)
// 内存过高时自动生成详细报告
if (warningLevel === "danger" || warningLevel === "warning") {
const reportTitle = warningLevel === "danger" ? '🚨 内存危险 - 自动生成详细报告' : '⚠️ 内存警告 - 自动生成详细报告'
console.group(reportTitle)
this.generateDetailedReport(warningLevel)
console.groupEnd()
}
}
// 更新上次内存值
this.lastMemoryMB = usedMB
}
/**
* 获取内存使用趋势
*/
getMemoryTrend() {
if (this.memoryLogs.size < 2) {
return { trend: 'insufficient_data', message: '数据不足,无法分析趋势' }
}
const sortedKeys = Array.from(this.memoryLogs.keys()).sort()
const first = this.memoryLogs.get(sortedKeys[0])!
const last = this.memoryLogs.get(sortedKeys[sortedKeys.length - 1])!
if (first.usedJSHeapSize === 0) {
return { trend: 'insufficient_data', message: '初始内存为0,无法分析趋势' }
}
const growth = last.usedJSHeapSize - first.usedJSHeapSize
const growthPercent = (growth / first.usedJSHeapSize) * 100
if (growthPercent > 10) {
return {
trend: 'increasing',
message: `内存使用增长 ${growthPercent.toFixed(2)}%,可能存在内存泄漏`,
growth: `${Math.round(growth / 1024 / 1024)}MB`
}
} else if (growthPercent < -5) {
return {
trend: 'decreasing',
message: `内存使用减少 ${Math.abs(growthPercent).toFixed(2)}%`,
growth: `${Math.round(growth / 1024 / 1024)}MB`
}
} else {
return {
trend: 'stable',
message: `内存使用稳定,变化 ${growthPercent.toFixed(2)}%`,
growth: `${Math.round(growth / 1024 / 1024)}MB`
}
}
}
/**
* 生成内存报告
*/
generateReport() {
const trend = this.getMemoryTrend()
const sortedKeys = Array.from(this.memoryLogs.keys()).sort()
const currentMemory = sortedKeys.length > 0 ? this.memoryLogs.get(sortedKeys[sortedKeys.length - 1]) : null
console.group('📋 内存监控报告')
console.log('当前内存使用:', currentMemory ? {
used: `${Math.round(currentMemory.usedJSHeapSize / 1024 / 1024)}MB`,
total: `${Math.round(currentMemory.totalJSHeapSize / 1024 / 1024)}MB`,
limit: `${this.SIMULATED_LIMIT_MB}MB (模拟手机上限)`
} : '无数据')
console.log('内存趋势:', trend.message)
console.groupEnd()
return {
currentMemory,
trend
}
}
/**
* 生成详细报告(包含运行时长、页面信息、峰值变化等)
* @param level 报告级别:'warning' | 'danger'
*/
generateDetailedReport(level: 'warning' | 'danger' = 'warning') {
const trend = this.getMemoryTrend()
const sortedKeys = Array.from(this.memoryLogs.keys()).sort()
const currentMemory = sortedKeys.length > 0 ? this.memoryLogs.get(sortedKeys[sortedKeys.length - 1]) : null
const peakChanges = this.getPeakChanges()
const runtimeFormatted = this.formatRuntime()
const currentPage = this.getCurrentPageInfo()
// 根据级别选择不同的日志方法和图标
const logMethod = level === 'danger' ? 'error' : 'warn'
const statusIcon = level === 'danger' ? '🚨' : '⚠️'
const currentUsedMB = currentMemory ? Math.round(currentMemory.usedJSHeapSize / 1024 / 1024) : 0
const currentTotalMB = currentMemory ? Math.round(currentMemory.totalJSHeapSize / 1024 / 1024) : 0
const currentUsagePercent = Math.round((currentUsedMB / this.SIMULATED_LIMIT_MB) * 100)
console[logMethod](`${statusIcon} 应用运行状态:`, {
// 应用运行信息
runtime: runtimeFormatted,
currentPage: currentPage,
startTime: new Date(this.appStartTime).toLocaleString(),
// 当前内存状态
memory: {
used: `${currentUsedMB}MB`,
total: `${currentTotalMB}MB`,
limit: `${this.SIMULATED_LIMIT_MB}MB (模拟手机上限)`,
usage: `${currentUsagePercent}%`,
status: level === 'danger' ? '危险' : '警告'
}
})
console[logMethod](`${statusIcon} 内存趋势分析:`, trend.message)
if (peakChanges.length > 0) {
console[logMethod](`${statusIcon} 峰值变化记录:`, peakChanges.map(change => ({
time: change.timeFromStart,
runtime: change.runtimeFromStart,
page: change.page,
change: `${change.change > 0 ? '+' : ''}${change.change}MB`,
memory: `${change.memory}MB`
})))
} else {
console.log('✅ 无显著峰值变化')
}
// 所有内存采样记录
const recentLogs = sortedKeys.map(key => {
const memory = this.memoryLogs.get(key)!
const page = this.memoryPageLogs.get(key) || 'unknown'
// 计算从应用启动到该记录的时间
const runtimeFromStartMs = key - this.appStartTime
const runtimeMinutes = Math.floor(runtimeFromStartMs / 1000 / 60)
const runtimeSeconds = Math.floor((runtimeFromStartMs % (1000 * 60)) / 1000)
const runtimeFromStart = `${runtimeMinutes}分${runtimeSeconds}秒`
return {
time: new Date(key).toLocaleTimeString(),
runtime: runtimeFromStart,
page: page,
used: `${Math.round(memory.usedJSHeapSize / 1024 / 1024)}MB`
}
})
console[logMethod](`${statusIcon} 内存采样记录:`, recentLogs)
// 添加保存数据提示
console.log('💾 保存数据命令: memoryMonitor.saveDataToFile()')
console.log('📊 可视化命令: 打开 memory-data/index.html 查看图表')
return {
runtime: runtimeFormatted,
currentPage,
currentMemory,
trend,
peakChanges,
recentLogs,
level
}
}
/**
* 保存数据到JSON文件
*/
async saveDataToFile() {
try {
const sortedKeys = Array.from(this.memoryLogs.keys()).sort()
const data = sortedKeys.map(key => {
const memory = this.memoryLogs.get(key)!
const page = this.memoryPageLogs.get(key) || 'unknown'
const usedMB = Math.round(memory.usedJSHeapSize / 1024 / 1024)
const totalMB = Math.round(memory.totalJSHeapSize / 1024 / 1024)
// 计算从应用启动到该记录的时间
const runtimeFromStartMs = key - this.appStartTime
const runtimeMinutes = Math.floor(runtimeFromStartMs / 1000 / 60)
const runtimeSeconds = Math.floor((runtimeFromStartMs % (1000 * 60)) / 1000)
const runtimeFromStart = `${runtimeMinutes}:${runtimeSeconds.toString().padStart(2, '0')}`
return {
timestamp: key,
time: new Date(key).toLocaleTimeString(),
runtime: runtimeFromStart,
page: page,
used: usedMB,
total: totalMB,
usage: Math.round((usedMB / this.SIMULATED_LIMIT_MB) * 100)
}
})
const sessionData = {
sessionId: this.generateSessionId(),
startTime: this.appStartTime,
endTime: Date.now(),
duration: this.formatRuntime(),
totalSamples: data.length,
peakChanges: this.getPeakChanges(),
trend: this.getMemoryTrend(),
data: data,
config: {
simulatedLimitMB: this.SIMULATED_LIMIT_MB,
peakThresholdMB: this.peakThresholdMB
}
}
// 在浏览器环境中,使用下载方式保存文件
if (typeof window !== 'undefined') {
const blob = new Blob([JSON.stringify(sessionData, null, 2)], { type: 'application/json' })
const url = URL.createObjectURL(blob)
const a = document.createElement('a')
a.href = url
a.download = `memory-data-${sessionData.sessionId}.json`
document.body.appendChild(a)
a.click()
document.body.removeChild(a)
URL.revokeObjectURL(url)
console.log(`💾 内存数据已保存: memory-data-${sessionData.sessionId}.json`)
console.log(`📊 包含 ${data.length} 个采样点,运行时长 ${sessionData.duration}`)
}
return sessionData
} catch (error) {
console.error('保存数据失败:', error)
return null
}
}
/**
* 生成会话ID
*/
private generateSessionId(): string {
const now = new Date()
const dateStr = now.toISOString().slice(0, 19).replace(/[-:T]/g, '')
const randomStr = Math.random().toString(36).substr(2, 6)
return `${dateStr}_${randomStr}`
}
/**
* 判断是否需要保存数据
* 只要有数据记录就保存
*/
shouldSaveData(): boolean {
// 只要有数据记录就保存
return this.memoryLogs.size > 0
}
/**
* 清理监控数据
*/
clearLogs() {
this.memoryLogs.clear()
this.memoryPageLogs.clear()
this.pageHistory.clear()
this.lastMemoryMB = 0
this.appStartTime = Date.now() // 重置启动时间
console.log('🧹 监控数据已清理')
}
/**
* 手动显示DOM面板
*/
showDisplay() {
if (process.env.NODE_ENV === 'development') {
this.createDisplayElement()
}
}
/**
* 手动隐藏DOM面板
*/
hideDisplay() {
this.removeDisplayElement()
}
/**
* 切换DOM面板显示状态
*/
toggleDisplayPanel() {
if (this.isDisplayVisible) {
this.hideDisplay()
} else {
this.showDisplay()
}
}
/**
* 获取峰值变化记录
*/
getPeakChanges() {
const changes: Array<{
timestamp: number;
change: number;
memory: number;
runtimeFromStart: string;
page: string;
timeFromStart: string;
}> = []
const sortedKeys = Array.from(this.memoryLogs.keys()).sort()
for (let i = 1; i < sortedKeys.length; i++) {
const prevKey = sortedKeys[i - 1]
const currKey = sortedKeys[i]
const prevMemory = this.memoryLogs.get(prevKey)!
const currMemory = this.memoryLogs.get(currKey)!
const change = Math.round((currMemory.usedJSHeapSize - prevMemory.usedJSHeapSize) / 1024 / 1024)
// 只记录增加20MB以上的变化,不记录减少的变化
if (change >= 20) {
// 计算从应用启动到峰值变化的时间
const runtimeFromStartMs = currKey - this.appStartTime
const runtimeMinutes = Math.floor(runtimeFromStartMs / 1000 / 60)
const runtimeSeconds = Math.floor((runtimeFromStartMs % (1000 * 60)) / 1000)
const runtimeFromStart = `${runtimeMinutes}分${runtimeSeconds}秒`
// 获取当时所在页面
const page = this.getPageAtTime(currKey)
// 格式化时间显示
const timeFromStart = new Date(currKey).toLocaleTimeString()
changes.push({
timestamp: currKey,
change,
memory: Math.round(currMemory.usedJSHeapSize / 1024 / 1024),
runtimeFromStart,
page,
timeFromStart
})
}
}
return changes
}
}
// 导出单例实例
export const memoryMonitor = MemoryMonitor.getInstance()
// 在开发环境下自动启动监控
if (process.env.NODE_ENV === 'development') {
setTimeout(() => {
// 开发环境:3秒监控一次,适合快速发现问题,并显示DOM面板
memoryMonitor.clearLogs()
memoryMonitor.startMonitoring(3000, 300, 20, true) // 显示DOM面板
// 显示使用提示
console.log('🔍 内存监控已启动!')
console.log('📱 DOM面板已创建(右上角浮动面板)')
console.log('💾 手动保存: memoryMonitor.saveDataToFile()')
console.log('📊 查看图表: 打开 memory-data/index.html')
console.log('📋 生成报告: memoryMonitor.generateDetailedReport()')
console.log('ℹ️ 自动保存条件: 内存使用率≥40% | 峰值变化 | 增长趋势 | 运行≥5分钟 | 内存≥150MB')
}, 1000)
// 页面刷新前自动保存数据(仅在检测到问题时)
// if (typeof window !== 'undefined') {
// window.addEventListener('beforeunload', () => {
// // 检查是否有问题需要保存数据
// if (memoryMonitor.shouldSaveData()) {
// memoryMonitor.saveDataToFile()
// }
// })
// }
}
(window as any).MemoryMonitor = MemoryMonitor;
export default memoryMonitor(2) HTML 可视化功能:
- 基于 ECharts 的图表展示
- 多文件数据加载
- 统计信息展示
- 数据导出功能
- 响应式设计
html
<!DOCTYPE html>
<html lang="zh-CN">
<head>
<meta charset="UTF-8">
<meta name="viewport" content="width=device-width, initial-scale=1.0">
<title>内存监控数据可视化</title>
<script src="https://cdn.jsdelivr.net/npm/echarts@5.4.3/dist/echarts.min.js"></script>
<style>
* {
margin: 0;
padding: 0;
box-sizing: border-box;
}
body {
font-family: 'Segoe UI', Tahoma, Geneva, Verdana, sans-serif;
background: linear-gradient(135deg, #667eea 0%, #764ba2 100%);
min-height: 100vh;
padding: 20px;
}
.container {
max-width: 1400px;
margin: 0 auto;
background: white;
border-radius: 15px;
box-shadow: 0 20px 40px rgba(0,0,0,0.1);
overflow: hidden;
}
.header {
background: linear-gradient(135deg, #667eea 0%, #764ba2 100%);
color: white;
padding: 30px;
text-align: center;
}
.header h1 {
font-size: 2.5em;
margin-bottom: 10px;
font-weight: 300;
}
.header p {
font-size: 1.1em;
opacity: 0.9;
}
.controls {
padding: 20px 30px;
background: #f8f9fa;
border-bottom: 1px solid #e9ecef;
display: flex;
gap: 15px;
align-items: center;
flex-wrap: wrap;
}
.file-input-wrapper {
position: relative;
display: inline-block;
}
.file-input {
display: none;
}
.file-input-label {
background: #007bff;
color: white;
padding: 10px 20px;
border-radius: 8px;
cursor: pointer;
transition: all 0.3s ease;
display: inline-block;
font-weight: 500;
}
.file-input-label:hover {
background: #0056b3;
transform: translateY(-2px);
}
.btn {
background: #28a745;
color: white;
border: none;
padding: 10px 20px;
border-radius: 8px;
cursor: pointer;
font-size: 14px;
font-weight: 500;
transition: all 0.3s ease;
}
.btn:hover {
background: #218838;
transform: translateY(-2px);
}
.btn-secondary {
background: #6c757d;
}
.btn-secondary:hover {
background: #5a6268;
}
.info-panel {
background: #e3f2fd;
padding: 15px;
border-radius: 8px;
margin-left: auto;
min-width: 200px;
}
.info-item {
display: flex;
justify-content: space-between;
margin-bottom: 5px;
}
.info-label {
font-weight: 600;
color: #1976d2;
}
.info-value {
color: #333;
}
.chart-container {
padding: 30px;
}
.chart-title {
font-size: 1.5em;
margin-bottom: 20px;
color: #333;
text-align: center;
}
.chart-wrapper {
width: 100%;
height: 500px;
border: 1px solid #e9ecef;
border-radius: 8px;
padding: 20px;
background: #fafafa;
}
.stats-grid {
display: grid;
grid-template-columns: repeat(auto-fit, minmax(250px, 1fr));
gap: 20px;
margin-bottom: 30px;
}
.stat-card {
background: white;
padding: 20px;
border-radius: 10px;
box-shadow: 0 4px 6px rgba(0,0,0,0.1);
border-left: 4px solid #007bff;
}
.stat-title {
font-size: 0.9em;
color: #666;
margin-bottom: 10px;
text-transform: uppercase;
letter-spacing: 1px;
}
.stat-value {
font-size: 2em;
font-weight: bold;
color: #333;
margin-bottom: 5px;
}
.stat-subtitle {
font-size: 0.8em;
color: #999;
}
.no-data {
text-align: center;
padding: 60px 20px;
color: #666;
}
.no-data-icon {
font-size: 4em;
margin-bottom: 20px;
}
.loading {
text-align: center;
padding: 40px;
color: #666;
}
.spinner {
border: 4px solid #f3f3f3;
border-top: 4px solid #007bff;
border-radius: 50%;
width: 40px;
height: 40px;
animation: spin 1s linear infinite;
margin: 0 auto 20px;
}
@keyframes spin {
0% { transform: rotate(0deg); }
100% { transform: rotate(360deg); }
}
.error {
background: #f8d7da;
color: #721c24;
padding: 15px;
border-radius: 8px;
margin: 20px 0;
border: 1px solid #f5c6cb;
}
.success {
background: #d4edda;
color: #155724;
padding: 15px;
border-radius: 8px;
margin: 20px 0;
border: 1px solid #c3e6cb;
}
@media (max-width: 768px) {
.controls {
flex-direction: column;
align-items: stretch;
}
.info-panel {
margin-left: 0;
margin-top: 15px;
}
.chart-wrapper {
height: 400px;
}
.stats-grid {
grid-template-columns: 1fr;
}
}
</style>
</head>
<body>
<div class="container">
<div class="header">
<h1>🔍 内存监控数据可视化</h1>
<p>实时内存使用情况分析和趋势展示</p>
</div>
<div class="controls">
<div class="file-input-wrapper">
<input type="file" id="fileInput" class="file-input" accept=".json" multiple>
<label for="fileInput" class="file-input-label">
📁 选择JSON数据文件
</label>
</div>
<button class="btn" onclick="loadSampleData()">📊 加载示例数据</button>
<button class="btn btn-secondary" onclick="clearData()">🗑️ 清空数据</button>
<button class="btn btn-secondary" onclick="exportData()">💾 导出数据</button>
<div class="info-panel" id="infoPanel" style="display: none;">
<div class="info-item">
<span class="info-label">会话ID:</span>
<span class="info-value" id="sessionId">-</span>
</div>
<div class="info-item">
<span class="info-label">运行时长:</span>
<span class="info-value" id="duration">-</span>
</div>
<div class="info-item">
<span class="info-label">采样点数:</span>
<span class="info-value" id="sampleCount">-</span>
</div>
<div class="info-item">
<span class="info-label">峰值变化:</span>
<span class="info-value" id="peakChanges">-</span>
</div>
</div>
</div>
<div class="chart-container">
<div id="messageArea"></div>
<div class="stats-grid" id="statsGrid" style="display: none;">
<div class="stat-card">
<div class="stat-title">当前内存使用</div>
<div class="stat-value" id="currentMemory">-</div>
<div class="stat-subtitle">MB</div>
</div>
<div class="stat-card">
<div class="stat-title">最大内存使用</div>
<div class="stat-value" id="maxMemory">-</div>
<div class="stat-subtitle">MB</div>
</div>
<div class="stat-title">平均内存使用</div>
<div class="stat-value" id="avgMemory">-</div>
<div class="stat-subtitle">MB</div>
</div>
<div class="stat-card">
<div class="stat-title">内存使用率</div>
<div class="stat-value" id="usagePercent">-</div>
<div class="stat-subtitle">%</div>
</div>
</div>
<div class="chart-title">内存使用趋势图</div>
<div class="chart-wrapper">
<div id="memoryChart" style="width: 100%; height: 100%;"></div>
</div>
</div>
</div>
<script >
let currentData = null;
let chart = null;
// 初始化图表
function initChart() {
const chartDom = document.getElementById('memoryChart');
chart = echarts.init(chartDom);
const option = {
title: {
text: '内存使用趋势',
left: 'center',
textStyle: {
fontSize: 18,
fontWeight: 'normal'
}
},
tooltip: {
trigger: 'axis',
backgroundColor: 'rgba(0,0,0,0.8)',
borderColor: '#333',
textStyle: {
color: '#fff'
},
formatter: function(params) {
const data = params[0];
const pointData = data.data;
return `
<div style="padding: 10px;">
<div><strong>时间:</strong> ${pointData.time}</div>
<div><strong>运行时长:</strong> ${pointData.runtime}</div>
<div><strong>页面:</strong> ${pointData.page}</div>
<div><strong>内存使用:</strong> ${pointData.used}MB</div>
<div><strong>使用率:</strong> ${pointData.usage}%</div>
</div>
`;
}
},
legend: {
data: ['内存使用', '内存限制'],
top: 30
},
grid: {
left: '3%',
right: '4%',
bottom: '3%',
top: '15%',
containLabel: true
},
xAxis: {
type: 'category',
boundaryGap: false,
data: [],
axisLabel: {
rotate: 45,
fontSize: 12
}
},
yAxis: {
type: 'value',
name: '内存使用 (MB)',
axisLabel: {
formatter: '{value} MB'
}
},
series: [
{
name: '内存使用',
type: 'line',
data: [],
smooth: true,
lineStyle: {
color: '#007bff',
width: 3
},
itemStyle: {
color: '#007bff'
},
areaStyle: {
color: {
type: 'linear',
x: 0,
y: 0,
x2: 0,
y2: 1,
colorStops: [{
offset: 0, color: 'rgba(0, 123, 255, 0.3)'
}, {
offset: 1, color: 'rgba(0, 123, 255, 0.1)'
}]
}
}
}
]
};
chart.setOption(option);
}
// 加载数据
function loadData(data) {
currentData = data;
// 更新信息面板
document.getElementById('sessionId').textContent = data.sessionId || '-';
document.getElementById('duration').textContent = data.duration || '-';
document.getElementById('sampleCount').textContent = data.totalSamples || '-';
document.getElementById('peakChanges').textContent = data.peakChanges ? data.peakChanges.length : '-';
// 显示信息面板和统计卡片
document.getElementById('infoPanel').style.display = 'block';
document.getElementById('statsGrid').style.display = 'grid';
// 计算统计数据
const memoryData = data.data || [];
const usedValues = memoryData.map(d => d.used);
const currentMemory = usedValues[usedValues.length - 1] || 0;
const maxMemory = Math.max(...usedValues);
const avgMemory = Math.round(usedValues.reduce((a, b) => a + b, 0) / usedValues.length);
const usagePercent = Math.round((currentMemory / data.config.simulatedLimitMB) * 100);
// 更新统计卡片
document.getElementById('currentMemory').textContent = currentMemory;
document.getElementById('maxMemory').textContent = maxMemory;
document.getElementById('avgMemory').textContent = avgMemory;
document.getElementById('usagePercent').textContent = usagePercent;
// 更新图表
if (chart) {
const xAxisData = memoryData.map(d => d.runtime);
const seriesData = memoryData.map(d => ({
value: d.used,
time: d.time,
runtime: d.runtime,
page: d.page,
used: d.used,
usage: d.usage
}));
chart.setOption({
xAxis: {
data: xAxisData
},
series: [{
data: seriesData
}]
});
}
showMessage('数据加载成功!', 'success');
}
// 文件输入处理
document.getElementById('fileInput').addEventListener('change', function(e) {
const files = e.target.files;
if (files.length > 0) {
const file = files[0];
const reader = new FileReader();
reader.onload = function(e) {
try {
const data = JSON.parse(e.target.result);
loadData(data);
} catch (error) {
showMessage('文件格式错误,请选择有效的JSON文件', 'error');
}
};
reader.readAsText(file);
}
});
// 加载示例数据
function loadSampleData() {
const sampleData = {
sessionId: 'sample_20241219_001',
startTime: Date.now() - 300000, // 5分钟前
endTime: Date.now(),
duration: '5分0秒',
totalSamples: 30,
peakChanges: [
{
timestamp: Date.now() - 200000,
change: 25,
memory: 150,
runtimeFromStart: '2分30秒',
page: '/pages/index/index',
timeFromStart: '14:30:15'
}
],
trend: {
trend: 'increasing',
message: '内存使用增长 15.5%,可能存在内存泄漏',
growth: '20MB'
},
data: generateSampleMemoryData(),
config: {
simulatedLimitMB: 300,
peakThresholdMB: 20
}
};
loadData(sampleData);
}
// 生成示例内存数据
function generateSampleMemoryData() {
const data = [];
const baseMemory = 100;
const startTime = Date.now() - 300000; // 5分钟前
for (let i = 0; i < 30; i++) {
const timestamp = startTime + (i * 10000); // 每10秒一个点
const runtimeFromStartMs = timestamp - startTime;
const runtimeMinutes = Math.floor(runtimeFromStartMs / 1000 / 60);
const runtimeSeconds = Math.floor((runtimeFromStartMs % (1000 * 60)) / 1000);
const runtime = `${runtimeMinutes}:${runtimeSeconds.toString().padStart(2, '0')}`;
// 模拟内存增长趋势
const growth = Math.sin(i * 0.2) * 20 + i * 2;
const used = Math.round(baseMemory + growth + Math.random() * 10);
data.push({
timestamp: timestamp,
time: new Date(timestamp).toLocaleTimeString(),
runtime: runtime,
page: i < 10 ? '/pages/index/index' : i < 20 ? '/pages/call/call' : '/pages/chat/chat',
used: used,
total: used + Math.round(Math.random() * 50),
usage: Math.round((used / 300) * 100)
});
}
return data;
}
// 清空数据
function clearData() {
currentData = null;
document.getElementById('infoPanel').style.display = 'none';
document.getElementById('statsGrid').style.display = 'none';
if (chart) {
chart.setOption({
xAxis: { data: [] },
series: [{ data: [] }]
});
}
showMessage('数据已清空', 'success');
}
// 导出数据
function exportData() {
if (!currentData) {
showMessage('没有数据可导出', 'error');
return;
}
const dataStr = JSON.stringify(currentData, null, 2);
const blob = new Blob([dataStr], { type: 'application/json' });
const url = URL.createObjectURL(blob);
const a = document.createElement('a');
a.href = url;
a.download = `memory-data-${currentData.sessionId}.json`;
document.body.appendChild(a);
a.click();
document.body.removeChild(a);
URL.revokeObjectURL(url);
showMessage('数据已导出', 'success');
}
// 显示消息
function showMessage(message, type) {
const messageArea = document.getElementById('messageArea');
messageArea.innerHTML = `<div class="${type}">${message}</div>`;
setTimeout(() => {
messageArea.innerHTML = '';
}, 3000);
}
// 页面加载完成后初始化
window.addEventListener('load', function() {
initChart();
showMessage('欢迎使用内存监控数据可视化工具!请选择JSON数据文件或加载示例数据。', 'success');
});
// 响应式处理
window.addEventListener('resize', function() {
if (chart) {
chart.resize();
}
});
</script>
</body>
</html>二、TypeScript 配置详解
使用 TypeScript 时,我们需要配置 tsconfig.json 来保证类型安全和编译输出:
json
{
  "compilerOptions": {
    "target": "es2017",                    // 编译到 ES2017,平衡兼容性和现代特性
    "module": "esnext",                    // 使用 ESNext 模块化,支持最新的模块语法
    "declaration": true,                   // 生成类型声明文件
    "declarationDir": "dist/types",        // 类型声明文件输出目录
    "outDir": "dist",                      // 编译输出目录
    "moduleResolution": "node",            // 使用 Node.js 模块解析策略
    "esModuleInterop": true,               // 启用 ES 模块互操作性
    "forceConsistentCasingInFileNames": true, // 强制文件名大小写一致
    "strict": true,                        // 启用所有严格类型检查
    "skipLibCheck": true,                  // 跳过库文件的类型检查
    "downlevelIteration": true             // 支持降级迭代
  },
  "include": ["src"],                      // 包含 src 目录下的所有文件
  "types": ["node"]                        // 包含 Node.js 类型定义
}配置说明:
- target: "es2017":编译到 ES2017,支持 async/await、Object.values 等现代特性
- module: "esnext":使用最新的 ES 模块语法,Vite 会进一步处理
- declaration: true :生成
.d.ts文件,供其他 TypeScript 项目使用 - strict: true:启用严格模式,提高代码质量和类型安全
- esModuleInterop: true:允许 CommonJS 和 ES 模块之间的互操作
三、Vite 打包工具配置
我们使用 Vite 来打包 SDK 和 HTML 页面。Vite 的主要优势:
- 快速构建:基于 Rollup,支持现代 ES 模块化
- 插件生态:丰富的插件系统,支持各种自定义需求
- 开发体验:热重载、快速冷启动等开发特性
- 生产优化:内置代码分割、压缩等优化功能
1. 完整配置解析
ts
import { defineConfig } from 'vite';
import dts from 'vite-plugin-dts';
import path from 'path';
import { viteStaticCopy } from 'vite-plugin-static-copy';
import { minify } from 'html-minifier-terser';
import fs from 'fs';

export default defineConfig({
    build: {
        lib: {
            entry: path.resolve(__dirname, 'src/index.ts'), // SDK 入口文件
            name: 'MemoryMonitor',                          // 全局变量名(UMD 格式)
            fileName: (format) => `memory-monitor.${format}.js`, // 输出文件名模板
            formats: ['es', 'umd', 'cjs'],                 // 输出三种模块格式
        },
        outDir: 'dist',                                    // 输出目录
    },
    plugins: [
        // 生成 TypeScript 类型声明文件
        dts({
            insertTypesEntry: true,                        // 在 package.json 中插入 types 字段
        }),

        // 复制静态文件到输出目录
        viteStaticCopy({
            targets: [
                { src: 'src/index.html', dest: '.' },     // 复制 HTML 文件到 dist 根目录
            ],
        }),

        // 自定义插件:压缩 HTML 文件
        {
            name: 'html-minify',
            apply: 'build',                               // 仅在构建时应用
            closeBundle: async () => {                    // 在打包完成后执行
                const htmlPath = path.resolve(__dirname, 'dist/index.html');
                if (fs.existsSync(htmlPath)) {
                    const content = fs.readFileSync(htmlPath, 'utf-8');
                    const minified = await minify(content, {
                        collapseWhitespace: true,         // 压缩空白字符
                        removeComments: true,             // 移除注释
                        minifyCSS: true,                  // 压缩 CSS
                        minifyJS: true,                   // 压缩 JS
                        removeAttributeQuotes: false,     // 保留属性引号
                    });
                    fs.writeFileSync(htmlPath, minified, 'utf-8');
                }
            },
        },
    ],
});
2. 模块格式详解
1. ES Module (ESM)
特点:
- 官方标准模块,现代浏览器和 Node.js 都支持。
- 语法原生支持
import/export。 - 支持静态分析,打包工具(Vite / Webpack / Rollup)可以进行 tree-shaking(去掉未用代码)。
示例:
js
import MemoryMonitor from 'memory-monitor-sdk';

MemoryMonitor.startMonitoring(2000, 300, 20, true);优点:
- 静态依赖:打包工具可以提前分析依赖,提高优化效率。
- 兼容现代前端生态:适合浏览器和现代 Node.js。
- 支持 tree-shaking:减小打包体积。
缺点:
- 老旧浏览器不支持(IE 不支持)。
- Node.js 需要在
.mjs文件或package.json配置"type": "module"。
适用场景:
- 前端项目(Vue3 / React / Svelte 等现代框架)。
- Node.js 14+ 的服务端项目。
2. UMD (Universal Module Definition)
特点:
- 通用模块格式,浏览器 + Node.js 都能用。
- 通过
<script>引入可以直接使用全局变量,也可以通过 CommonJS 或 AMD 引入。
示例:
html
<script src="memory-monitor.umd.js"></script>
<script>
  const monitor = new MemoryMonitor();
  monitor.startMonitoring(2000, 300, 20, true);
</script>优点:
- 兼容性强:浏览器、AMD、CommonJS 环境都能用。
- 零配置直接用:无需打包工具或 Node.js 环境支持。
缺点:
- 体积可能大:UMD 文件通常包含包装代码。
- 不支持 tree-shaking:未使用的代码仍会打包进文件。
适用场景:
- 传统前端项目,直接在 HTML 页面上使用。
- 插件 / SDK 发布给第三方使用(无需他们配置构建工具)。
3. CommonJS (CJS)
特点:
- Node.js 原生模块格式,使用
require/module.exports。 - 以同步加载为主(适合服务器环境)。
示例:
js
const MemoryMonitor = require('memory-monitor-sdk');

const monitor = new MemoryMonitor();
monitor.startMonitoring(2000, 300, 20, true);优点:
- Node.js 原生支持,无需额外配置。
- 使用广泛:很多老旧 Node.js 模块仍然是 CJS。
缺点:
- 不适合浏览器,需要打包工具(Webpack / Rollup)才能用。
- 不支持静态分析,tree-shaking 不太好做。
适用场景:
- Node.js 服务端项目。
- 构建工具内部或老旧模块生态。
🔹 总结对比表
| 模块格式 | 语法 | 运行环境 | tree-shaking | 使用场景 |
|---|---|---|---|---|
| ESM | import/export |
浏览器 / Node.js 14+ | ✅ 支持 | 前端现代框架,服务端现代 Node.js |
| UMD | 全局变量 / AMD / CommonJS | 浏览器 / Node.js | ❌ 不支持 | 插件/SDK,兼容性需求高 |
| CJS | require/module.exports |
Node.js | ❌ 不支持 | 服务器端 Node.js,老旧项目 |
四、自定义插件详解
Vite 插件基于 Rollup 插件系统,可以在构建流程的不同阶段执行自定义逻辑:
ts
{
    name: 'plugin-name',           // 插件名称
    apply: 'build',                // 应用时机:'build' | 'serve' | 函数
    buildStart() {                 // 构建开始
        console.log('构建开始');
    },
    transform(code, id) {          // 转换每个模块
        // 处理模块内容
        return code;
    },
    generateBundle(options, bundle) { // 生成包内容前
        // 处理生成的包
    },
    closeBundle() {                // 构建完成后
        // 清理、压缩、生成报告等
    }
}
Vite 打包流程及插件钩子详解
1️⃣ 配置阶段(Config)
钩子:config / configResolved
-
作用:修改 Vite 配置或读取配置信息
-
发生时间:打包开始前,Vite 还没初始化
-
适用场景:
- 动态修改
build.outDir - 根据环境变量修改配置
- 动态修改
-
注意:还没有生成任何文件
ts
{
  name: 'my-plugin',
  config(config, env) {
    console.log('打包配置阶段', config, env)
  }
}
2️⃣ 构建阶段(Build Start)
钩子:buildStart
-
作用:开始构建前,做一些初始化或检查
-
发生时间:开始打包,Rollup 还没输出文件
-
适用场景:
- 检查文件是否存在
- 初始化缓存或数据
- 报错提前终止打包
ts
{
  name: 'my-plugin',
  buildStart() {
    console.log('构建开始')
  }
}
3️⃣ 文件生成阶段(Transform / Load / Resolve)
钩子:load / transform / resolveId
-
作用:逐个模块处理 JS/TS/CSS/HTML 等文件
-
发生时间:Rollup 开始解析和打包每个文件
-
适用场景:
- 转换 TS/JS 文件内容
- 内联 CSS 或图片资源
- 修改模块路径
ts
{
  name: 'my-plugin',
  transform(code, id) {
    if (id.endsWith('.js')) {
      return code.replace(/console\.log/g, '')
    }
  }
}
4️⃣ 生成输出阶段(Generate / Render Chunk)
钩子:generateBundle
-
作用:Rollup 已经生成了输出内容,但还没写入磁盘
-
发生时间 :打包文件还没保存到
dist -
适用场景:
- 修改输出文件内容
- 添加额外文件或资源
- 动态生成 HTML、LICENSE、banner
ts
{
  name: 'my-plugin',
  generateBundle(options, bundle) {
    console.log('所有文件准备生成', Object.keys(bundle))
  }
}
5️⃣ 打包完成阶段(Close Bundle)
钩子:closeBundle ✅ 我们的插件用的就是这个
-
作用:所有文件都生成并写入磁盘后,做最后处理
-
发生时间 :
dist目录里已经有index.html、memory-monitor.js等文件 -
适用场景:
- 压缩 HTML、CSS、JS 文件
- 修改最终生成的文件内容
- 上传到 CDN / 自动发布
ts
{
  name: 'html-minify',
  closeBundle: async () => {
    const htmlPath = path.resolve(__dirname, 'dist/index.html')
    if (fs.existsSync(htmlPath)) {
      const content = fs.readFileSync(htmlPath, 'utf-8')
      const minified = await minify(content, { collapseWhitespace: true })
      fs.writeFileSync(htmlPath, minified, 'utf-8')
    }
  }
}
解释:
closeBundle是最后一步,Vite 已经把 SDK 打包好、HTML 拷贝好- 我们可以安全地去修改
dist/index.html,不会影响打包流程
6️⃣ 总结流程图(文字版)
配置阶段
  └─ config / configResolved
构建开始
  └─ buildStart
模块解析 & 转换
  ├─ resolveId
  ├─ load
  └─ transform
生成输出
  └─ generateBundle
打包完成
  └─ closeBundle ← 我们压缩 HTML 的位置
五、构建流程详解
1. 完整构建流程
开始构建 TypeScript 编译 生成类型声明文件 打包 SDK 为三种格式 复制 HTML 文件 压缩 HTML 文件 输出到 dist 目录 构建完成
2. 输出文件说明
SDK 文件:
memory-monitor.es.js- ES 模块格式,现代浏览器和构建工具使用memory-monitor.umd.js- UMD 格式,浏览器直接引入使用memory-monitor.cjs.js- CommonJS 格式,Node.js 环境使用memory-monitor.d.ts- TypeScript 类型定义文件
可视化页面:
index.html- 压缩后的可视化页面,包含完整的图表和交互功能
3. 使用方式
作为 SDK 使用:
js
// ES 模块
import MemoryMonitor from 'memory-monitor-sdk';

// 开始监控
MemoryMonitor.startMonitoring(2000, 300, 20, true);

// 保存数据
MemoryMonitor.saveDataToFile();作为可视化工具使用:
html
<!-- 直接打开 dist/index.html -->
<!-- 或通过 HTTP 服务器访问 -->
六、项目特色功能及效果图展示
1. SDK 核心特性
智能监控:
- 自动检测内存使用情况
- 峰值变化告警(默认 20MB 阈值)
- 页面路由自动跟踪
- 运行时长统计
数据管理:
- 自动数据清理(保留最近 100 条记录)
- 多种数据导出格式
- 详细的报告生成
- 会话数据持久化
开发体验:
- 可拖拽的 DOM 显示面板
- 丰富的控制台日志
- 完整的 TypeScript 类型支持
- 开发环境自动启动
2. 可视化页面特性
图表展示:
- 基于 ECharts 的交互式图表
- 内存使用趋势分析
- 峰值变化标记
- 响应式设计
数据交互:
- 多文件数据加载
- 实时数据更新
- 数据导出功能
- 示例数据演示
用户体验:
- 现代化的 UI 设计
- 移动端适配
- 加载状态提示
- 错误处理机制
3.实现效果图
八、发布到 NPM
bash
1. **准备 package.json**
{
  "name": "memory-monitor-sdk",
  "version": "1.0.1",
  "description": "A powerful JavaScript memory monitoring SDK for Web and mobile applications. Features real-time monitoring, data visualization, automatic reporting, and memory leak detection.",
  "main": "dist/memory-monitor.es.js",
  "module": "dist/memory-monitor.es.js",
  "types": "dist/memory-monitor.d.ts",
  "files": [
    "dist",
    "README.md"
  ],
  "directories": {
    "example": "examples"
  },
  "scripts": {
    "build": "vite build",
    "dev": "vite",
    "preview": "vite preview",
    "type-check": "tsc --noEmit",
    "test": "echo \"Error: no test specified\" && exit 1"
  },
  "keywords": [
    "memory",
    "monitoring",
    "performance",
    "memory-leak",
    "sdk",
    "typescript",
    "web-performance",
    "mobile-performance",
    "memory-analysis",
    "performance-tools",
    "browser-memory",
    "memory-visualization",
    "real-time-monitoring"
  ],
  "author": {
    "name": "huangql520",
    "url": "https://github.com/huangql520"
  },
  "license": "MIT",
  "repository": {
    "type": "git",
    "url": "https://github.com/huangql520/memoryDevelopmentSdk.git"
  },
  "bugs": {
    "url": "https://github.com/huangql520/memoryDevelopmentSdk/issues"
  },
  "homepage": "https://github.com/huangql520/memoryDevelopmentSdk#readme",
  "engines": {
    "node": ">=14.0.0"
  },
  "browserslist": [
    "> 1%",
    "last 2 versions",
    "not dead",
    "Chrome >= 60"
  ],
  "devDependencies": {
    "@types/node": "^24.5.2",
    "typescript": "^5.9.2",
    "vite": "^7.1.7",
    "vite-plugin-dts": "^4.5.4",
    "vite-plugin-static-copy": "^3.1.2",
    "html-minifier-terser": "^7.2.0"
  },
  "dependencies": {},
  "publishConfig": {
    "access": "public"
  }
}确保必要字段完整(main / module / types / files / repository 等)。
- 构建项目
bash
npm run build- 提交代码到 Git
bash
git add .
git commit -m "chore: prepare release"- 更新版本号
bash
npm version patch # 或 minor / major- 发布到 npm
bash
npm publish --access public- 安装使用
bash
npm install memory-monitor-sdk

import MemoryMonitor from 'memory-monitor-sdk';
MemoryMonitor.startMonitoring(2000, 300, 20, true);
⚠️ 注意:npm 不允许覆盖已有版本,需要使用新的版本号;确保 Git 工作区干净,类型文件和 README 完整。
九、总结
SDK 核心特性:
- 智能监控、峰值告警
- 页面路由跟踪
- 会话数据持久化与导出
- 可拖拽 DOM 面板
可视化页面特性:
- ECharts 图表交互
- 多文件数据加载
- 实时更新与导出
- 响应式设计与移动端适配
架构优势:
- 模块化设计:SDK 与可视化页面分离
- 多模块格式:兼容多种环境
- 类型安全:完整 TypeScript 支持
- 开发友好:热重载、详细日志
应用场景:
- 前端项目内存监控
- 性能分析与报告生成
- 团队协作与演示
- 内存问题快速排查
这个项目展示了如何构建一个完整的监控工具,这种方案可以让开发者快速上手,既能在项目中通过 npm 直接集成 SDK,又能直接通过 HTML 页面查看内存监控数据,极大提升了开发体验。