目录
- 一、背景介绍
- 二、全局过滤器实现接口日志与耗时统计
-
- [1. 代码实现](#1. 代码实现)
- [2. 日志内容](#2. 日志内容)
- [三、为什么选择 Prometheus + Grafana?](#三、为什么选择 Prometheus + Grafana?)
- 四、接入思路
- [五、代码实现:接入 Prometheus](#五、代码实现:接入 Prometheus)
-
- [1. 引入依赖](#1. 引入依赖)
- [2. 修改全局过滤器,记录耗时指标](#2. 修改全局过滤器,记录耗时指标)
- [3. 开启 Prometheus 端点](#3. 开启 Prometheus 端点)
- [六、配置 Prometheus](#六、配置 Prometheus)
- [七、在 Grafana 中展示](#七、在 Grafana 中展示)
-
- [1. 常用 PromQL](#1. 常用 PromQL)
- 八、总结
一、背景介绍
在微服务架构下,API 网关 作为统一入口,往往需要具备日志监控、权限校验、流量控制等能力。
其中,记录接口访问情况和请求耗时,不仅能帮助开发者定位问题,还能为后续性能优化提供数据支撑。
本文将带你从全局过滤器日志统计 入手,逐步扩展到 Prometheus + Grafana 可视化监控,实现一套完整的接口性能监控方案。
二、全局过滤器实现接口日志与耗时统计
在 Spring Cloud Gateway 中,过滤器(Filter)是一个核心组件:
- GatewayFilter:作用于单个路由。
- GlobalFilter:作用于所有路由。
由于我们需要对 所有接口统一统计 ,这里使用 GlobalFilter。
1. 代码实现
java
import lombok.extern.slf4j.Slf4j;
import org.springframework.cloud.gateway.filter.GatewayFilterChain;
import org.springframework.cloud.gateway.filter.GlobalFilter;
import org.springframework.core.Ordered;
import org.springframework.stereotype.Component;
import org.springframework.web.server.ServerWebExchange;
import reactor.core.publisher.Mono;

@Component
@Slf4j
public class MyGlobalFilter implements GlobalFilter, Ordered {

    private static final String BEGIN_VISIT_TIME = "begin_visit_time";

    @Override
    public Mono<Void> filter(ServerWebExchange exchange, GatewayFilterChain chain) {
        // 记录请求开始时间
        exchange.getAttributes().put(BEGIN_VISIT_TIME, System.currentTimeMillis());

        return chain.filter(exchange).then(Mono.fromRunnable(() -> {
            Long beginVisitTime = exchange.getAttribute(BEGIN_VISIT_TIME);
            if (beginVisitTime != null) {
                log.info("访问接口主机:{}", exchange.getRequest().getURI().getHost());
                log.info("访问接口端口:{}", exchange.getRequest().getURI().getPort());
                log.info("访问接口URL:{}", exchange.getRequest().getURI().getPath());
                log.info("访问接口参数:{}", exchange.getRequest().getURI().getRawQuery());
                log.info("访问接口时长:{} 毫秒", System.currentTimeMillis() - beginVisitTime);
                log.info("===========分割线=============");
            }
        }));
    }

    @Override
    public int getOrder() {
        return 0; // 优先级最高
    }
}
2. 日志内容
- 请求主机(Host)
- 请求端口(Port)
- 请求路径(Path)
- 请求参数(Query)
- 请求耗时(ms)
👉 这些日志对于性能分析和问题排查非常有用。
三、为什么选择 Prometheus + Grafana?
日志虽然能看,但 无法实时监控和统计趋势。这时我们需要一个监控系统。
- Prometheus:开源时序数据库,专门存储监控指标。
- Grafana:数据可视化工具,支持从 Prometheus 拉取数据并绘制图表。
两者结合,就能实现 实时接口耗时监控 + 告警。
四、接入思路
- 在全局过滤器中,记录每次请求的耗时。
- 使用 Micrometer MeterRegistry 上报指标。
- Spring Boot Actuator 暴露
/actuator/prometheus接口。 - Prometheus 定时拉取数据。
- Grafana 展示监控大盘。
五、代码实现:接入 Prometheus
1. 引入依赖
xml
<dependency>
    <groupId>io.micrometer</groupId>
    <artifactId>micrometer-registry-prometheus</artifactId>
    <version>1.12.3</version>
</dependency>

<dependency>
    <groupId>org.springframework.boot</groupId>
    <artifactId>spring-boot-starter-actuator</artifactId>
    <version>3.2.3</version>
</dependency>
2. 修改全局过滤器,记录耗时指标
java
import io.micrometer.core.instrument.MeterRegistry;
import lombok.extern.slf4j.Slf4j;
import org.springframework.beans.factory.annotation.Autowired;
import org.springframework.cloud.gateway.filter.GatewayFilterChain;
import org.springframework.cloud.gateway.filter.GlobalFilter;
import org.springframework.core.Ordered;
import org.springframework.stereotype.Component;
import org.springframework.web.server.ServerWebExchange;
import reactor.core.publisher.Mono;

import java.util.concurrent.TimeUnit;

@Component
@Slf4j
public class MetricsGlobalFilter implements GlobalFilter, Ordered {

    private static final String BEGIN_VISIT_TIME = "begin_visit_time";

    @Autowired
    private MeterRegistry meterRegistry;

    @Override
    public Mono<Void> filter(ServerWebExchange exchange, GatewayFilterChain chain) {
        exchange.getAttributes().put(BEGIN_VISIT_TIME, System.currentTimeMillis());

        return chain.filter(exchange).then(Mono.fromRunnable(() -> {
            Long beginTime = exchange.getAttribute(BEGIN_VISIT_TIME);
            if (beginTime != null) {
                long cost = System.currentTimeMillis() - beginTime;
                String path = exchange.getRequest().getURI().getPath();

                // 日志打印
                log.info("接口 {} 耗时 {} ms", path, cost);

                // 上报 Prometheus 指标
                meterRegistry.timer("gateway_requests", "path", path)
                        .record(cost, TimeUnit.MILLISECONDS);
            }
        }));
    }

    @Override
    public int getOrder() {
        return 0;
    }
}
3. 开启 Prometheus 端点
yaml
management:
endpoints:
web:
exposure:
include: prometheus
endpoint:
prometheus:
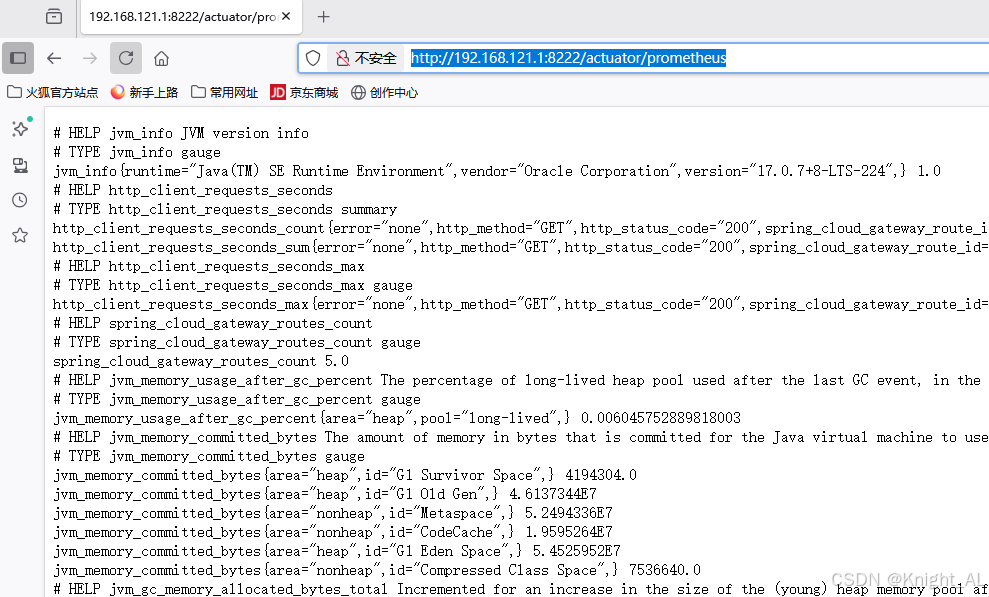
enabled: true访问:
http://localhost:8222/actuator/prometheus你会看到类似的输出:
六、配置 Prometheus
在 prometheus.yml 中添加:
yaml
scrape_configs:
  - job_name: 'spring-cloud-gateway'
    metrics_path: '/actuator/prometheus'
    static_configs:
      - targets: ['192.168.121.1:8222']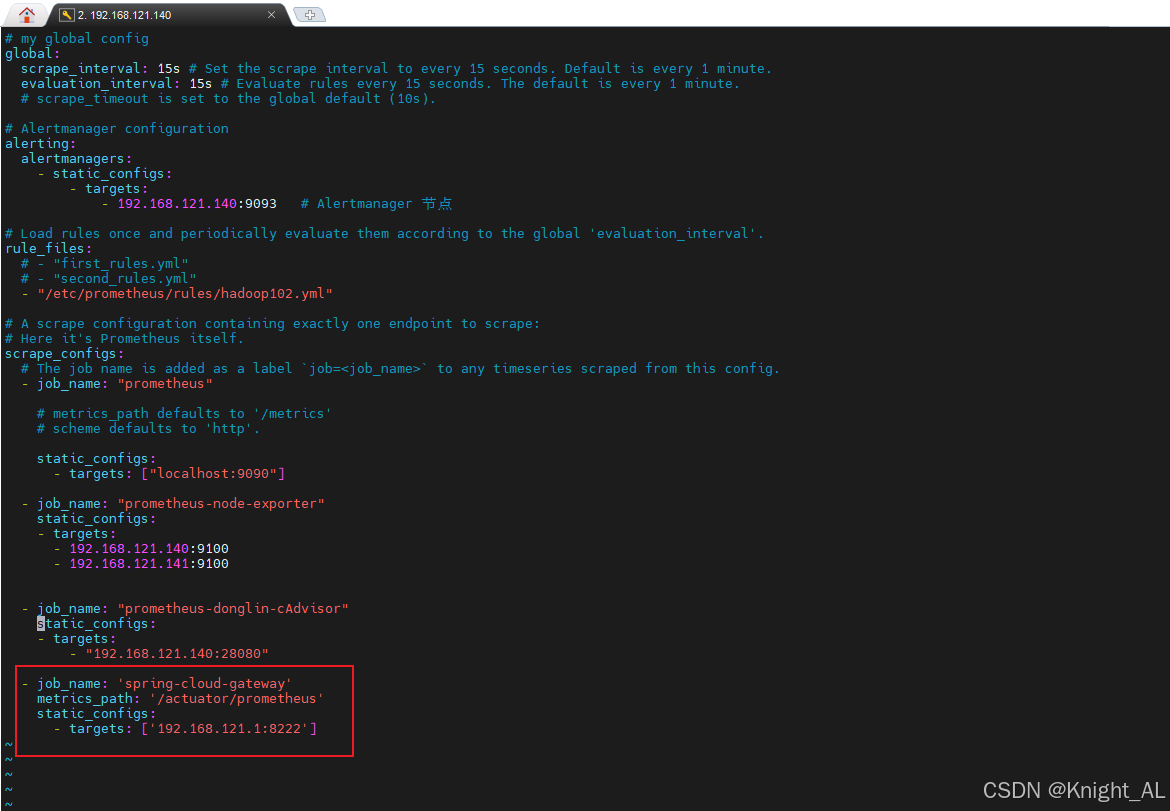
七、在 Grafana 中展示
- Grafana 添加数据源 → Prometheus。
- 新建 Dashboard → 添加图表。
1. 常用 PromQL
-
平均响应时间(ms)
promql(rate(gateway_requests_seconds_sum[5m]) / rate(gateway_requests_seconds_count[5m])) * 1000 -
每秒请求数 QPS
promqlrate(gateway_requests_seconds_count[1m]) -
错误率
promql(sum(rate(gateway_requests_seconds_count{status!="200"}[5m])) / sum(rate(gateway_requests_seconds_count[5m]))) * 100
效果图:

八、总结
从 日志统计 → 指标监控 → 可视化分析 的完整链路:
- 全局过滤器:记录接口访问日志与耗时。
- Prometheus:采集和存储耗时指标。
- Grafana:可视化接口性能趋势,并可设置告警。