1.引言
在微服务架构盛行的今天,Spring Boot应用因其快速开发、易部署的特性成为企业级应用的首选。然而,随着系统复杂度的提升,应用的稳定性、性能瓶颈和潜在故障逐渐成为运维的痛点。监控作为保障系统可靠性的关键手段,能够帮助开发者实时感知应用状态、快速定位问题根源,甚至通过告警机制提前预防故障。
传统的监控方式(如日志分析、手动检查)效率低下,难以应对分布式系统的动态变化。而基于Prometheus + Grafana的监控方案,通过自动化数据采集、实时可视化分析和智能告警,为Spring Boot应用提供了全生命周期的监控能力。
本文将从零开始,逐步搭建一套完整的监控系统,覆盖从应用端点暴露到数据可视化的全流程。
整体架构与原理
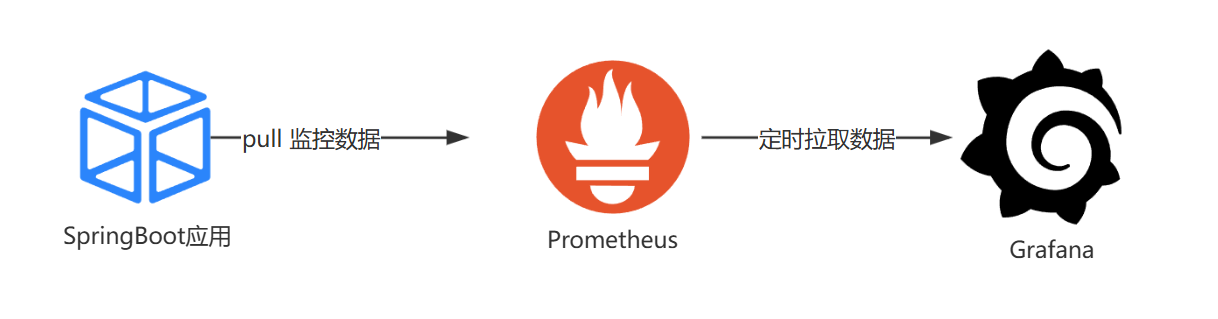
- Spring Boot应用 :通过Actuator模块暴露监控端点(如
/actuator/prometheus),提供应用内部的性能指标(如CPU、内存、HTTP请求等)。 - Prometheus:作为监控核心,定期从Spring Boot的Actuator端点拉取指标数据,存储为时间序列数据,并通过PromQL支持灵活查询。
- Grafana:作为可视化工具,连接Prometheus作为数据源,通过预设仪表盘展示关键指标,辅助运维决策。
架构图 :
2. Spring Boot应用开放对外暴露的端点
1.添加Actuator依赖
在Spring Boot项目的pom.xml中引入Actuator依赖:
xml
<dependency>
    <groupId>org.springframework.boot</groupId>
    <artifactId>spring-boot-starter-actuator</artifactId>
</dependency>
2.配置Actuator端点
在application.yml中启用Prometheus端点并暴露HTTP路径:
yaml
management:
  endpoints:
    web:
      exposure:
        include: "*"
  endpoint:
    prometheus:
      enabled: true  # 启用Prometheus端点
3.验证端点
启动应用后访问http://localhost:8080/actuator/metrics,可看到基础指标(如JVM内存、线程数),
但格式为Spring Boot默认的JSON,非Prometheus兼容格式。

2. 应用监控数据与Prometheus数据转换
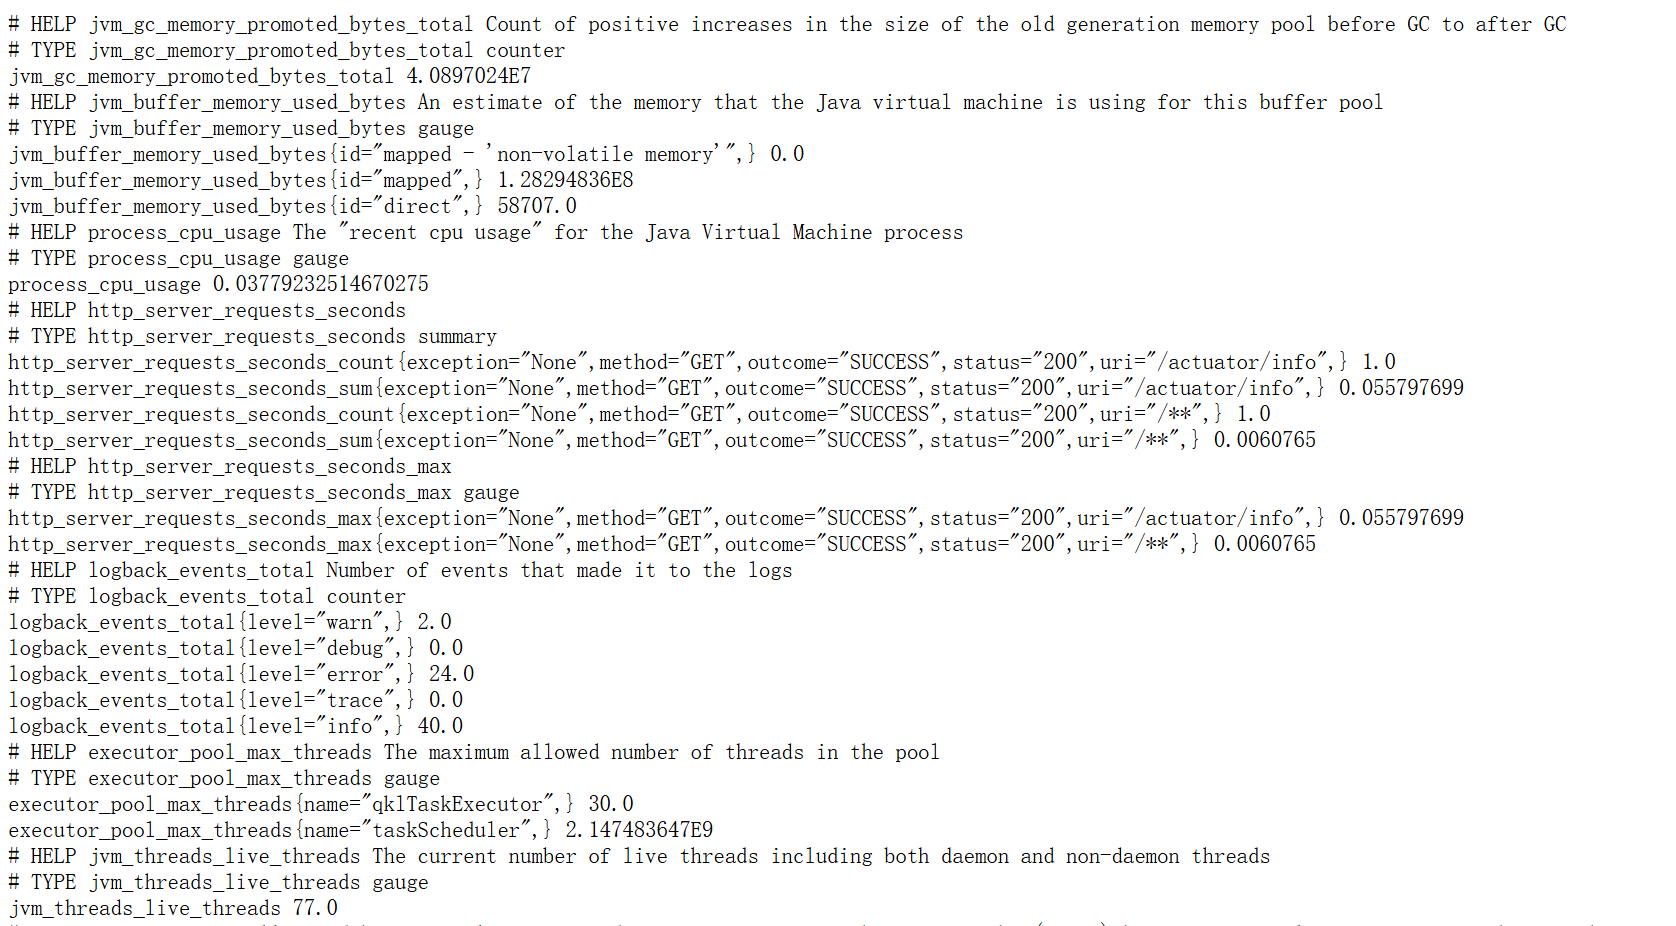
Spring Boot通过Micrometer将应用指标(如JVM内存、HTTP请求数)转换为Prometheus兼容的格式(时间序列+标签)。Prometheus无需额外转换,直接拉取即可。
1.添加Micrometer依赖
在Spring Boot项目的pom.xml中引入Micrometer(Prometheus适配器)依赖:
xml
<dependency>
    <groupId>io.micrometer</groupId>
    <artifactId>micrometer-registry-prometheus</artifactId>
</dependency>
2.启用Prometheus
yaml
management:
  endpoints:
    web:
      exposure:
        include: "*"
  endpoint:
    prometheus:
      enabled: true  # 启用Prometheus端点
    health:
      show-details: always
3.验证端点
启动应用后,访问http://localhost:8080/actuator/prometheus,应返回类似以下格式的指标数据:
3. Docker部署Prometheus
1.编写Prometheus配置文件
创建prometheus.yml,配置Spring Boot应用为监控目标:
yaml
global:
  scrape_interval: 15s  # 数据拉取间隔

scrape_configs:
  - job_name: 'springboot-app'
    metrics_path: '/actuator/prometheus'
    static_configs:
      - targets: ['host.docker.internal:8080']  # 本地Docker需替换为宿主机IP
2.拉取Prometheus镜像并启动
bash
docker pull prom/prometheus
docker run -d --name prometheus \
-p 9090:9090 \
-v $(pwd)/prometheus.yml:/etc/prometheus/prometheus.yml \
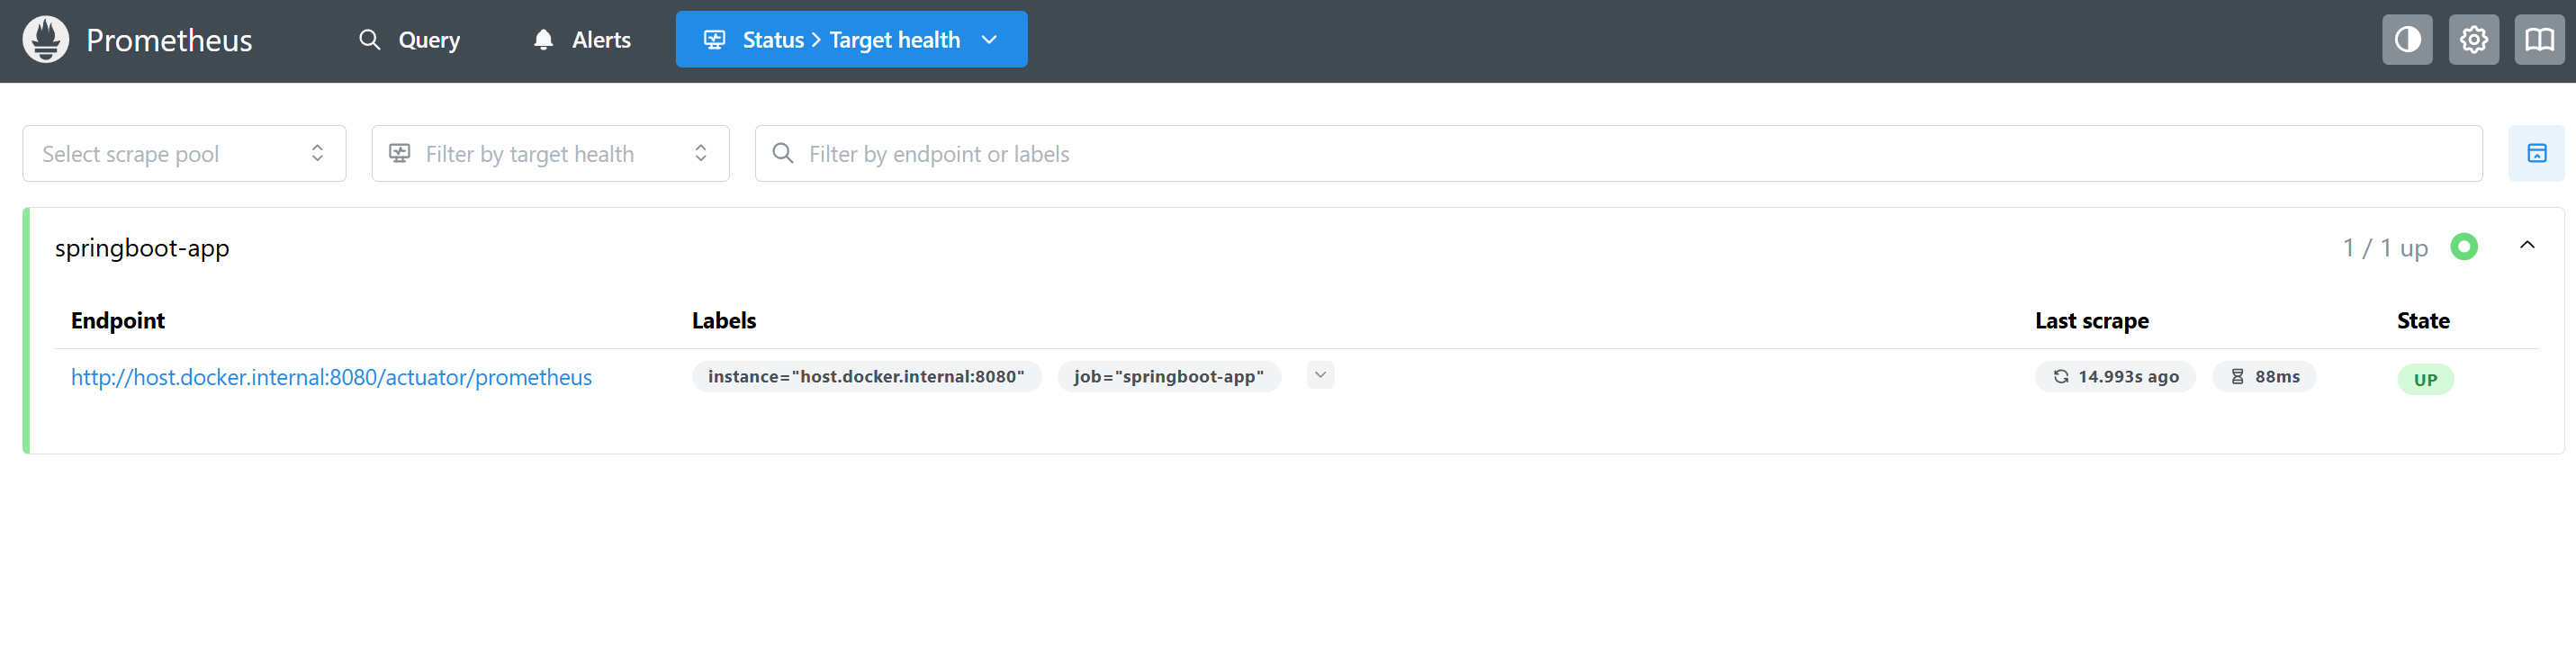
prom/prometheus3.验证Prometheus
访问http://localhost:9090,在Targets页面检查Spring Boot应用是否显示为UP状态。
4. Docker部署Grafana
1.拉取Grafana镜像并启动
bash
docker pull grafana/grafana
docker run -d --name grafana \
  -p 3000:3000 \
  grafana/grafana
2.登录Grafana
访问http://localhost:3000,默认用户名/密码为admin/admin。
注意:首次登录后需要修改密码!
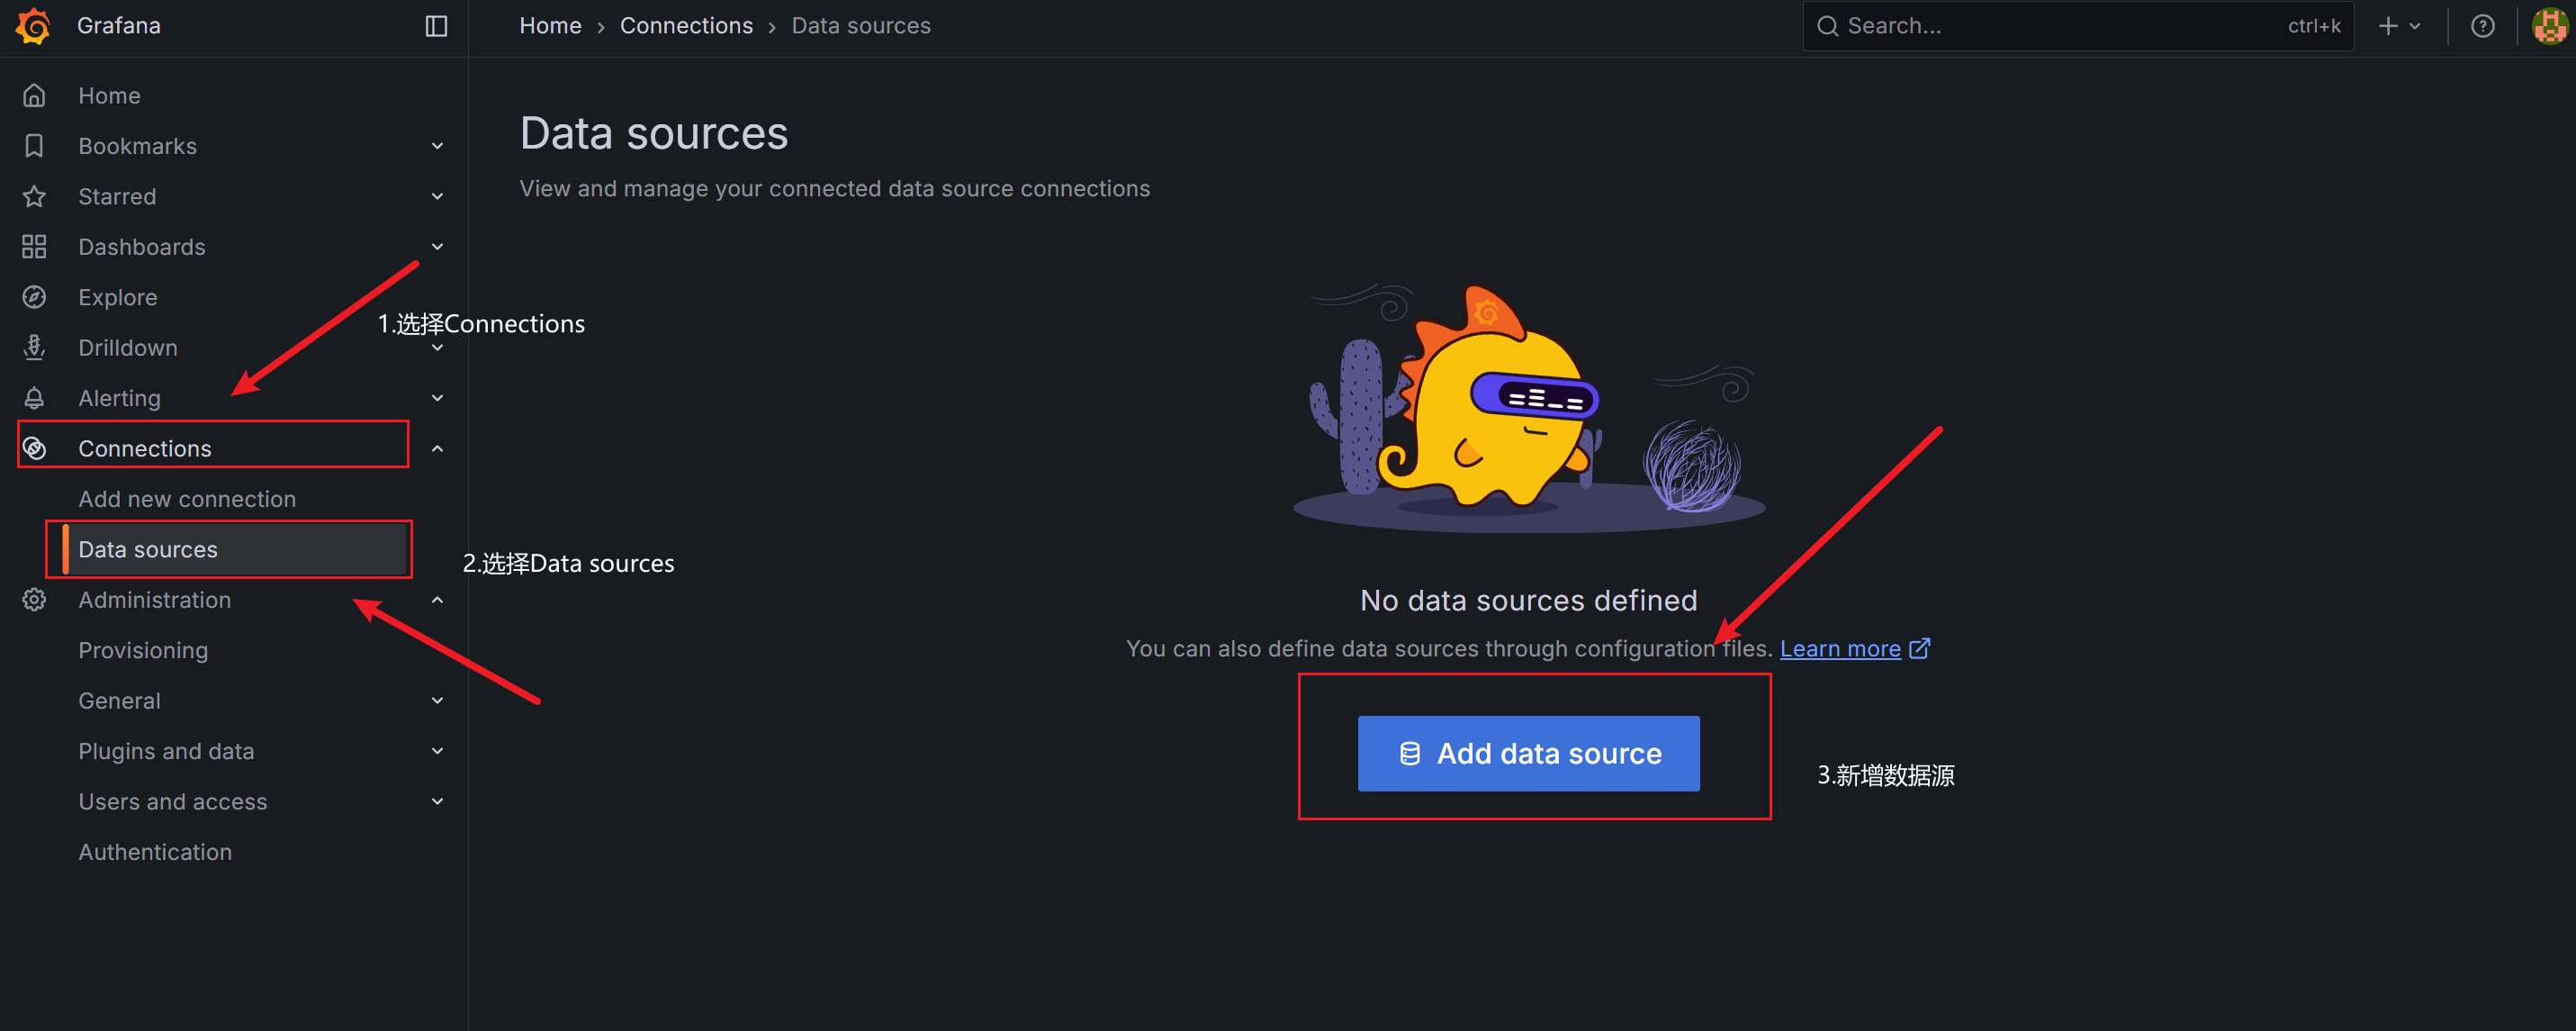
3.添加Prometheus数据源
- 进入Grafana界面,点击左侧菜单
Connextions→Data Sources→Add data source。 - 选择
Prometheus,填写URL为http://host.docker.internal:9090(或宿主机IP)。 - 点击
Save & Test,确认连接成功。
4.监控效果
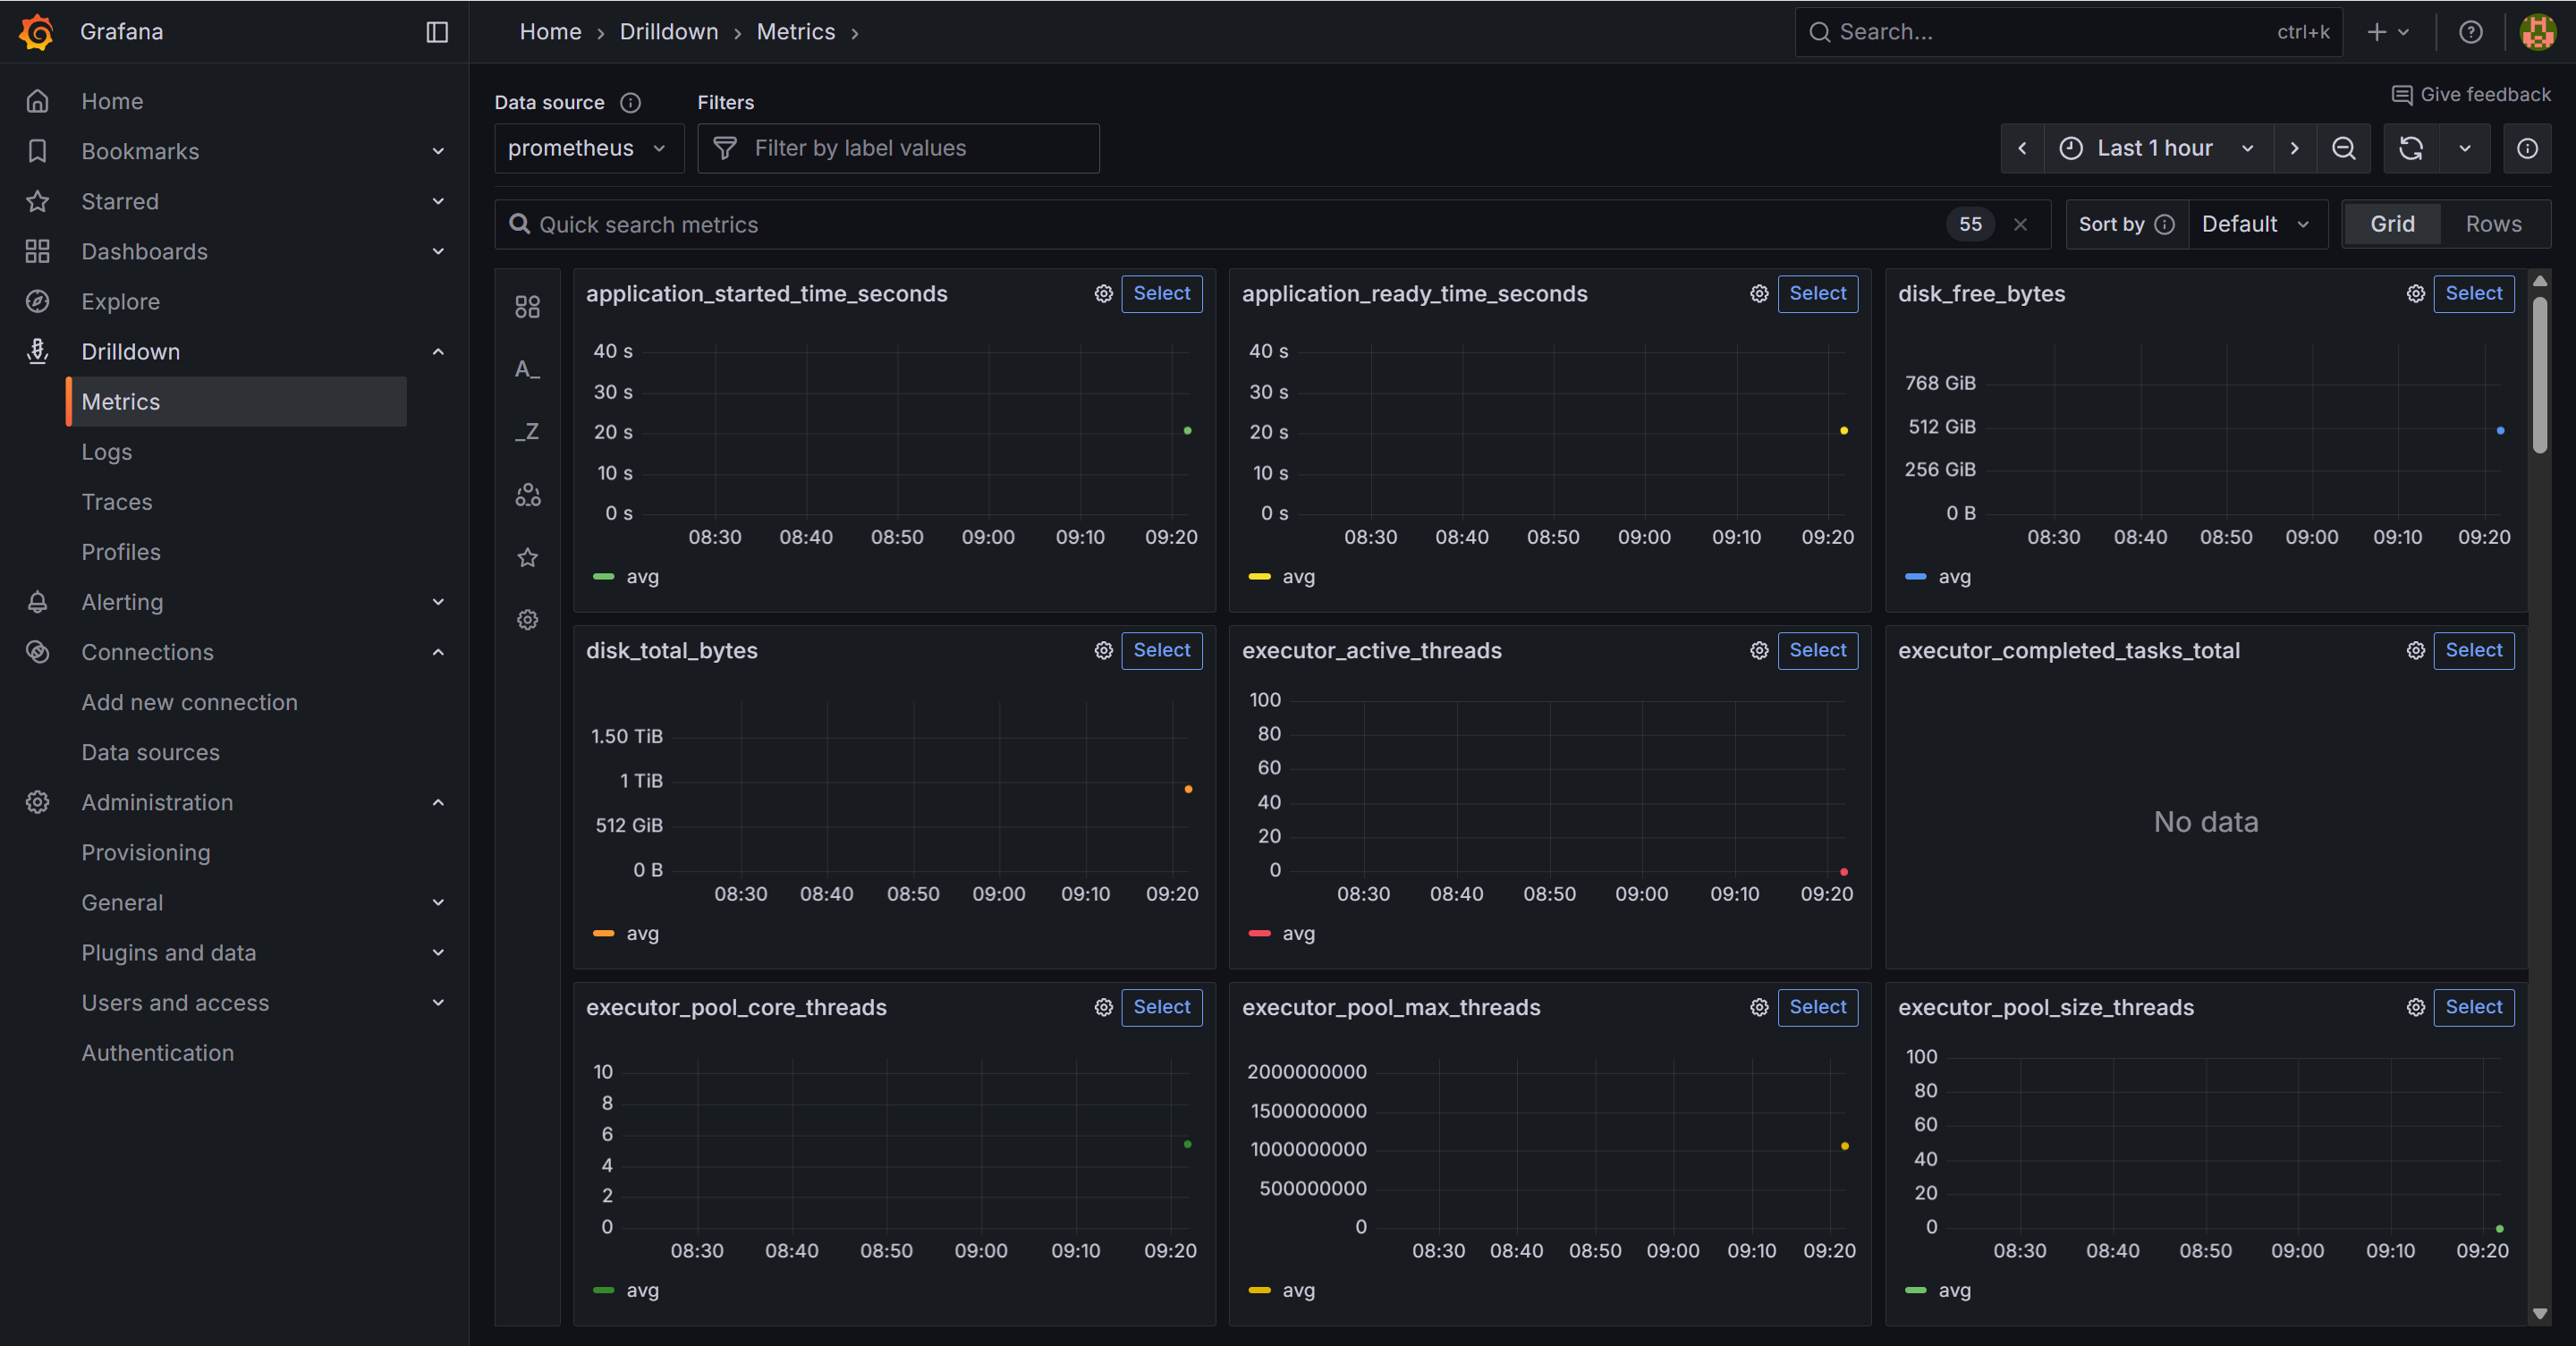
通过 Grafana 仪表盘,集中展示了 Spring Boot 应用的核心监控指标,包括 :
✅ 应用健康度 (Actuator 健康状态、运行时长、线程活跃数);
✅ JVM 资源使用 (堆内存/非堆内存占用、GC 次数与耗时);
✅ HTTP 请求性能 (请求总量、错误率、平均响应时间、QPS);
✅ Tomcat 线程池 (活跃线程数、任务队列积压量)。
这些可视化面板帮助团队快速定位性能瓶颈、资源泄漏或服务异常,实现从基础设施到业务层的全链路可观测性。