NUC电脑架设的wordpress博客网站日志分析
最近网站受到攻击,windows用户暴力破解,wordpress密码登录攻击,挂马(lock.php)。我关闭了远程桌面,安装wordpress登录活动记录,锁定登录次数超过4次的用户,锁定一段时间。网站打开用户注册,灌水太严重!小站长太难了。免费1G流量,几天就跑完。重点先分析一下访问日志,以便发现问题!
python代码
python
import re
import pandas as pd
import matplotlib.pyplot as plt
from datetime import datetime
import os

class WebLogAnalyzer:
    def __init__(self):
        # Define regex pattern for Apache/Nginx log format
        self.log_pattern = re.compile(r'(\S+) - - \[(.*?)\] "(.*?)" (\d+) (\S+)')
        self.data = []
        self.df = None

    def parse_log_entry(self, entry):
        """Parse a single log entry"""
        match = self.log_pattern.match(entry.strip())
        if match:
            ip = match.group(1)
            timestamp_str = match.group(2)
            request = match.group(3)
            status_code = match.group(4)
            response_size = match.group(5)

            # Parse timestamp
            try:
                # Handle format: 01/Oct/2025:02:11:23 +0800
                timestamp = datetime.strptime(timestamp_str[:20], '%d/%b/%Y:%H:%M:%S')
            except ValueError:
                timestamp = None

            # Parse request line
            request_parts = request.split(' ', 2)
            if len(request_parts) >= 2:
                method = request_parts[0]
                path = request_parts[1]
                protocol = request_parts[2] if len(request_parts) > 2 else ''
            else:
                method, path, protocol = '', '', ''

            # Process response size
            try:
                response_size = int(response_size) if response_size != '-' else 0
            except ValueError:
                response_size = 0

            # Classify request type
            request_type = self.classify_request(path)

            return {
                'ip': ip,
                'timestamp': timestamp,
                'method': method,
                'path': path,
                'protocol': protocol,
                'status_code': status_code,
                'response_size': response_size,
                'request_type': request_type
            }
        return None

    def classify_request(self, path):
        """Classify the type of request"""
        if path.endswith(('.jpg', '.jpeg', '.png', '.gif', '.css', '.js')):
            return 'static'
        elif 'wp-cron.php' in path:
            return 'cron'
        elif 'wp-login.php' in path:
            return 'login'
        elif path.startswith('/?p='):
            return 'post'
        elif path.startswith('/?m='):
            return 'archive'
        elif path.endswith('.php'):
            return 'dynamic'
        else:
            return 'other'

    def load_logs_from_string(self, log_string):
        """Load log data from a string"""
        for line in log_string.strip().split('\n'):
            parsed_entry = self.parse_log_entry(line)
            if parsed_entry:
                self.data.append(parsed_entry)
        self.create_dataframe()

    def load_logs_from_file(self, file_path):
        """Load log data from a file"""
        if not os.path.exists(file_path):
            print(f"File not found: {file_path}")
            return

        with open(file_path, 'r', encoding='utf-8') as f:
            for line in f:
                parsed_entry = self.parse_log_entry(line)
                if parsed_entry:
                    self.data.append(parsed_entry)
        self.create_dataframe()

    def create_dataframe(self):
        """Create pandas DataFrame"""
        if self.data:
            self.df = pd.DataFrame(self.data)
            # Set timestamp as index
            if 'timestamp' in self.df.columns:
                self.df.set_index('timestamp', inplace=True)

    def basic_statistics(self):
        """Generate basic statistics"""
        if self.df is None or self.df.empty:
            print("No data to analyze.")
            return

        print("===== Basic Statistics =====")
        print(f"Total requests: {len(self.df)}")
        print(f"Unique IPs: {self.df['ip'].nunique()}")
        print(f"Date range: {self.df.index.min()} to {self.df.index.max()}")
        print(f"Total data transferred: {self.df['response_size'].sum() / 1024:.2f} KB")
        print()

        # Request method statistics
        print("Request methods:")
        print(self.df['method'].value_counts())
        print()

        # Status code statistics
        print("Status codes:")
        print(self.df['status_code'].value_counts())
        print()

        # Request type statistics
        print("Request types:")
        print(self.df['request_type'].value_counts())
        print()

        # IP address statistics (top 10)
        print("Top 10 IPs by request count:")
        print(self.df['ip'].value_counts().head(10))
        print()

        # Most requested paths (top 10)
        print("Top 10 most requested paths:")
        print(self.df['path'].value_counts().head(10))

    def hourly_analysis(self):
        """Analyze request patterns by hour"""
        if self.df is None or self.df.empty:
            print("No data to analyze.")
            return

        # Count requests by hour
        hourly_counts = self.df.groupby(self.df.index.hour).size()

        print("===== Hourly Request Distribution ======")
        for hour, count in hourly_counts.items():
            print(f"Hour {hour}:00 - {count} requests")

        return hourly_counts

    def visualize_data(self):
        """Visualize analysis results"""
        if self.df is None or self.df.empty:
            print("No data to visualize.")
            return

        plt.figure(figsize=(15, 10))

        # 1. Request type distribution pie chart
        plt.subplot(2, 2, 1)
        request_types = self.df['request_type'].value_counts()
        plt.pie(request_types, labels=request_types.index, autopct='%1.1f%%')
        plt.title('Request Type Distribution')

        # 2. Hourly request count bar chart
        plt.subplot(2, 2, 2)
        hourly_counts = self.df.groupby(self.df.index.hour).size()
        hourly_counts.plot(kind='bar')
        plt.title('Requests per Hour')
        plt.xlabel('Hour of Day')
        plt.ylabel('Number of Requests')

        # 3. Response size distribution histogram
        plt.subplot(2, 2, 3)
        # Filter out large files for better visualization
        small_responses = self.df[self.df['response_size'] < 100000]['response_size']
        small_responses.plot(kind='hist', bins=20)
        plt.title('Response Size Distribution (< 100KB)')
        plt.xlabel('Size (bytes)')

        # 4. Top 10 IPs by request count
        plt.subplot(2, 2, 4)
        top_ips = self.df['ip'].value_counts().head(10)
        top_ips.plot(kind='bar')
        plt.title('Top 10 IPs by Request Count')
        plt.xticks(rotation=45, ha='right')

        plt.tight_layout()
        plt.savefig('web_log_analysis.png')
        print("Visualization saved as 'web_log_analysis.png'")
        plt.show()

# Example usage
if __name__ == "__main__":
    analyzer = WebLogAnalyzer()

    # Example log data (the logs you provided)
    sample_logs = '''192.168.1.29 - - [01/Oct/2025:02:11:23 +0800] "GET /?p=4982 HTTP/1.1" 200 38050
192.168.1.29 - - [01/Oct/2025:02:12:27 +0800] "POST /wp-cron.php?doing_wp_cron=1759255947.7655351161956787109375 HTTP/1.1" 200 -
192.168.1.29 - - [01/Oct/2025:02:12:27 +0800] "GET /?p=2641 HTTP/1.1" 200 38089
192.168.1.29 - - [01/Oct/2025:02:13:25 +0800] "POST /wp-cron.php?doing_wp_cron=1759256005.3710870742797851562500 HTTP/1.1" 200 -
192.168.1.29 - - [01/Oct/2025:02:13:25 +0800] "GET /?p=6219 HTTP/1.1" 200 38449
192.168.1.29 - - [01/Oct/2025:02:13:31 +0800] "GET /?p=2546 HTTP/1.1" 200 37851
192.168.1.29 - - [01/Oct/2025:02:13:36 +0800] "GET /wp-content/uploads/2023/02/079513CF-3665-487C-949F-782C5A9BA4A3-768x1024.jpeg HTTP/1.1" 200 201018
192.168.1.29 - - [01/Oct/2025:02:14:10 +0800] "GET /?m=20230318 HTTP/1.1" 200 36042
192.168.1.29 - - [01/Oct/2025:02:14:11 +0800] "GET /wp-login.php?redirect_to=http%3A%2F%2F50btvfr9.ipyingshe.net%3A5347%2F%3Fp%3D5617 HTTP/1.1" 200 10397
192.168.1.29 - - [01/Oct/2025:02:14:37 +0800] "POST /wp-cron.php?doing_wp_cron=1759256077.0696580410003662109375 HTTP/1.1" 200 -
192.168.1.29 - - [01/Oct/2025:02:14:36 +0800] "GET /?p=607 HTTP/1.1" 200 37749
192.168.1.29 - - [01/Oct/2025:02:14:39 +0800] "GET /?m=20250527 HTTP/1.1" 200 37391
192.168.1.29 - - [01/Oct/2025:02:15:50 +0800] "POST /wp-cron.php?doing_wp_cron=1759256149.8552899360656738281250 HTTP/1.1" 200 -
192.168.1.29 - - [01/Oct/2025:02:15:49 +0800] "GET /?p=5586 HTTP/1.1" 200 37823
127.0.0.1 - - [01/Oct/2025:02:16:03 +0800] "GET /wp-login.php?redirect_to=http%3A%2F%2Ft0.pgrm.top%3A10473%2F%3Fp%3D2289 HTTP/1.1" 200 10127
192.168.1.29 - - [01/Oct/2025:02:16:28 +0800] "POST /wp-cron.php?doing_wp_cron=1759256188.7235629558563232421875 HTTP/1.1" 200 -
192.168.1.29 - - [01/Oct/2025:02:16:28 +0800] "GET /?p=1122 HTTP/1.1" 200 37793
192.168.1.29 - - [01/Oct/2025:02:17:36 +0800] "POST /wp-cron.php?doing_wp_cron=1759256256.6574699878692626953125 HTTP/1.1" 200 -
192.168.1.29 - - [01/Oct/2025:02:17:36 +0800] "GET /?p=4231 HTTP/1.1" 200 38122
192.168.1.29 - - [01/Oct/2025:02:18:35 +0800] "POST /wp-cron.php?doing_wp_cron=1759256315.1436870098114013671875 HTTP/1.1" 200 -
192.168.1.29 - - [01/Oct/2025:02:18:35 +0800] "GET /?p=555 HTTP/1.1" 200 37923
192.168.1.29 - - [01/Oct/2025:02:19:50 +0800] "POST /wp-cron.php?doing_wp_cron=1759256390.7410199642181396484375 HTTP/1.1" 200 -
192.168.1.29 - - [01/Oct/2025:02:19:50 +0800] "GET /?p=2791 HTTP/1.1" 200 37821
192.168.1.29 - - [01/Oct/2025:02:20:41 +0800] "POST /wp-cron.php?doing_wp_cron=1759256441.1784839630126953125000 HTTP/1.1" 200 -'''

    # Load data from sample logs
    #analyzer.load_logs_from_string(sample_logs)

    #load data from a file
    analyzer.load_logs_from_file('D:/phpstudy_pro/Extensions/Apache2.4.39/logs/access.log.1759276800')


    # Alternatively, load from a file (if you have log files)
    # analyzer.load_logs_from_file('access.log')

    # Perform analysis
    analyzer.basic_statistics()
    analyzer.hourly_analysis()

    # Generate visualizations
    try:
        analyzer.visualize_data()
    except Exception as e:
        print(f"Visualization error: {e}")
        print("You may need to install matplotlib: pip install matplotlib")
分析结果
c:/Users/czliu/Documents/python/webloganalyzer.py
===== Basic Statistics =====
Total requests: 10566
Unique IPs: 12
Date range: 2025-10-01 00:00:45 to 2025-10-01 23:59:56
Total data transferred: 352847.94 KB
Request methods:
method
GET 8854
POST 1647
31
OPTIONS 25
HEAD 9
Name: count, dtype: int64
Status codes:
status_code
200 9764
404 219
304 195
301 145
302 106
500 56
206 28
408 19
400 12
503 11
201 8
403 3
Name: count, dtype: int64
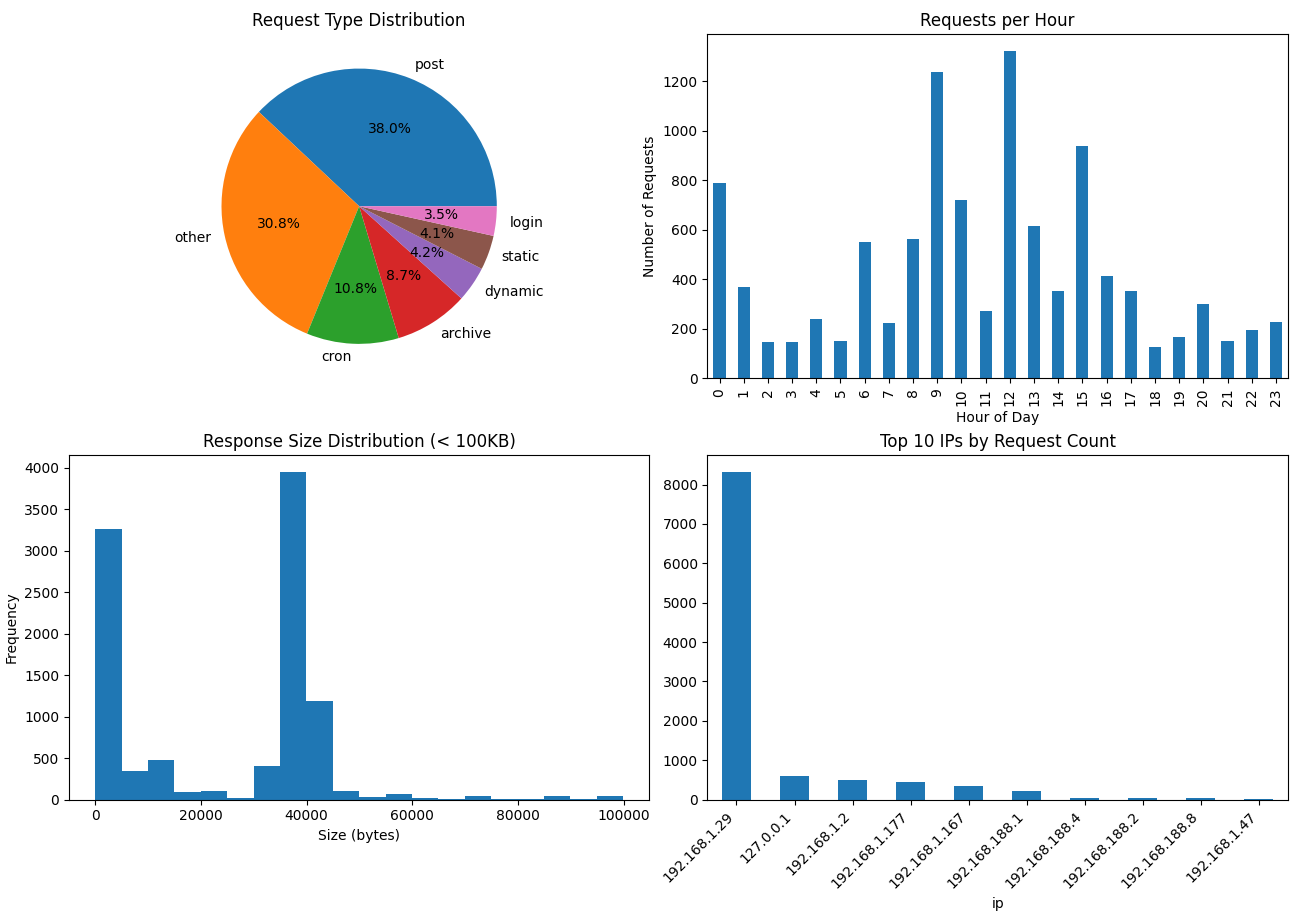
Request types:
request_type
post 4014
other 3258
cron 1143
archive 917
dynamic 440
static 428
login 366
Name: count, dtype: int64
Top 10 IPs by request count:
ip
192.168.1.29 8323
127.0.0.1 590
192.168.1.2 489
192.168.1.177 442
192.168.1.167 351
192.168.188.1 217
192.168.188.4 48
192.168.188.2 34
192.168.188.8 30
192.168.1.47 24
Name: count, dtype: int64
Top 10 most requested paths:
path
/wp-content/plugins/burst-statistics/endpoint.php 203
/robots.txt 162
/wp-admin/admin-ajax.php 146
/ 106
/wp-login.php 96
/wp-admin/index.php 79
/wp-login.php?redirect_to=http%3A%2F%2Fcnliutz.ipyingshe.net%2Fwp-admin%2Findex.php&reauth=1 78
/wp-includes/css/dist/block-library/style.min.css?ver=6.8.2 46
/?p=6310 44
/wp-content/themes/clean-education/js/scrollup.min.js?ver=2.4 43
Name: count, dtype: int64
===== Hourly Request Distribution ======
Hour 0:00 - 790 requests
Hour 1:00 - 370 requests
Hour 2:00 - 147 requests
Hour 3:00 - 146 requests
Hour 4:00 - 238 requests
Hour 5:00 - 152 requests
Hour 6:00 - 552 requests
Hour 7:00 - 222 requests
Hour 8:00 - 563 requests
Hour 9:00 - 1237 requests
Hour 10:00 - 720 requests
Hour 11:00 - 271 requests
Hour 12:00 - 1324 requests
Hour 13:00 - 614 requests
Hour 14:00 - 354 requests
Hour 15:00 - 938 requests
Hour 16:00 - 414 requests
Hour 17:00 - 351 requests
Hour 18:00 - 125 requests
Hour 19:00 - 165 requests
Hour 20:00 - 299 requests
Hour 21:00 - 152 requests
Hour 22:00 - 195 requests
Hour 23:00 - 227 requests
Visualization saved as 'web_log_analysis.png'
图