通过 Prometheus + Grafana 实现微服务监控是业界主流方案,核心流程是:Prometheus 采集微服务指标 → Grafana 可视化指标。以下是针对微服务架构的完整落地步骤,包括多服务监控、服务发现、告警配置等关键环节。
上一篇:
centos7部署 Prometheus 3.0.0 + Grafana 10.3.3 + Alertmanager 0.27.0
Spring Boot 3 集成 Prometheus 核心步骤,需要两组配置:
1.暴露 Prometheus 指标
添加maven依赖:
<!-- Spring Boot Actuator(必须) -->
<dependency>
    <groupId>org.springframework.boot</groupId>
    <artifactId>spring-boot-starter-actuator</artifactId>
</dependency>

<!-- Micrometer Prometheus Registry(必须) -->
<dependency>
    <groupId>io.micrometer</groupId>
    <artifactId>micrometer-registry-prometheus</artifactId>
</dependency>
配置 application.yml :
添加配置:
#prometheus 监控插件
management:
  endpoints:
    web:
      exposure:
        include: '*'
  metrics:
    export:
      prometheus:
        enabled: true
        rsocket:
          enabled: false  # 如果不需要RSocket支持可以禁用它
        step: 1m  # 指标的步长,可以根据需要调整
  endpoint:
    prometheus:
      enabled: true          # 确保启用(默认一般是 true)
访问 Prometheus 指标接口:
启动后,访问以下 URL(替换 IP 和端口):
http://<your-app>:<port>/actuator/prometheus
如果成功了 浏览器输出如下内容:
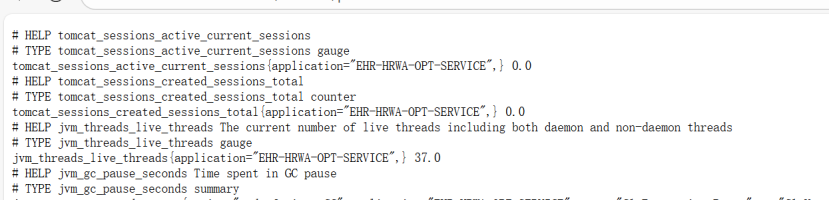
2.Prometheus 定时拉取:
在你的Prometheus 配置文件(prometheus.yml)中,添加一个 job,指向你的 Spring Boot 3 应用:
scrape_configs:
  # The job name is added as a label `job=<job_name>` to any timeseries scraped from this config.
  - job_name: "prometheus"
    # metrics_path defaults to '/metrics'
    # scheme defaults to 'http'.
    static_configs:
      - targets: ["localhost:9090"]

  - job_name: "ehr-hrwa-opt-service19" # Spring Boot 3 应用监控
    scrape_interval: 5s        # 采集间隔(默认15s,微服务建议缩短)
    metrics_path: '/actuator/prometheus'  # 指标接口路径
    static_configs:
      - targets: ["172.0.0.0:8081"]
如果是微服务多节点使用以下配置:
  - job_name: 'ehr-hrwabat-service'  # 任务名称
    scrape_interval: 5s        # 采集间隔(默认15s,微服务建议缩短)
    metrics_path: '/management/prometheus'  # 指标接口路径
    static_configs:
      - targets:  # 微服务实例列表(IP:端口)
          - '172.1.16.13:5050'  # 服务1
          - '172.1.16.14:5050'  # 服务2
          - '172.1.16.15:5050'  # 服务3
          - '172.1.16.16:5050'  # 服务4
          - '172.1.16.17:5050'  # 服务5
          - '172.1.16.18:5050'  # 服务6

  - job_name: 'ehr-hrwa-opt-service'  # 任务名称
    scrape_interval: 5s        # 采集间隔(默认15s,微服务建议缩短)
    metrics_path: '/actuator/prometheus'  # 指标接口路径
    static_configs:
      - targets:  # 微服务实例列表(IP:端口)
          - '172.1.16.19:8080'  # 服务1
          - '172.1.16.20:8080'  # 服务2
          - '172.1.16.21:8080'  # 服务3
          - '172.1.16.22:8080'  # 服务4
          - '172.1.16.23:8080'  # 服务5
          - '172.1.16.24:8080'  # 服务6
替换yml文件后,重启prometheus :
systemctl stop prometheus
systemctl start prometheus
在 Prometheus UI 中验证是否拉取成功:
打开 Prometheus Web 界面:http://<prometheus-ip>:9090
进入 Status → Targets
找到你配置的 job(如 ehr-hrwa-opt-service19)
查看对应 target(如 localhost:8080)的状态是否为 UP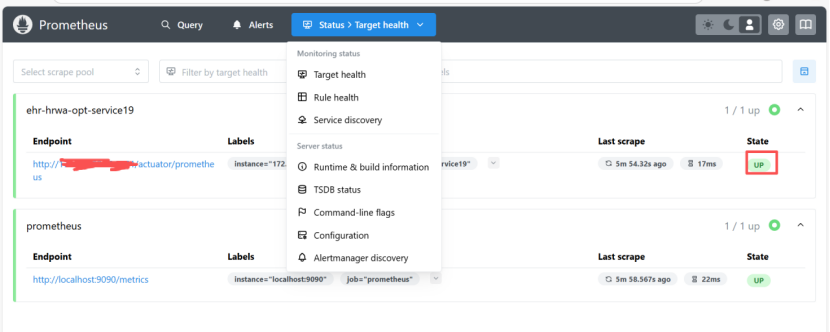
集成 Grafana:
创建Grafana Dashboards 其实只有两步:
1.选择可视化面板的模板(load模板id),2.选择Prometheus 数据源。
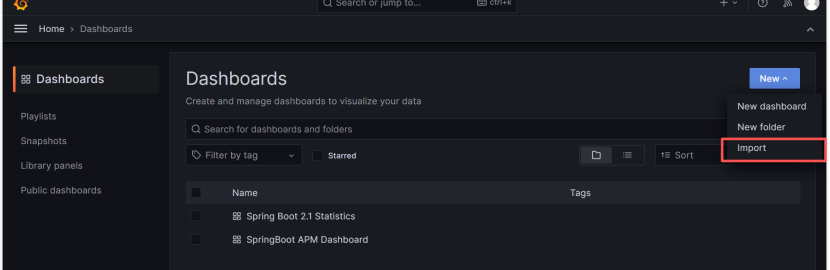
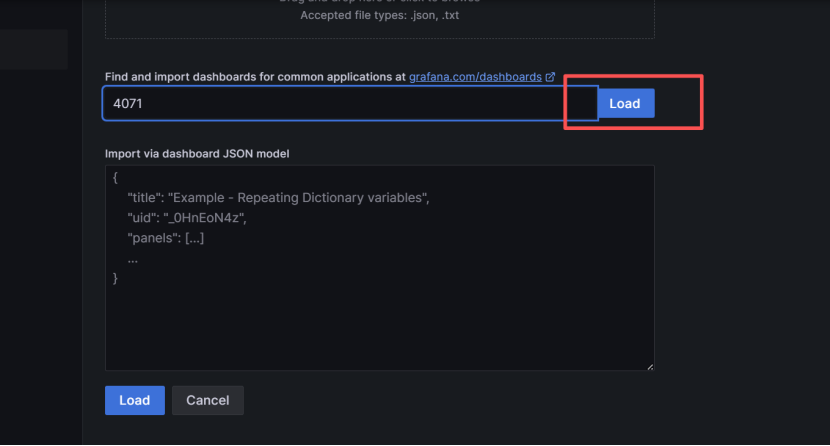
1.点击左侧菜单:Dashboards → Import
2.在弹窗中输入 Dashboard ID(比如 7362)
3.选择你的 Prometheus 数据源(确保已正确配置)
4.点击 Import,Grafana 会自动加载该 Dashboard 模板选择可视化面板的模板
访问grafana:http://localhost:3000/login
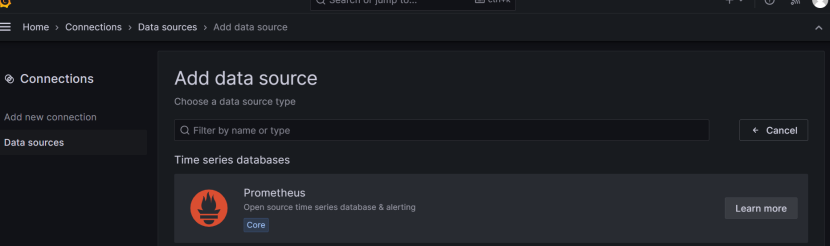
先添加数据源:
点击 配置按钮 -> Data sources -> Add data source
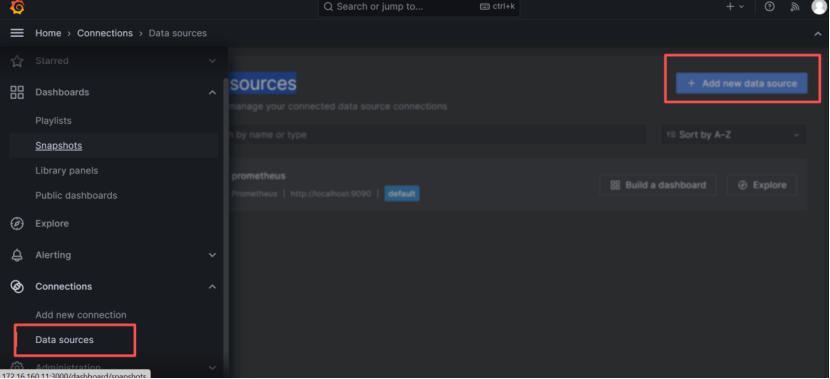
点击 "Add data source",选择 "Prometheus"
配置:
Name: Prometheus
URL: http://localhost:9090(或者你的 Prometheus 服务 IP:9090)
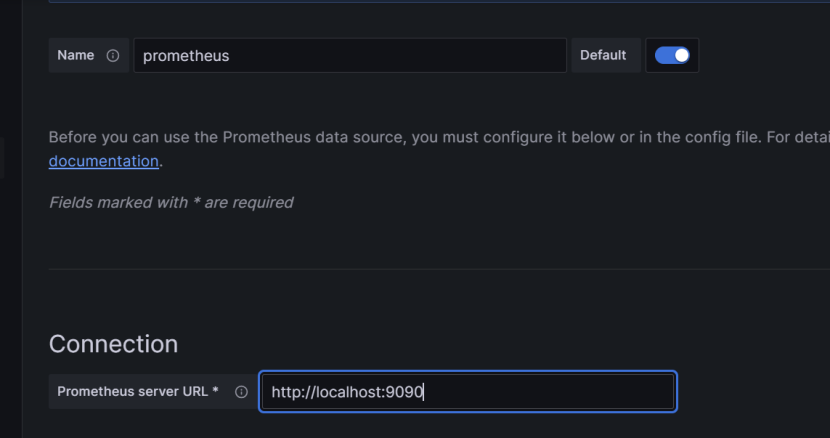
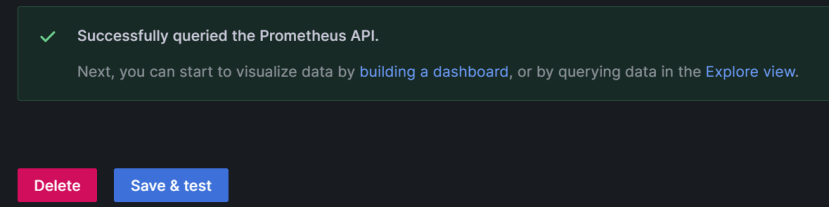
点击 "Save & Test",验证连接是否成功
点击 Dashboards -> Import 导入模板:
根据自己需要找对应的模板:12900(springboot综合监控,包括 HTTP、JVM、Tomcat、请求、错误等)、4701(JVM 相关指标:堆内存、GC、线程、类加载等)、7362(包括 HTTP 请求、状态码、延迟、错误等)
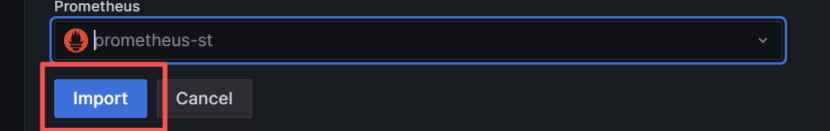
最下面选择Prometheus 数据源:
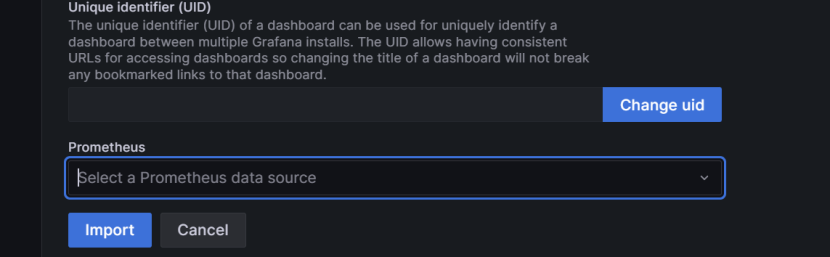
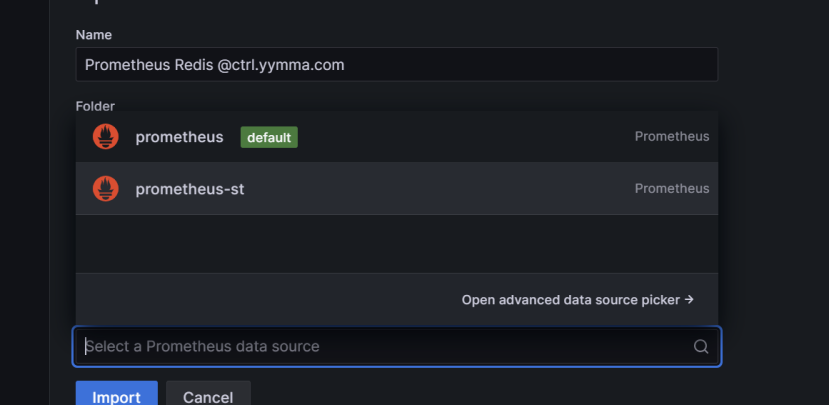
点击导入:
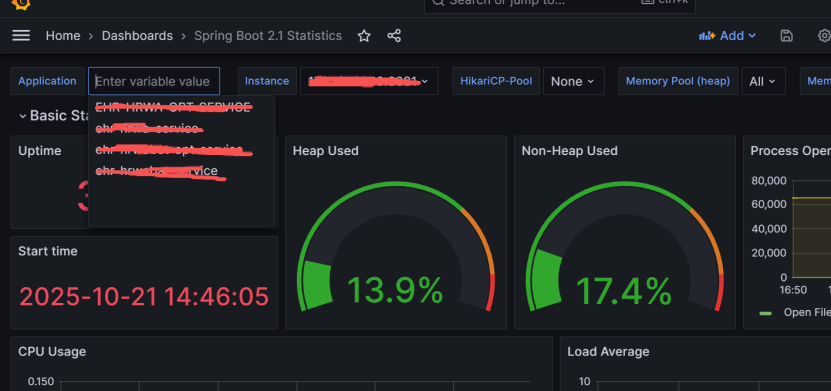
加载Dashboards 成功以后如下:
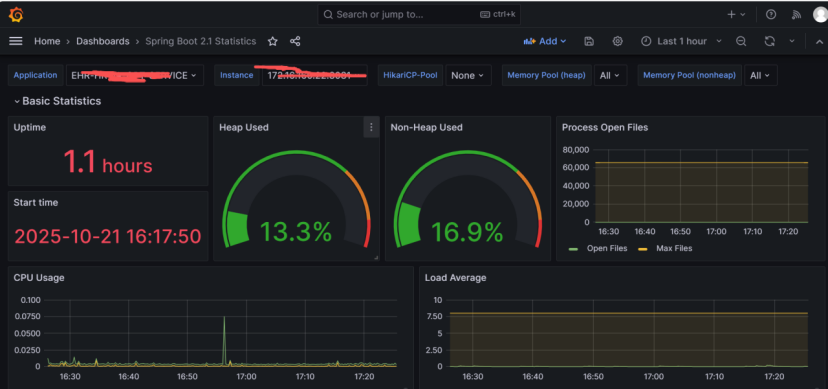
prometheus.yml 中配置了几个job_name,这里就有几个应用:
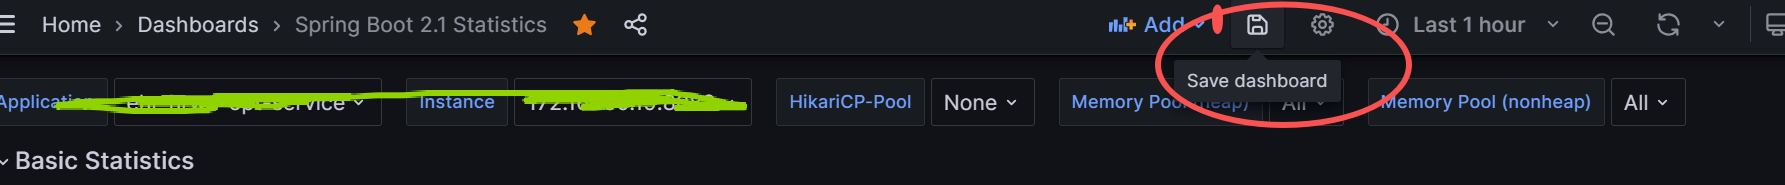
点击保存 save Dashboards,保存可视化面板,方便以后使用。
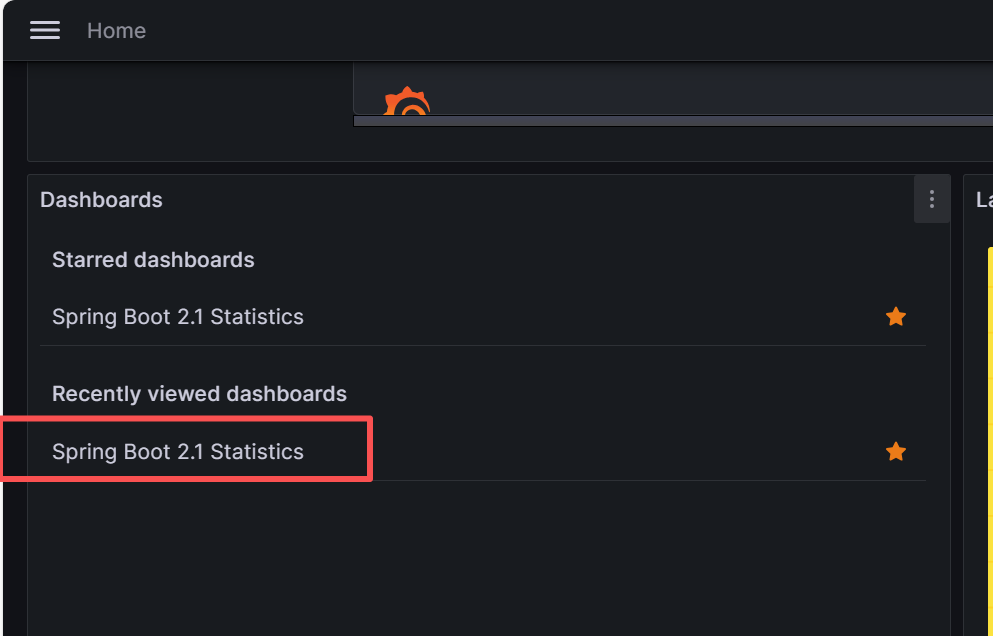
1.在Grafana的Web界面中,点击左侧导航栏中的"Dashboard"。
-
在"Recently viewed dashboards"中,可以找到刚刚导入的监控模板。
-
点击模板,即可进入监控面板。