软件说明:
所有软件包下载地址:https://www.elastic.co/cn/downloads/past-releases
打开页面后选择对应的组件及版本即可!

所有软件包名称如下:

架构拓扑:
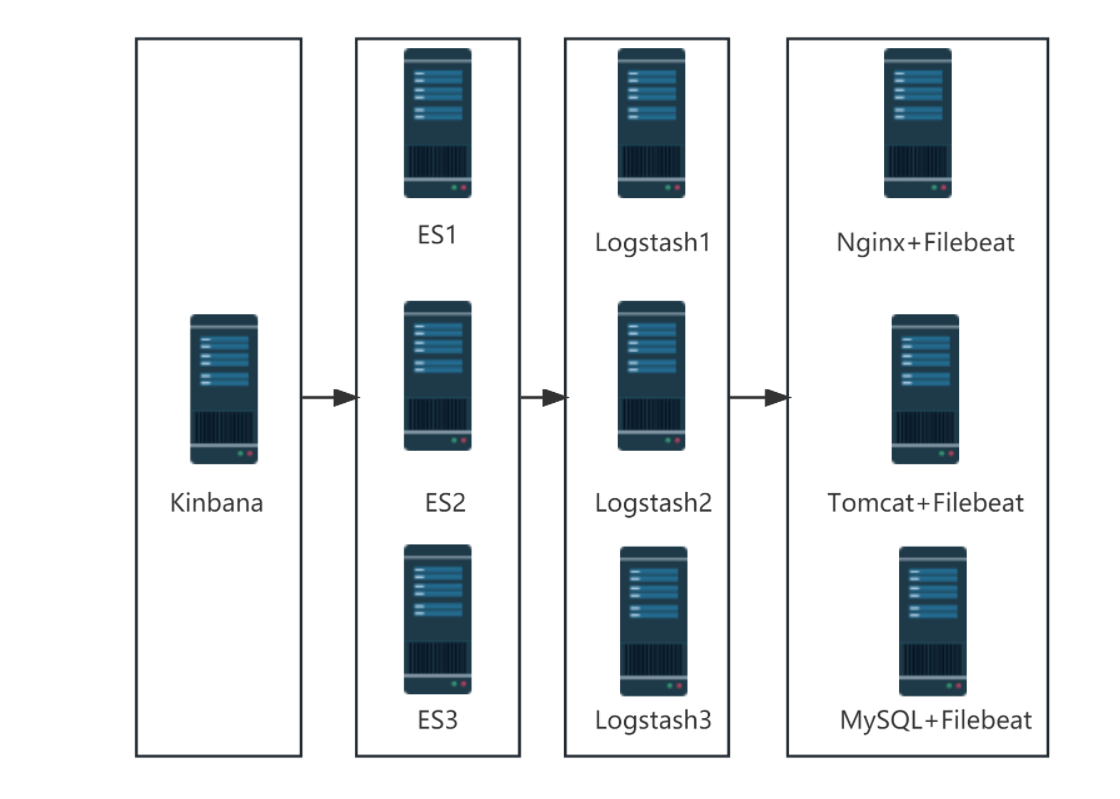
- 集群模式:
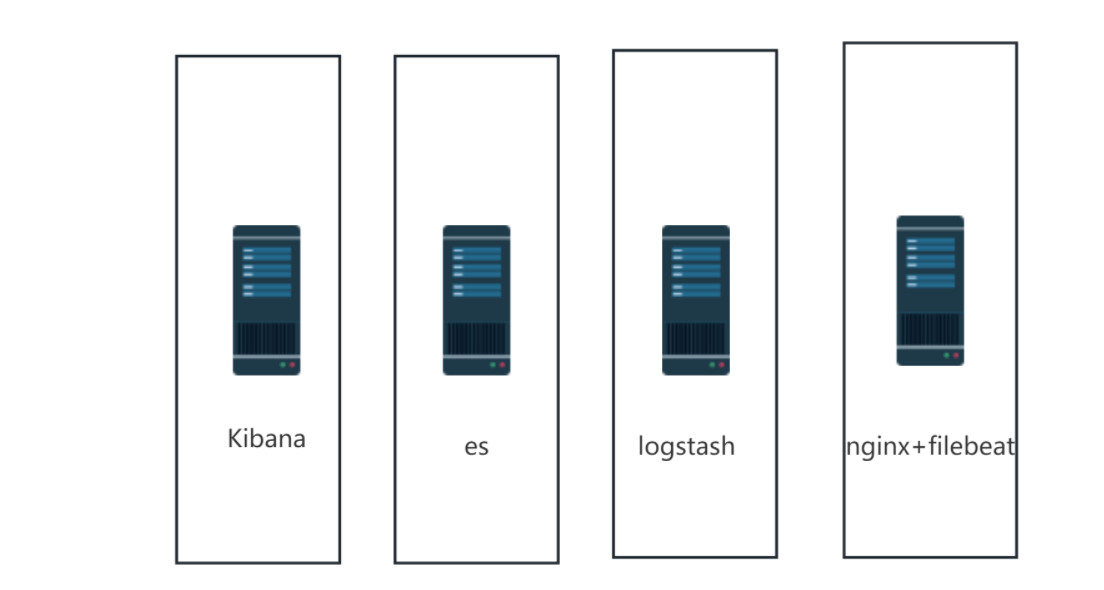
单机模式
架构规划:
- 集群模式
| 角色 | 主机名 | IP地址 |
|---|---|---|
| 图形展示 | kibana | 192.168.166.111 |
| 日志存储 | es1 | 192.168.158.6 |
| es2 | 192.168.166.113 | |
| es3 | 192.168.166.114 | |
| 日志收集分析 | lostash1 | 192.168.166.166 |
| lostash2 | 192.168.166.116 | |
| lostash3 | 192.168.166.117 | |
| 日志采集 | access、error | 192.168.166.118 |
-
单机模式
角色 主机名 IP地址 图形展示 kibana 192.168.166.111 日志存储 es 192.168.158.6 日志收集分析 lostash 192.168.166.113 日志采集 access、error 192.168.166.114 说明:以下部署过程为单机模式部署,集群模式请自行修改部署!!!
一、 Elasticsearch安装与配置
修改主机名
root@localhost \~# hostnamecl set-hostname es
root@localhost \~# bash
root@es \~#
配置主机名解析
root@es \~# cat /etc/hosts
192.168.166.111 kibana
192.168.158.6 es
192.168.166.113 logstash
192.168.166.114 nginx
安装JAVA8
root@es \~# yum install -y java
将elasticsearch软件包拷贝至elk主机执行安装
root@es \~# yum localinstall -y elasticsearch-7.1.1-x86_64.rpm
配置elasticsearch
bash
[root@es ~]# cd /etc/elasticsearch/
[root@es elasticsearch]# cat elasticsearch.yml | grep -Ev "^#"
cluster.name: my-application #集群名称
node.name: es #节点主机名
path.data: /var/lib/elasticsearch #数据存放目录
path.logs: /var/log/elasticsearch #日志存放目录
network.host: 192.168.158.6 #监听IP地址
http.port: 9200 #监听端口号
cluster.initial_master_nodes: ["es"] #主节点
http.cors.enabled: true
http.cors.allow-origin: "*"

#####集群模式下修改为如下配置:
cluster.name: my-application #集群名称
node.name: es #节点主机名
path.data: /var/lib/elasticsearch #数据存放目录
path.logs: /var/log/elasticsearch #日志存放目录
network.host: 192.168.158.6 #监听IP地址
http.port: 9200 #监听端口号
http.cors.enabled: true #跨域访问
http.cors.allow-origin: "*" #跨域访问
cluster.initial_master_nodes: ["192.168.158.6","192.168.166.113","192.168.166.114"] #主节点
discovery.zen.ping.unicast.hosts: ["192.168.158.6", "192.168.166.113", "192.168.166.114"] # 配置自动发现
discovery.zen.minimum_master_nodes: 2 #防止集群"脑裂",需要配置集群最少主节点数目,通常为 (主节点数目/2) + 1
启动elasticsearch服务并设置开机自启动
root@es \~# systemctl start elasticsearch.service
root@es \~# systemctl enable elasticsearch.service
验证启动结果
root@es \~# systemctl status elasticsearch.service
root@es \~# ss -antl|grep 9200
es续期
curl -XPOST 'http://192.168.158.31:9200/_license/start_trial?acknowledge=true'
二、 logstash安装与配置
修改主机名
root@localhost \~# hostnamecl set-hostname logstash
root@localhost \~# bash
root@logstash \~#
配置主机名解析
root@logstash \~# cat /etc/hosts
192.168.166.111 kibana
192.168.158.6 es
192.168.166.113 logstash
192.168.166.114 nginx
安装JAVA8(系统自带)
root@logstash \~# yum install -y java
将logstash软件包拷贝至elk主机执行安装
root@logstash \~# yum localinstall -y logstash-7.1.1.rpm
优化logstash命令
root@logstash \~# ln -s /usr/share/logstash/bin/logstash /usr/local/bin/
配置logstash
root@logstash \~# cd /etc/logstash/
root@logstash logstash# cat logstash.yml
path.data: /var/lib/logstash #数据存储路径
http.host: "192.168.166.113" #监听地址
http.port: 9600-9700 #监听端口范围
path.logs: /var/log/logstash #日志存储路径
测试logstash服务的数据传输
##标准输入与输出
root@logstash \~# logstash -e 'input{ stdin{} }output { stdout{} }'
##使用rubydebug解码
root@logstash \~# logstash -e 'input { stdin{} } output { stdout{ codec=>rubydebug }}'
##输出到elasticsearch
root@logstash \~# logstash -e 'input { stdin{} } output { elasticsearch{ hosts=>"192.168.158.6:9200"} }'
创建配置文件
1、使用tags标签
bash
[root@logstash ~]# cd /etc/logstash/conf.d/logstash/conf.d
[root@logstash ~]# cat pipline.conf
input {
  beats {
    port => 5044
  }
}
output {
  if "access" in [tags] {
  	  elasticsearch {
   		 hosts => ["192.168.158.6:9200"]
   		 index => "access-%{+YYYY.MM.dd}"
  	}
  }
  if "error" in [tags] {
  	  elasticsearch {
   		 hosts => ["192.168.158.6:9200"]
   		 index => "error-%{+YYYY.MM.dd}"
  	}
  }
###日志进行标准输出,观察日志获取的过程###
  stdout {
  		codec => rubydebug
  }
}

#####集群模式下修改问如下配置:
input {
  beats {
    port => 5044
  }
}
output {
  if "access" in [tags] {
  	  elasticsearch {
   		 hosts => ["192.168.158.6:9200"]
   		 index => "access-%{+YYYY.MM.dd}"
  	}
  }
  if "error" in [tags] {
  	  elasticsearch {
   		 hosts => ["192.168.158.6:9200"]
   		 index => "error-%{+YYYY.MM.dd}"
  	}
  }
###日志进行标准输出,观察日志获取的过程###
  stdout {
  		codec => rubydebug
  }
}
2、使用filter过滤器
bash
input {
        file {
                path => "/var/log/messages"
                start_position => "beginning"
        }
        beats {
                port => 5044
        }
}
filter {
  if [host][name] {
    mutate { add_field => { "hostname" => "%{[host][name]}" } }
  }
  else if [agent][hostname] {
    mutate { add_field => { "hostname" => "%{[agent][hostname]}" } }
  }
  else {
    mutate { add_field => { "hostname" => "%{host}" } }
  }
}
output {
  if [hostname] == "logstash" {
        elasticsearch {
                hosts => ["192.168.158.79:9200"]
                index => "system-log-%{+YYYY.MM.dd}"
        }
  }
  else if [hostname] == "web1" {
        elasticsearch {
                hosts => ["192.168.158.79:9200"]
                index => "web1-log-%{+YYYY.MM.dd}"
        }
  }
  stdout {
        codec => rubydebug
  }
}
收集不同主机及对应应用的不同日志
bash
input {
        file {
                path => "/var/log/messages"
                start_position => "beginning"
        }
        beats {
                port => 5044
        }
}
filter {
  if [host][name] {
    mutate { add_field => { "hostname" => "%{[host][name]}" } }
  }
  else if [agent][hostname] {
    mutate { add_field => { "hostname" => "%{[agent][hostname]}" } }
  }
  else {
    mutate { add_field => { "hostname" => "%{host}" } }
  }
}
output {
  if [hostname] == "logstash" {
        elasticsearch {
                hosts => ["192.168.158.79:9200"]
                index => "system-log-%{+YYYY.MM.dd}"
        }
  }
  else if [hostname] == "web1" {
    if "system" in [tags] {
        elasticsearch {
                hosts => ["192.168.158.79:9200"]
                index => "web1-log-%{+YYYY.MM.dd}"
        }
    }
    if "nginx-access" in [tags] {
        elasticsearch {
                hosts => ["192.168.158.79:9200"]
                index => "web1-nginx-access-log-%{+YYYY.MM.dd}"
        }
    }
    if "nginx-error" in [tags] {
        elasticsearch {
                hosts => ["192.168.158.79:9200"]
                index => "web1-nginx-error-log-%{+YYYY.MM.dd}"
        }
    }
  }
  stdout {
        codec => rubydebug
  }
}
启动logstash服务
root@logstash \~# logstash -f /etc/logstash/conf.d/pipline.conf &
三、 nginx、filebeat安装与配置
修改主机名
root@localhost \~# hostnamecl set-hostname nginx
root@localhost \~# bash
root@nginx \~#
配置主机名解析
root@logstash \~# cat /etc/hosts
192.168.166.111 kibana
192.168.158.6 es
192.168.166.113 logstash
192.168.166.114 nginx
nginx安装与启动
root@nginx \~# yum install -y epel-release
root@nginx \~# yum install -y nginx
root@nginx \~# systemctl start nginx
filebeat安装
root@nginx \~# yum localinstall -y filebeat-7.1.1-x86_64.rpm
filebeat配置项
root@nginx \~# cd /etc/filebeat
root@nginx \~# cat filebeat.yml
| 配置项 | 作用 |
|---|---|
| filebeat.inputs | 输入配置块,用于指定 Filebeat 应该监听哪些文件并将其作为输入。你可以指定文件路径、文件类型、文件格式等。 |
| filebeat.prospectors | 这是一种更灵活的输入方式,它允许你同时监听多个目录或文件系统中的多个文件。它结合了输入和输出配置项,使得配置更加灵活。 |
| filebeat.config | 用于加载和执行自定义的配置文件。你可以使用此选项加载其他 YAML 文件,以便在 Filebeat 中使用自定义规则和插件。 |
| output.elasticsearch | 输出配置块,用于将日志数据发送到 Elasticsearch。你可以指定 Elasticsearch 的地址、端口、索引名称等。 |
| output.logstash | 输出配置块,用于将日志数据发送到 Logstash。你可以指定 Logstash 的地址、端口、输入格式等。 |
| filebeat.harvester | Harvester 是 Filebeat 的核心组件之一,负责监听文件并将其拆分为事件。你可以通过配置项来调整 Harvester 的行为,例如事件级别、分隔符等。 |
| filebeat.scanner | Scanner 负责定期扫描指定路径中的新文件并触发事件收集。你可以通过配置项来调整 Scanner 的行为,例如扫描频率、延迟等。 |
| filebeat.processor | 处理器用于对收集到的日志事件进行处理和解析。你可以使用内置的处理器类型(如过滤器、映射器等)来对事件进行过滤、转换和编码。 |
| filebeat.registry | 注册表用于存储 Filebeat 的配置信息、事件数据和资源状态。你可以通过配置项来调整注册表的行为和存储方式。 |
日志收集
filebeat 7.1以上支持模版收集日志和传统方式收集日志,具体每个方式的配置如下:
1、 采用filebeat的nginx模块收集nginx日志
bash
##filebeat模块操作命令:
#查看支持的模块
[root@nginx ~]# filebeat modules list
#启用nginx模块
[root@nginx ~]# filebeat modules enable nginx
#配置nginx模块
[root@nginx ~]# cd /etc/filebeat/modules.d
[root@nginx ~]# cat nginx.yml
- module: nginx
  # Access logs
  access:
    enabled: true
    var.paths: ["/var/log/nginx/access.log"]
  # Error logs
  error:
    enabled: true
    var.paths: ["/var/log/nginx/error.log"]
#################测试配置文件
[root@localhost ~]# filebeat test config -e
2、传统方式收集
【输出给logstash】
bash
[root@localhost ~]# cat /etc/filebeat/filebeat.yml
filebeat.inputs:
- type: log
  enabled: true
  paths:
    - /var/log/access/*.log
  tags: "nignx1"
- type: log
  enabled: true
  paths:
    - /var/log/error/*.log
  tags: "nignx2"
output.logstash:
  hosts: ["192.168.166.113:5044"]
#################测试配置文件
[root@localhost ~]# filebeat test config -e【输出给elasticsearch】
bash
[root@localhost ~]# cat /etc/filebeat/filebeat.yml
filebeat.inputs:
- type: log
  enabled: true
  paths:
    - /var/log/nginx/access.log
    - /var/log/nginx/error.log
output.elasticsearch:
  # Array of hosts to connect to.
  hosts: ["192.168.166.129:9200"]
  index: "nginx-access-%{[host.name]}-%{+yyyy.MM.dd}"# 自定义索引名称
setup.ilm.enabled: false   # 索引生命周期 ilm 功能默认开启,开启情况下索引名称只能为 filebeat-*
setup.template.name: "nginx1" # 定义模板名称
setup.template.pattern: "nginx1-*" # 定义模板的匹配索引名称

#####产生不同索引的方法#####
output.elasticsearch:
  # Array of hosts to connect to.
  hosts: ["192.168.166.22:9200"]
  indices:
   - index: "nginx1-access-logs"
     when:
      contains:
       { "message": "GET"}
   - index: "nginx1-error-logs"
     when:
      contains:
       { "message": "error" }
setup.ilm.enabled: false
setup.template.name: "nginx1"
setup.template.pattern: "nginx1-*"

#################测试配置文件
[root@localhost ~]# filebeat test config -e
启动filebeat
root@nginx \~# systemctl start filebeat
root@nginx \~# systemctl enabled filebeat
四、 Kibana安装与配置
修改主机名
root@localhost \~# hostnamecl set-hostname logstash
root@localhost \~# bash
root@logstash \~#
配置主机名解析
root@logstash \~# cat /etc/hosts
192.168.166.111 kibana
192.168.158.6 elk
192.168.166.113 logstash
192.168.166.114 nginx
192.168.166.166 tomcat
192.168.166.116 mysql
安装JAVA8
root@logstash \~# yum install -y java
将logstash软件包拷贝至elk主机执行安装
root@logstash \~# yum localinstall -y kibana-7.1.1-x86_64.rpm
配置kibana
bash
[root@kibana]# cd /etc/kibana/
[root@kibana kibana]# cat kibana.yml
server.port: 5601 #监听端口
server.host: "192.168.166.111" #监听地址
server.name: "kibana" #主机名
elasticsearch.hosts: ["http://192.168.158.6:9200"] #连接的elasticsearch服务器
kibana.index: ".kibana" #kibana的索引
i18n.locale: "zh-CN" #汉化
##集群模式下配置:
server.port: 5601 #监听端口
server.host: "192.168.166.111" #监听地址
server.name: "kibana" #主机名
elasticsearch.hosts: ["http://192.168.158.6:9200","http://192.168.166.113:9200","http://192.168.166.114:9200"] #连接的elasticsearch服务器
kibana.index: ".kibana" #kibana的索引
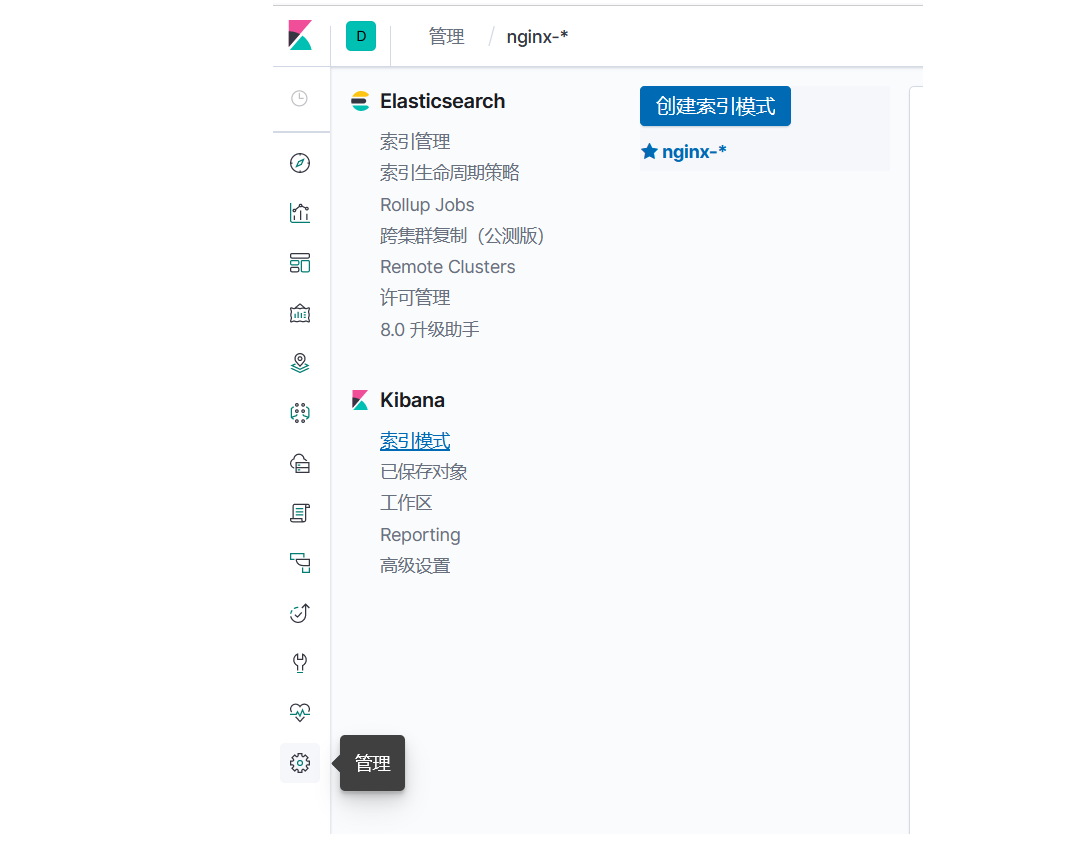
i18n.locale: "zh-CN" #汉化访问kibana
#在浏览器中输入:
创建索引
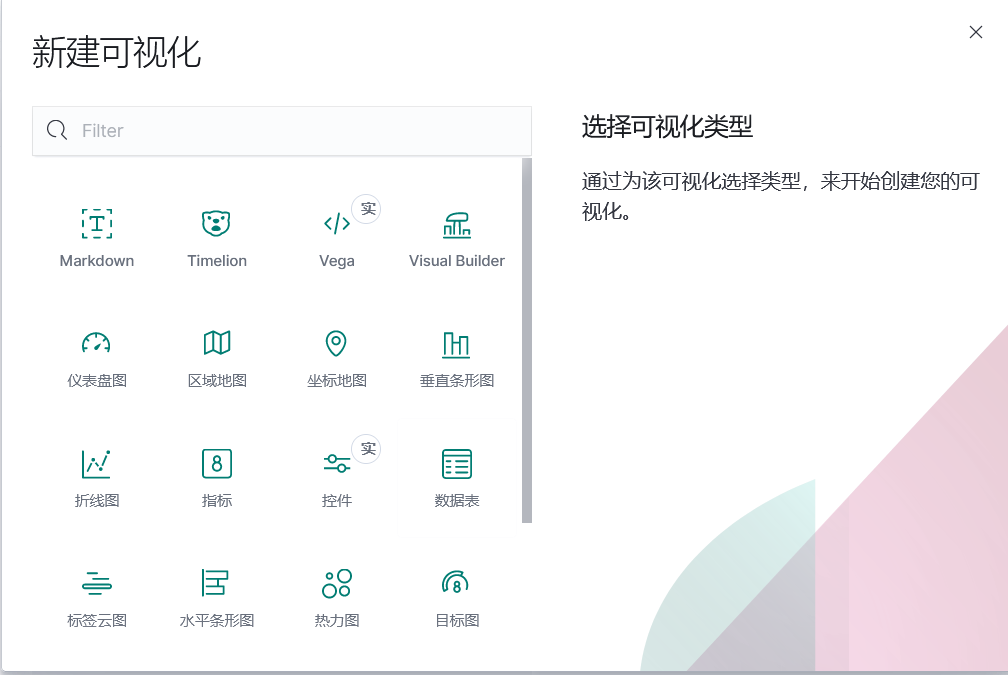
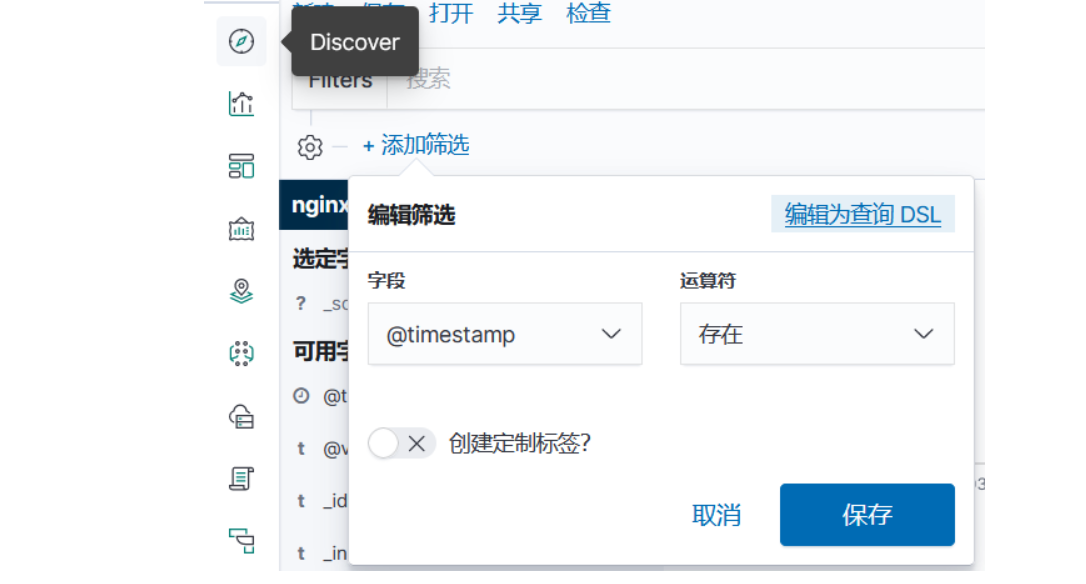
创建筛选
添加仪表盘