👨⚕️ 主页: gis分享者
👨⚕️ 感谢各位大佬 点赞👍 收藏⭐ 留言📝 加关注✅!
文章目录
- 一、🍀前言
-
- [1.1 ☘️CanvasTexture 纹理贴图](#1.1 ☘️CanvasTexture 纹理贴图)
-
- [1.1.1 ☘️构造函数](#1.1.1 ☘️构造函数)
- [1.1.2 ☘️属性](#1.1.2 ☘️属性)
- [1.1.3 ☘️方法](#1.1.3 ☘️方法)
- 二、🍀添加ECharts图表
-
- [1. ☘️实现思路](#1. ☘️实现思路)
- [2. ☘️代码样例](#2. ☘️代码样例)
一、🍀前言
本文详细介绍如何基于threejs在三维场景中添加ECharts图表,亲测可用。希望能帮助到您。一起学习,加油!加油!
1.1 ☘️CanvasTexture 纹理贴图
CanvasTexture 从Canvas元素中创建纹理贴图。
1.1.1 ☘️构造函数
CanvasTexture( canvas : HTMLElement, mapping : Constant, wrapS : Constant, wrapT : Constant, magFilter : Constant, minFilter : Constant, format : Constant, type : Constant, anisotropy : Number )
canvas -- 将会被用于加载纹理贴图的Canvas元素。
mapping -- 纹理贴图将被如何应用(映射)到物体上,它是THREE.UVMapping中的对象类型。
wrapS -- 默认值是THREE.ClampToEdgeWrapping.
wrapT -- 默认值是THREE.ClampToEdgeWrapping.
magFilter -- 当一个纹素覆盖大于一个像素时,贴图将如何采样。 其默认值为THREE.LinearFilter。
minFilter -- 当一个纹素覆盖小于一个像素时,贴图将如何采样。 其默认值为THREE.LinearMipmapLinearFilter。
format -- 在纹理贴图中使用的格式。
type -- 默认值是THREE.UnsignedByteType.
anisotropy -- 沿着轴,通过具有最高纹素密度的像素的样本数。 默认情况下,这个值为1。设置一个较高的值将会产生比基本的mipmap更清晰的效果,代价是需要使用更多纹理样本。 使用renderer.getMaxAnisotropy() 来查询GPU中各向异性的最大有效值;这个值通常是2的幂。
1.1.2 ☘️属性
.isCanvasTexture : Boolean
用于检查给定对象是否为 CanvasTexture 类型的只读标志。
.needsUpdate : Boolean
默认值为true,这是必须的,以便使得Canvas中的数据能够载入。
共有方法请参见其基类Texture。
1.1.3 ☘️方法
共有方法请参见其基类Texture。
二、🍀添加ECharts图表
1. ☘️实现思路
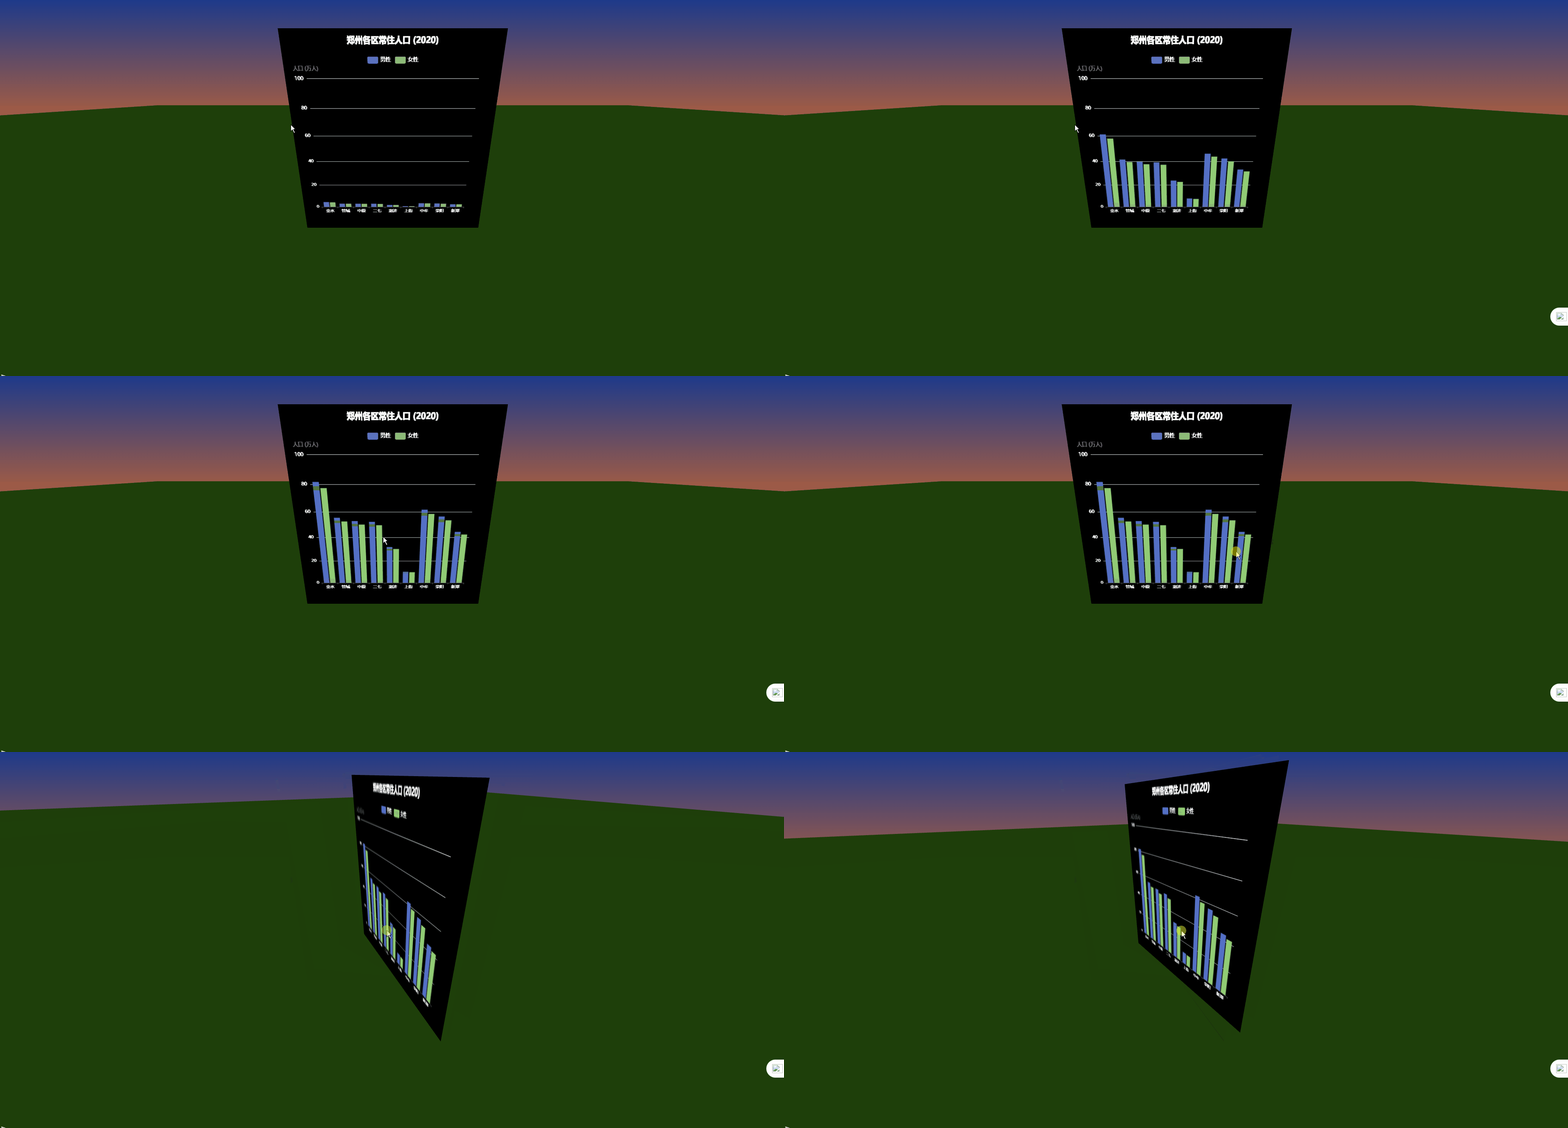
threejs 结合echarts,实现三维场景添加echarts图表,具体代码参考下面代码样例.
2. ☘️代码样例
html
<!DOCTYPE html>
<html lang="zh-CN">
<head>
    <meta charset="UTF-8">
    <meta name="viewport" content="width=device-width, initial-scale=1.0">
    <title>Three.js 场景中的 ECharts 图表 - 郑州人口画像</title>
    <style>
        body { margin: 0; overflow: hidden; }
        canvas { display: block; }
    </style>
</head>
<body>
<script src="https://cdnjs.cloudflare.com/ajax/libs/three.js/r128/three.min.js"></script>
<script src="https://cdn.jsdelivr.net/npm/echarts@5.4.3/dist/echarts.min.js"></script>
<script src="https://cdn.jsdelivr.net/npm/three@0.128.0/examples/js/controls/OrbitControls.js"></script>
<script>
  // 创建 ECharts 的画布
  const echartsCanvas = document.createElement('canvas');
  echartsCanvas.width = 512;
  echartsCanvas.height = 512;
  const chart = echarts.init(echartsCanvas);
  // 配置 ECharts 柱状图(郑州各区人口数据,包含男性和女性)
  const option = {
    title: {
      text: '郑州各区常住人口 (2020)',
      left: 'center',
      top: '2%',
      textStyle: { color: '#fff' }
    },
    legend: {
      data: ['男性', '女性'],
      top: '10%',
      left: 'center',
      textStyle: { color: '#fff' },
      selectedMode: true // 允许点击切换显示
    },
    grid:{
      top:'20%'
    },
    tooltip: {
      trigger: 'axis',
      axisPointer: { type: 'shadow' },
      formatter: function(params) {
        return `${params[0].name}:<br/>男性: ${params[0].value} 万人<br/>女性: ${params[1].value} 万人`;
      }
    },
    xAxis: {
      type: 'category',
      data: ['金水', '管城', '中原', '二七', '惠济', '上街', '中牟', '荥阳', '新郑'],
      axisLabel: { color: '#fff' }
    },
    yAxis: {
      type: 'value',
      name: '人口 (万人)',
      axisLabel: { color: '#fff' }
    },
    series: [
      {
        name: '男性',
        type: 'bar',
        data: [81.60, 55.43, 52.86, 52.35, 31.82, 10.26, 61.58, 56.45, 44.46],
        itemStyle: { color: '#5470c6' }
      },
      {
        name: '女性',
        type: 'bar',
        data: [77.40, 52.57, 50.14, 49.65, 30.18, 9.74, 58.42, 53.55, 42.17],
        itemStyle: { color: '#91cc75' }
      }
    ],
    backgroundColor: 'rgba(0,0,0,0.1)' // 透明背景
  };
  chart.setOption(option);
  // Three.js 场景设置
  const scene = new THREE.Scene();
  const camera = new THREE.PerspectiveCamera(75, window.innerWidth / window.innerHeight, 0.1, 1000);
  camera.position.set(0, 2, 5);
  const renderer = new THREE.WebGLRenderer({ antialias: true });
  renderer.setSize(window.innerWidth, window.innerHeight);
  document.body.appendChild(renderer.domElement);
  // 创建落日天空效果(渐变背景)
  const gradientTexture = new THREE.CanvasTexture(generateGradientCanvas());
  scene.background = gradientTexture;
  function generateGradientCanvas() {
    const canvas = document.createElement('canvas');
    canvas.width = 512;
    canvas.height = 512;
    const context = canvas.getContext('2d');
    const gradient = context.createLinearGradient(0, 0, 0, 512);
    gradient.addColorStop(0, '#1e3a8a'); // 深蓝色(天空顶部)
    gradient.addColorStop(0.5, '#f97316'); // 橙色(落日中部)
    gradient.addColorStop(1, '#dc2626'); // 红色(地平线)
    context.fillStyle = gradient;
    context.fillRect(0, 0, 512, 512);
    return canvas;
  }
  // 创建土地
  const groundGeometry = new THREE.PlaneGeometry(100, 100);
  const groundMaterial = new THREE.MeshLambertMaterial({ color: 0x228B22 }); // 绿色草地
  const ground = new THREE.Mesh(groundGeometry, groundMaterial);
  ground.rotation.x = -Math.PI / 2; // 旋转使其水平
  ground.position.y = -1; // 放置在场景下方
  scene.add(ground);
  // 创建显示 ECharts 纹理的平面
  const texture = new THREE.CanvasTexture(echartsCanvas);
  const material = new THREE.MeshBasicMaterial({ map: texture, side: THREE.DoubleSide });
  const geometry = new THREE.PlaneGeometry(4, 4);
  const plane = new THREE.Mesh(geometry, material);
  plane.position.y = 1; // 稍微抬高以避免与地面重叠
  scene.add(plane);
  // 添加环境光
  const ambientLight = new THREE.AmbientLight(0xffa07a, 0.6); // 偏暖的环境光以匹配落日
  scene.add(ambientLight);
  // 添加方向光,模拟落日光线
  const directionalLight = new THREE.DirectionalLight(0xff4500, 0.7); // 橙红色光线
  directionalLight.position.set(-5, 3, -5); // 光从低角度射入
  scene.add(directionalLight);
  // 添加轨道控制器并限制角度
  const controls = new THREE.OrbitControls(camera, renderer.domElement);
  controls.minPolarAngle = 0; // 限制最小垂直角度(仰角)为水平(0 弧度)
  controls.maxPolarAngle = Math.PI / 2; // 限制最大垂直角度为水平(90度,π/2 弧度)
  controls.update();
  // 动画循环
  function animate() {
    requestAnimationFrame(animate);
    texture.needsUpdate = true; // 更新纹理以反映图表变化
    renderer.render(scene, camera);
  }
  animate();
  // 处理窗口大小调整
  window.addEventListener('resize', () => {
    camera.aspect = window.innerWidth / window.innerHeight;
    camera.updateProjectionMatrix();
    renderer.setSize(window.innerWidth, window.innerHeight);
  });
</script>
</body>
</html>
效果如下:
