<template>
<div class="weather-container">
<div class="weather-top">
<!-- 市区选择和更新时间 -->
<p class="city-select padding-l-r-10">
<el-select
v-model="selectDistrict"
size="mini"
placeholder="请选择"
class="select-district"
>
<el-option
v-for="item in districtOptions"
:key="item.value"
:label="item.label"
:value="item.value"
>
</el-option>
</el-select>
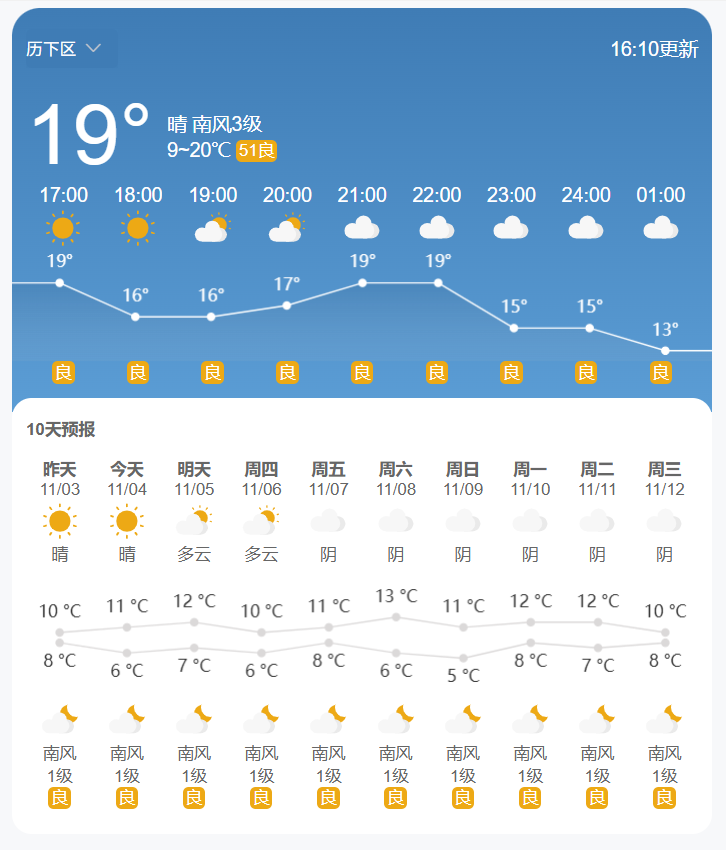
<span>16:10更新</span>
</p>
<!-- 当前温度情况 -->
<div class="current padding-l-r-10">
<span class="temperature">19°</span>
<div class="current-situation">
<div>晴 南风3级</div>
<div>9~20℃ <span class="quality">51良</span></div>
</div>
</div>
<!-- 气温时间点 -->
<div class="hourly padding-l-r-10">
<div v-for="h in hourly" :key="h.time" class="cell">
<div>{{ h.time }}</div>
<img class="icon" :src="h.status | weatherIcon" />
</div>
</div>
<!-- 时间点温度折线图 -->
<div class="temperature-echart">
<echartsIndex id="hourTemperature" :option="hourTemperatureOption" />
</div>
<!-- 空气质量 -->
<div class="hourly padding-l-r-10">
<div v-for="(q, i) in hourly" :key="i" class="cell">
<div :class="q.quality | qualityClass">{{ q.quality }}</div>
</div>
</div>
</div>
<div class="weather-bottom">
<div class="forecast-title font-weight">
<span>10天预报</span>
<p>
<!-- <span>趋势</span>
/
<span>列表</span> -->
</p>
</div>
<!-- 10天天气情况 -->
<div class="weather-forecast">
<div v-for="f in forecastData" :key="f.date" class="cell">
<div class="font-weight">{{ f.day }}</div>
<div>{{ f.date }}</div>
<img class="icon" :src="f.daytimeState | weatherIcon" />
<div>{{ f.daytimeState }}</div>
</div>
</div>
<!-- 10天最高温与最低温折线图 -->
<div class="temperature-echart">
<echartsIndex id="temperatureRange" :option="temperatureRangeOption" />
</div>
<!-- 风力情况 -->
<div class="wind-conditions">
<div v-for="w in forecastData" :key="w.date" class="cell">
<img class="icon" :src="w.nightState | weatherIcon" />
<div class="direction">{{ w.direction }}</div>
<div class="level">{{ w.level }}级</div>
<div :class="w.quality | qualityClass">{{ w.quality }}</div>
</div>
</div>
</div>
</div>
</template>
<script>
export default {
name: "Weather",
data() {
return {
// 区县
districtOptions: [
{
value: "历下区",
label: "历下区",
},
{
value: "历城区",
label: "历城区",
},
{
value: "长清区",
label: "长清区",
},
{
value: "莱芜区",
label: "莱芜区",
},
],
selectDistrict: "历下区",
// 当天时间点数据
hourly: [
{ time: "17:00", status: "晴", quality: "良" },
{ time: "18:00", status: "晴", quality: "良" },
{ time: "19:00", status: "多云", quality: "良" },
{ time: "20:00", status: "多云", quality: "良" },
{ time: "21:00", status: "阴", quality: "良" },
{ time: "22:00", status: "阴", quality: "良" },
{ time: "23:00", status: "阴", quality: "良" },
{ time: "24:00", status: "阴", quality: "良" },
{ time: "01:00", status: "阴", quality: "良" },
],
// 未来10天天气数据
forecastData: [
{
day: "昨天",
date: "11/03",
daytimeState: "晴",
nightState: "夜多云",
direction: "南风",
level: "1",
quality: "良",
},
{
day: "今天",
date: "11/04",
daytimeState: "晴",
nightState: "夜多云",
direction: "南风",
level: "1",
quality: "良",
},
{
day: "明天",
date: "11/05",
daytimeState: "多云",
nightState: "夜多云",
direction: "南风",
level: "1",
quality: "良",
},
{
day: "周四",
date: "11/06",
daytimeState: "多云",
nightState: "夜多云",
direction: "南风",
level: "1",
quality: "良",
},
{
day: "周五",
date: "11/07",
daytimeState: "阴",
nightState: "夜多云",
direction: "南风",
level: "1",
quality: "良",
},
{
day: "周六",
date: "11/08",
daytimeState: "阴",
nightState: "夜多云",
direction: "南风",
level: "1",
quality: "良",
},
{
day: "周日",
date: "11/09",
daytimeState: "阴",
nightState: "夜多云",
direction: "南风",
level: "1",
quality: "良",
},
{
day: "周一",
date: "11/10",
daytimeState: "阴",
nightState: "夜多云",
direction: "南风",
level: "1",
quality: "良",
},
{
day: "周二",
date: "11/11",
daytimeState: "阴",
nightState: "夜多云",
direction: "南风",
level: "1",
quality: "良",
},
{
day: "周三",
date: "11/12",
daytimeState: "阴",
nightState: "夜多云",
direction: "南风",
level: "1",
quality: "良",
},
],
hourTemperatureOption: {
xAxis: {
type: "category",
boundaryGap: false,
splitLine: { show: false },
axisLine: { show: false },
axisTick: { show: false },
axisLabel: { show: false },
data: [],
},
yAxis: {
splitLine: { show: false },
axisLine: { show: false },
axisTick: { show: false },
axisLabel: { show: false },
min: 13,
max: 22,
},
series: [
{
name: "温度折线",
type: "line",
smooth: false, // 平滑曲线
symbol: "circle", // 圆点标记
symbolSize: 6, // 标记大小
data: [],
lineStyle: {
color: "#fff", // 白色折线
width: 1,
},
itemStyle: {
color: "#fff", // 白色标记点
},
areaStyle: {
// 新增:折线下方填充半透明蓝色,模拟图中区域
color: {
type: "linear",
x: 0,
y: 0,
x2: 0,
y2: 1,
colorStops: [
{
offset: 0,
color: "rgba(41, 87, 129, .3)", // 上半部分透明
},
{
offset: 1,
color: "rgba(201, 198, 198, 0.1)", // 下半部分更透明
},
],
},
},
label: {
show: true,
position: "top",
color: "#fff", // 白色文字
formatter: "{c}°", // 温度格式
},
},
],
// 新增:隐藏图例、工具箱等无关元素
legend: { show: false },
toolbox: { show: false },
grid: {
left: "-20px",
right: "-20px",
top: 0,
bottom: 0,
containLabel: false,
},
},
temperatureRangeOption: {
grid: {
left: 0,
right: 0,
top: 0,
bottom: 0,
containLabel: false,
},
xAxis: {
type: "category",
boundaryGap: true,
splitLine: {
show: false,
},
// 去除坐标轴线
axisLine: {
show: false,
},
// 去除坐标轴刻度
axisTick: {
show: false,
},
// 隐藏坐标轴数值
axisLabel: {
show: false,
},
},
yAxis: {
splitLine: {
show: false,
},
// 去除坐标轴线
axisLine: {
show: false,
},
// 去除坐标轴刻度
axisTick: {
show: false,
},
// 隐藏坐标轴数值
axisLabel: {
show: false,
},
},
labelLine: {
show: false,
},
series: [
{
name: "实线",
type: "line",
smooth: false,
symbol: "circle", // 圆点标记
symbolSize: 6, // 标记大小
data: [],
lineStyle: {
color: "#dbd9d9",
width: 1,
},
itemStyle: {
color: "#dbd9d9", // 白色标记点
},
label: {
show: true,
position: "top",
formatter: "{c} °C",
},
},
{
name: "虚线",
type: "line",
smooth: false,
symbol: "circle", // 圆点标记
symbolSize: 6, // 标记大小
data: [],
lineStyle: {
color: "#dbd9d9",
width: 1,
// type: "dashed",
},
itemStyle: {
color: "#dbd9d9", // 白色标记点
},
label: {
show: true,
position: "bottom",
formatter: "{c} °C",
},
},
],
},
};
},
filters: {
weatherIcon(name) {
// 防止关键字里带"雷阵雨"等罕见词,没有文件就回落到"晴"
try {
return require(`@/assets/weatherIcons/${name}.svg`);
} catch {
return require(`@/assets/weatherIcons/晴.svg`);
}
},
qualityClass(val) {
if (val === "轻度") return ["quality", "mild"];
return ["quality"]; // 良或其它
},
},
mounted() {
// 模拟数据
// 当天天气数据
const currentData = [
{
time: "现在",
temperature: 19,
},
{
time: "17:00",
temperature: 16,
},
{
time: "18:00",
temperature: 16,
},
{
time: "19:00",
temperature: 17,
},
{
time: "20:00",
temperature: 19,
},
{
temperature: 19,
time: "21:00",
},
{
time: "22:00",
temperature: 15,
},
{
time: "23:00",
temperature: 15,
},
{
time: "11/05",
temperature: 13,
},
];
let times = [];
let temperatures = [];
currentData.forEach((item) => {
times.push(item.time);
temperatures.push(item.temperature);
});
// 头尾各重复一次数据,简单外插实现折线图两边留白的效果
temperatures = [
temperatures[0],
...temperatures,
temperatures[temperatures.length - 1],
];
const hourTemperatureOptionMax = Math.max(...temperatures);
const hourTemperatureOptionMin = Math.min(...temperatures);
this.hourTemperatureOption.yAxis.min = hourTemperatureOptionMin - 1; // 最小温度值 - 1
this.hourTemperatureOption.yAxis.max = hourTemperatureOptionMax + 3; // 最大温度值 + 3
this.hourTemperatureOption.xAxis.data = ["", ...times, ""]; // 补充x轴两边的数据
// 两边的拐点不做展示
this.hourTemperatureOption.series[0].data = temperatures.map(
(val, idx) => ({
value: val,
symbol:
idx === 0 || idx === temperatures.length - 1 ? "none" : "circle",
})
);
// 未来10天天气数据
const data1 = [10, 11, 12, 10, 11, 13, 11, 12, 12, 10];
const data2 = [8, 6, 7, 6, 8, 6, 5, 8, 7, 8];
this.temperatureRangeOption.series[0].data = data1;
this.temperatureRangeOption.series[1].data = data2;
const all = [...data1, ...data2];
this.temperatureRangeOption.yAxis.min = Math.min(...all) - 6; // 最小温度值 - 6
this.temperatureRangeOption.yAxis.max = Math.max(...all) + 8; // 最大温度值 + 8
},
};
</script>
<style lang="scss" scoped>
.weather-container {
width: 500px;
font-size: 14px;
.weather-top {
padding: 1px 0 20px;
background: linear-gradient(to bottom, #3f7cb5, #5b9dd5);
border-radius: 20px 20px 0 0;
box-sizing: border-box;
color: #fff;
.padding-l-r-10 {
padding: 0 10px;
}
.city-select {
display: flex;
justify-content: space-between;
align-items: center;
.select-district {
width: 66px;
background-color: #417fb8;
::v-deep .el-input--mini .el-input__inner {
background: #3f7cb5;
color: #fff;
border: none;
padding-left: 0;
}
}
}
.current {
display: flex;
justify-content: flex-start;
align-items: center;
.temperature {
font-size: 60px;
margin-right: 10px;
}
.current-situation {
display: flex;
flex-direction: column;
justify-content: flex-start;
font-size: 14px;
}
}
.hourly {
display: flex;
overflow-x: auto;
}
}
.weather-bottom {
background: #fff;
margin-top: -10px;
border-radius: 14px;
padding: 10px;
color: #666;
font-size: 12px;
.forecast-title {
display: flex;
justify-content: space-between;
align-items: center;
}
.weather-forecast,
.wind-conditions {
display: flex;
overflow-x: auto;
padding: 8px 0;
}
}
.temperature-echart {
width: 100%;
height: 80px;
}
.cell {
width: 12%;
display: flex;
flex-direction: column;
align-items: center;
}
.quality {
border-radius: 4px;
line-height: 14px;
text-align: center;
padding: 1px 2px;
background-color: #eda915;
color: #fff;
font-size: 12px;
&.mild {
background-color: orange;
}
}
.font-weight {
font-weight: bold;
}
.icon {
width: 30px;
height: auto;
}
}
</style>