最近在开发个人的大屏项目,作为简历的一部分找工作的时候拿出来撑撑门面。
对于前端而言,最难的并不是技术部分,而是 UI 部分,毕竟前端大部分时候只是切图仔 ,而不是设计师。
但是我现在找到了一个新的方案,用 AI 工具。比如我现在用的 Trae,大面上的框架还是建议个人写,毕竟AI虽然智能,但个人才是代码的最终把控者。
Echarts官网上找了找关于柱状图的内容,无法达到以下的效果,在网上搜了搜,发现也没有类似的效果。
于是用 Trae 简单写了一个指令:
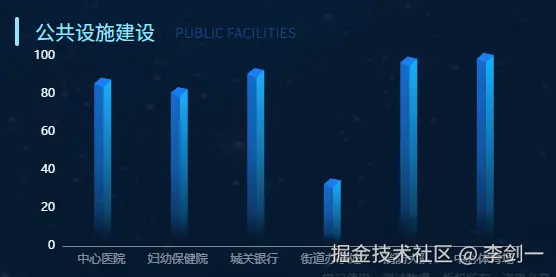
请帮我生成一个Echarts柱状图组件,内容是一个柱状图,但是柱子显现出一种3D效果。分别由三部分构成,柱子的顶端是一个四边形,左右两侧各是一个渐变的四边形,三个图形组成一个侧视图的3D柱子效果。
Trae表示这种效果在柱状图中不存在,推荐使用Echarts的custom自行开发,并给出了相应的开发逻辑。
js
// 先生成柱子效果
// 绘制左侧面
const barLeft = echarts.graphic.extendShape({
    shape: {
        x: 0,
        y: 0,
    },
    buildPath: function (ctx, shape) {
        const xAxisPoint = shape.xAxisPoint;
        const c0 = [shape.x + 2, shape.y];
        const c1 = [shape.x - 7, shape.y - 1];
        const c2 = [xAxisPoint[0] - 7, xAxisPoint[1] - 3];
        const c3 = [xAxisPoint[0] + 2, xAxisPoint[1]];
        ctx
            .moveTo(c0[0], c0[1])
            .lineTo(c1[0], c1[1])
            .lineTo(c2[0], c2[1])
            .lineTo(c3[0], c3[1])
            .closePath();
    },
});
// 绘制右侧面
const barRight = echarts.graphic.extendShape({
    shape: {
        x: 0,
        y: 0,
    },
    buildPath: function (ctx, shape) {
        const xAxisPoint = shape.xAxisPoint;
        const c1 = [shape.x + 2, shape.y];
        const c2 = [xAxisPoint[0] + 2, xAxisPoint[1]];
        const c3 = [xAxisPoint[0] + 10, xAxisPoint[1] - 5];
        const c4 = [shape.x + 10, shape.y - 5];
        ctx
            .moveTo(c1[0], c1[1])
            .lineTo(c2[0], c2[1])
            .lineTo(c3[0], c3[1])
            .lineTo(c4[0], c4[1])
            .closePath();
    },
});
// 绘制顶面
const barTop = echarts.graphic.extendShape({
    shape: {
        x: 0,
        y: 0,
    },
    buildPath: function (ctx, shape) {
        const c1 = [shape.x + 2, shape.y + 3];
        const c2 = [shape.x + 10, shape.y - 5]; //右点
        const c3 = [shape.x - 0, shape.y - 7];
        const c4 = [shape.x - 7, shape.y - 1];
        ctx
            .moveTo(c1[0], c1[1])
            .lineTo(c2[0], c2[1])
            .lineTo(c3[0], c3[1])
            .lineTo(c4[0], c4[1])
            .closePath();
    },
});
将渲染完成的面注册到Echarts中:
js
// 注册三个面图形
echarts.graphic.registerShape("barLeft", barLeft);
echarts.graphic.registerShape("barRight", barRight);
echarts.graphic.registerShape("barTop", barTop);
应用已经注册好的面,生成Echarts柱状图:
js
series: [
    {
        type: "custom",
        renderItem: (params, api) => {
            let barLeftStyle = new echarts.graphic.LinearGradient(0, 0, 0, 1, [
                {offset: 0, color: "rgba(27, 126, 242, 0.8)"},
                {offset: 0.5, color: "rgba(27, 126, 242, 0.6)"},
                {offset: 0.8, color: "rgba(27, 126, 242, 0.3)"},
                {offset: 1, color: "rgba(0,0,0,0.2)"},
            ]);
            let barRightStyle = new echarts.graphic.LinearGradient(0, 0, 0, 1, [
                {offset: 0, color: "rgba(23,176,255,1)"},
                {offset: 0.5, color: "rgba(23,176,255, 0.6)"},
                {offset: 0.8, color: "rgba(23,176,255, 0.3)"},
                {offset: 1, color: "rgba(0,0,0,0.2)"},
            ]);
            let barTopStyle = new echarts.graphic.LinearGradient(0, 0, 0, 1, [
                {offset: 0, color: "rgba(27, 126, 242, 1)"},
                {offset: 1, color: "rgba(27, 126, 242, 1)"},
            ]);
    },
],
完整代码
js
const createCharts = (data) => {
    const myChart = echarts.init(document.getElementById('firstCharts'));
    // 绘制左侧面
    const barLeft = echarts.graphic.extendShape({
        shape: {
            x: 0,
            y: 0,
        },
        buildPath: function (ctx, shape) {
            const xAxisPoint = shape.xAxisPoint;
            const c0 = [shape.x + 2, shape.y];
            const c1 = [shape.x - 7, shape.y - 1];
            const c2 = [xAxisPoint[0] - 7, xAxisPoint[1] - 3];
            const c3 = [xAxisPoint[0] + 2, xAxisPoint[1]];
            ctx
                .moveTo(c0[0], c0[1])
                .lineTo(c1[0], c1[1])
                .lineTo(c2[0], c2[1])
                .lineTo(c3[0], c3[1])
                .closePath();
        },
    });
    // 绘制右侧面
    const barRight = echarts.graphic.extendShape({
        shape: {
            x: 0,
            y: 0,
        },
        buildPath: function (ctx, shape) {
            const xAxisPoint = shape.xAxisPoint;
            const c1 = [shape.x + 2, shape.y];
            const c2 = [xAxisPoint[0] + 2, xAxisPoint[1]];
            const c3 = [xAxisPoint[0] + 10, xAxisPoint[1] - 5];
            const c4 = [shape.x + 10, shape.y - 5];
            ctx
                .moveTo(c1[0], c1[1])
                .lineTo(c2[0], c2[1])
                .lineTo(c3[0], c3[1])
                .lineTo(c4[0], c4[1])
                .closePath();
        },
    });
    // 绘制顶面
    const barTop = echarts.graphic.extendShape({
        shape: {
            x: 0,
            y: 0,
        },
        buildPath: function (ctx, shape) {
            const c1 = [shape.x + 2, shape.y + 3];
            const c2 = [shape.x + 10, shape.y - 5]; //右点
            const c3 = [shape.x - 0, shape.y - 7];
            const c4 = [shape.x - 7, shape.y - 1];
            ctx
                .moveTo(c1[0], c1[1])
                .lineTo(c2[0], c2[1])
                .lineTo(c3[0], c3[1])
                .lineTo(c4[0], c4[1])
                .closePath();
        },
    });
    // 注册三个面图形
    echarts.graphic.registerShape("barLeft", barLeft);
    echarts.graphic.registerShape("barRight", barRight);
    echarts.graphic.registerShape("barTop", barTop);
    let option = {
        tooltip: {
            trigger: "axis",
            formatter: '<b>{b}</b> <br/> 建设完成度: <b style="color: #2AB6FF">{c}%</b>'
        },
        grid: {
            left: 20,
            top: 10,
            bottom: 0,
            right: 20,
            containLabel: true,
        },
        xAxis: {
            type: "category",
            data: data.name,
            axisLine: {
                show: true,
                lineStyle: {
                    color: "rgba(255,255,255,0.5)",
                },
            },
            axisLabel: {
                interval: 0,
                textStyle: {
                    color: "rgba(255,255,255,0.5)",
                },
            },
            axisTick: {
                show: false,
            }
        },
        yAxis: {
            type: "value",
            axisLine: {
                show: false,
                lineStyle: {
                    color: "#7ebaf2",
                },
            },
            splitLine: {
                show: false,
            },
            axisTick: {
                show: false,
            },
            splitNumber: 4,
            axisLabel: {
                fontSize: 12,
                textStyle: {
                    color: "#FFF",
                },
            },
        },
        series: [
            {
                type: "custom",
                renderItem: (params, api) => {
                    let barLeftStyle = new echarts.graphic.LinearGradient(0, 0, 0, 1, [
                        {offset: 0, color: "rgba(27, 126, 242, 0.8)"},
                        {offset: 0.5, color: "rgba(27, 126, 242, 0.6)"},
                        {offset: 0.8, color: "rgba(27, 126, 242, 0.3)"},
                        {offset: 1, color: "rgba(0,0,0,0.2)"},
                    ]);
                    let barRightStyle = new echarts.graphic.LinearGradient(0, 0, 0, 1, [
                        {offset: 0, color: "rgba(23,176,255,1)"},
                        {offset: 0.5, color: "rgba(23,176,255, 0.6)"},
                        {offset: 0.8, color: "rgba(23,176,255, 0.3)"},
                        {offset: 1, color: "rgba(0,0,0,0.2)"},
                    ]);
                    let barTopStyle = new echarts.graphic.LinearGradient(0, 0, 0, 1, [
                        {offset: 0, color: "rgba(27, 126, 242, 1)"},
                        {offset: 1, color: "rgba(27, 126, 242, 1)"},
                    ]);
                    const location = api.coord([api.value(0), api.value(1)]);
                    return {
                        type: "group",
                        children: [
                            {
                                type: "barLeft",
                                shape: {
                                    api,
                                    xValue: api.value(0),
                                    yValue: api.value(1),
                                    x: location[0],
                                    y: location[1],
                                    xAxisPoint: api.coord([api.value(0), 0]),
                                },
                                style: {
                                    fill: barLeftStyle,
                                },
                            },
                            {
                                type: "barRight",
                                shape: {
                                    api,
                                    xValue: api.value(0),
                                    yValue: api.value(1),
                                    x: location[0],
                                    y: location[1],
                                    xAxisPoint: api.coord([api.value(0), 0]),
                                },
                                style: {
                                    fill: barRightStyle,
                                },
                            },
                            {
                                type: "barTop",
                                shape: {
                                    api,
                                    xValue: api.value(0),
                                    yValue: api.value(1),
                                    x: location[0],
                                    y: location[1],
                                    xAxisPoint: api.coord([api.value(0), 0]),
                                },
                                style: {
                                    fill: barTopStyle,
                                },
                            },
                        ],
                    };
                },
                data: data.value,
            },
        ],
        animation: true,
        animationDuration: 1000
    };
    myChart.setOption(option);
};
Ps: 其他不明之处可以参考 Echarts官方文档 custom 篇