GeoJSON 介绍:Web 地图数据的通用语言
引言
GeoJSON 是一套基于 JSON 格式的地理空间数据编码标准,具有轻量、易读、易于在 Web 应用中解析和传输等优势,它是 Web 地图库(如 Leaflet, Mapbox, OpenLayers)事实上的标准数据格式,我最近在看 OpenLayers,在加载外部数据的时候都是用 GeoJSON,于是便了解了一下,这里是最新规范的英文文档、英语好的可以直接跳转这里
GeoJSON 基本构成
GeoJSON 本质上就是一个标准的 JSON 对象,所有 GeoJSON 对象必须有一个 "type" 成员,"type"表示当前 JSON 描述的类型,这里分为基本几何类型和特征类型。
基本几何类型快速理解就是描述地图上形状的类型,"type" 取值包括 点 (Point)、线(LineString)、区域(Polygon)以及他们的多重类型 MultiPoint, MultiLineString, MultiPolygon,其"coordinates" 属性用来标注地理坐标位置(经纬度基于 WGS84 坐标系)
特征类型即带有属性(properties)的类型,"type" 取值包括 Feature 和 FeatureCollection
基本几何类型
Point(点)
表示地图上的一个点,结构如下
json
{
  "type": "Point",
  "coordinates": [106.56, 29.57]
}
LineString (线)
表示地图上的一条线,可以理解为有多个点连接组成,"coordinates" 为一个二维数组
json
{
  "type": "LineString",
  "coordinates": [
    [106.51398305678325, 29.523171668355733],
    [106.51453664249686, 29.523092142346467],
    [106.51566579820047, 29.522995404990354]
  ]
}
Polygon (多边形)
表示地图上的一个多边形,"coordinates" 由多个环组成、环即由多个点组成的闭合的路径、最后一个点表示闭合点,注意这里可能包含多个环形元素,第一个环表示外部环、其余表示内部环,比如空心圆就由一个内部环和一个外部环组成、外部环通常由逆时针顺序定义,内部的洞应以顺时针方向定义。
一个包含环的多边形示例如下
json
{
  "type": "Polygon",
  "coordinates": [
    [
      [106.50, 29.60],
      [106.50, 29.50],
      [106.60, 29.50],
      [106.60, 29.60],
      [106.50, 29.60]
    ],
    [
      [106.53, 29.57],
      [106.57, 29.57],
      [106.57, 29.53],
      [106.53, 29.53],
      [106.53, 29.57]
    ]
  ]
}
把第二段JSON删掉就是没有环的矩形
json
{
  "type": "Polygon",
  "coordinates": [
    [
      [106.50, 29.60],
      [106.50, 29.50],
      [106.60, 29.50],
      [106.60, 29.60],
      [106.50, 29.60]
    ]
  ]
}
MultiPoint(多点)
表示一组不相连的点、Point的复数形式、多个点组成的二维数组
json
{
  "type": "MultiPoint",
  "coordinates": [
    [106.50, 29.60],
    [106.50, 29.50],
    [106.60, 29.50],
    [106.60, 29.60]
  ]
}
MultiLineString (多线串)
表示一组不相连的线串,LineString的复数形式,多条线组成的三层数组
json
{
  "type": "MultiLineString",
  "coordinates": [
    [
      [106.51398305678325, 29.523171668355733],
      [106.51453664249686, 29.523092142346467],
      [106.51566579820047, 29.522995404990354]
    ],
    [
      [106.51398305678325, 29.533171668355733],
      [106.51453664249686, 29.533092142346467],
      [106.51566579820047, 29.532995404990354]
    ]
  ]
}
MultiPolygon (多多边形):
表示一组不相连的多边形、坐标是四层数组,每组坐标代表一个独立的 Polygon(每个 Polygon 内部仍可包含洞)。
json
{
  "type": "MultiPolygon",
  "coordinates": [
    [
      [
        [106.50, 29.55],
        [106.50, 29.50],
        [106.55, 29.50],
        [106.55, 29.55],
        [106.50, 29.55]
      ]
    ],
    [
      [
        [106.65, 29.65],
        [106.65, 29.60],
        [106.70, 29.60],
        [106.70, 29.65],
        [106.65, 29.65]
      ]
    ]
  ]
}
GeometryCollection (几何集合)
用于将不同类型(Point, LineString, Polygon, Multi*)的几何图形封装到一个对象中, 包含一个 "geometries" 成员,其值是一个数组,数组中的每个元素都是一个完整的 GeoJSON 几何对象
一个包含 Point, LineString, Polygon 的 对象
json
{
  "type": "GeometryCollection",
  "geometries": [
    {
      "type": "Point",
      "coordinates": [106.52, 29.53]
    },
    {
      "type": "LineString",
      "coordinates": [
        [106.50, 29.50],
        [106.53, 29.50],
        [106.53, 29.55]
      ]
    },
    {
      "type": "Polygon",
      "coordinates": [
        [
          [106.55, 29.55],
          [106.55, 29.50],
          [106.60, 29.50],
          [106.60, 29.55],
          [106.55, 29.55]
        ]
      ]
    }
  ]
}
特征类型
这个可以说是GeoJSON 的灵魂,它将几何形状与属性数据关联起来,使得图形有了意义,包括两个类型:"Feature" 和 "FeatureCollection"
Feature
基本结构如下:
- "type": "Feature"
- "geometry":包含一个几何对象(Point, Polygon, etc.)。
- "properties":包含任何非地理属性数据(例如:名称、人口、年份、颜色等)。
下面为一个LineString、属性描述其为一条高速公路
json
{
  "type": "Feature",
  "geometry": {
    "type": "LineString",
    "coordinates": [
      [106.50, 29.50],
      [106.55, 29.52],
      [106.60, 29.54],
      [106.65, 29.56]
    ]
  },
  "properties": {
    "id": "G5001",
    "name": "重庆绕城高速(部分)",
    "speed": 100,
    "length": 15.5
  }
}
FeatureCollection
FeatureCollection 表示Feature的集合,几乎网上下载的GeoJSON文件都是 FeatureCollection 结构的 基本结构:
- "type": "FeatureCollection"
- "features":一个包含零个或多个 Feature 对象的数组。
一个表示线路和服务区的 GeoJSON
json
{
  "type": "FeatureCollection",
  "features": [
    {
      "type": "Feature",
      "geometry": {
        "type": "LineString",
        "coordinates": [
          [106.40, 29.50],
          [106.45, 29.52],
          [106.50, 29.54],
          [106.55, 29.56],
          [106.60, 29.58]
        ]
      },
      "properties": {
        "id": "H-1234",
        "name": "城市快速通道A段",
      }
    },
    {
      "type": "Feature",
      "geometry": {
        "type": "Point",
        "coordinates": [106.45, 29.52]
      },
      "properties": {
        "id": "SA-001",
        "name": "龙溪服务区",
      }
    }
  ]
}
OpenLayers 中使用
在OpenLayers中写了两个Demo巩固、一个用于绘制线路后导出GeoJSON文件,另一个加载导出的文件根据渲染线路和服务区
绘制线路以及站点
涉及主要功能点:
- 绘制线路,并为香炉加上线路表示以及名字
- 绘制站点,并为站点加上站点标识以及名字
javascript
import { useEffect, useRef, useState } from 'react'
import * as layer from 'ol/layer'
import * as source from 'ol/source'
import { Map } from 'ol'
import View from 'ol/View.js'
import OSM from 'ol/source/OSM'
import Style from 'ol/style/Style'
import Stroke from 'ol/style/Stroke'
import Fill from 'ol/style/Fill'
import * as format from 'ol/format'
import CircleStyle from 'ol/style/Circle'

import * as interaction from 'ol/interaction'
import type { DrawEvent } from 'ol/interaction/Draw'
const projection = 'EPSG:4326'

let i = 0

const createDrawStyle = () => {
  return new Style({
    image: new CircleStyle({
      radius: 4,
      fill: new Fill({
        color: '#000000'
      })
    }),
    stroke: new Stroke({
      width: 2,
      color: 'red'
    })
  })
}
const DrawLine = () => {
  const mapRef = useRef<Map>(null)
  const drawRef = useRef<interaction.Draw>(null)
  const drawSource = useRef<source.Vector>(null)
  const [drawType, setDrawType] = useState<string>('Point')

  useEffect(() => {
    const vectorSource = new source.Vector()
    drawSource.current = vectorSource
    const vectorLayer = new layer.Vector({
      source: vectorSource,
      style: createDrawStyle()
    })

    const osmLayer = new layer.Tile({
      source: new OSM()
    })

    const view = new View({
      zoom: 10,
      projection,
      center: [106.56, 29.57]
    })

    const map = new Map({
      target: 'draw',
      layers: [osmLayer, vectorLayer],
      view,
      controls: []
    })
    const draw = new interaction.Draw({
      type: 'Point',
      source: vectorSource
    })
    map.addInteraction(draw)
    mapRef.current = map
    drawRef.current = draw
  }, [])

  const handleClick = (event: React.ChangeEvent<HTMLInputElement>) => {
    setDrawType(event.target.value)
  }

  useEffect(() => {
    const map = mapRef.current!
    const source = drawSource.current!
    source.getFeatures().forEach(item => {
      if(item.getGeometry()?.getType() === drawType) {
        source.removeFeature(item)
      }
    })
    map.removeInteraction(drawRef.current!)
    const handleDrawEnd = (event: DrawEvent) => {
      const feature = event.feature
      feature.setProperties({
        type: drawType === 'Point' ? 'station' : 'line',
        name: drawType === 'Point' ? '站点' + i : '高速'
      })
      i++
    }
    const draw = new interaction.Draw({
      type: drawType,
      source: source,
      style: createDrawStyle()
    })
    draw.on('drawend', handleDrawEnd)
    drawRef.current = draw
    map.addInteraction(draw)
    return () => {
      draw.un('drawend', handleDrawEnd)
    }
  }, [drawType])

  const handleExport = () => {
    const source = drawSource.current!
    const features = source.getFeatures()
    const featureProjection = mapRef
      .current!.getView()
      .getProjection()
      .getCode()
    const jsonFormat = new format.GeoJSON({
      featureProjection,
      dataProjection: projection
    })

    const json = jsonFormat.writeFeatures(features, {
      featureProjection,
      dataProjection: projection
    })
    // 导出
    console.log(json, '>>>>')
  }

  return (
    <>
      <div
        style={{
          width: '800px',
          height: '400px',
          position: 'relative',
          display: 'flex'
        }}
      >
        <div id="draw" style={{ width: '800px', height: '400px' }}></div>
      </div>
      <input
        type="radio"
        checked={drawType === 'Point'}
        value={'Point'}
        onChange={handleClick}
      />{' '}
      添加站点
      <input
        type="radio"
        checked={drawType === 'LineString'}
        value={'LineString'}
        onChange={handleClick}
      />{' '}
      添加线路
      <button onClick={handleExport}>导出</button>
    </>
  )
}

export default DrawLine
当绘制好后可以点击导出、然后可以看到控制台有我们的JSON数据,这里我示例了一下,本来想找条真实的路,结果定位重庆就找不到一条直的路,算了。还有这里我们也可以手动便利features自己写json,能进一步巩固了解!
这是我绘制的供后面使用效果图如下:
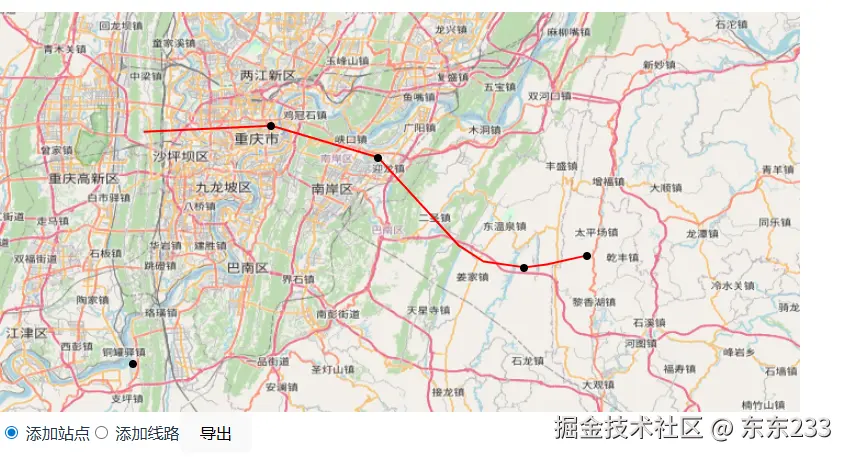
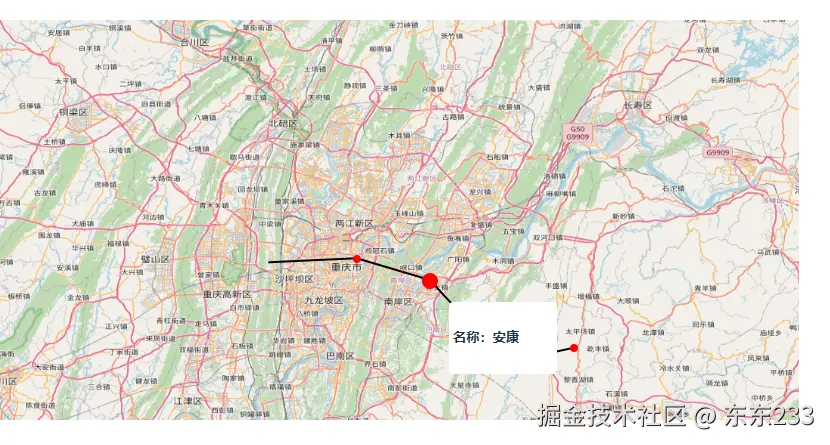
OpenLayers 中使用刚才导入的数据
我们可以导入刚才的数据并加入一些交互,这里我对数据做了一些加工,这一步可以在编辑完成,但我们的编辑比较粗糙,我就手动对JSON做了编辑,主要功能:
- 支持路线选中、显示路线信息
- 支持站点选中、查看站点信息
javascript
import { useEffect, useRef, useState } from 'react'
import * as layer from 'ol/layer'
import * as source from 'ol/source'
import { Map } from 'ol'
import View from 'ol/View.js'
import OSM from 'ol/source/OSM'
import Style from 'ol/style/Style'
import Stroke from 'ol/style/Stroke'
import Fill from 'ol/style/Fill'
import * as format from 'ol/format'
import CircleStyle from 'ol/style/Circle'

import * as interaction from 'ol/interaction'
import { pointerMove } from 'ol/events/condition'
const projection = 'EPSG:4326'


const createDrawStyle = () => {
  return new Style({
    image: new CircleStyle({
      radius: 4,
      fill: new Fill({
        color: 'red'
      })
    }),
    stroke: new Stroke({
      width: 2,
      color: '#000'
    })
  })
}
const DrawLine = () => {
  const mapRef = useRef<Map>(null)
  const wrapperRef = useRef<HTMLDivElement>(null)
  const drawSource = useRef<source.Vector>(null)
  const [active, setActive] = useState<any>(null)

  useEffect(() => {
    const vectorSource = new source.Vector({
      url: '/geo/cq.json',
      format: new format.GeoJSON()
    })
    drawSource.current = vectorSource
    const vectorLayer = new layer.Vector({
      source: vectorSource,
      style: createDrawStyle()
    })

    const osmLayer = new layer.Tile({
      source: new OSM()
    })

    const view = new View({
      zoom: 10,
      projection,
      center: [106.56, 29.57]
    })

    const map = new Map({
      target: 'draw',
      layers: [osmLayer, vectorLayer],
      view,
      controls: []
    })
    const select = new interaction.Select({
      condition: pointerMove,
      style: new Style({
        image: new CircleStyle({
          radius: 8,
          fill: new Fill({
            color: 'red'
          })
        }),
        stroke: new Stroke({
          width: 4,
          color: '#000'
        })
      })
    })
    map.addInteraction(select)
    map.on('pointermove', event => {
      const pixel = event.pixel;
      const features = map.getFeaturesAtPixel(pixel);
      if(features.length) {
        const feature = features.find(item => item.getGeometry()?.getType() === 'Point') || features[0]
        setActive({
          pixel,
          properties: feature.getProperties()
        })
      } else {
        setActive(null)
      }
    })
    mapRef.current = map
  }, [])

  return (
    <>
      <div
        style={{
          width: '800px',
          height: '400px',
          position: 'relative',
          display: 'flex'
        }}
      >
        <div id="draw" ref={wrapperRef} style={{ width: '800px', height: '400px', cursor: active ? 'pointer' : 'auto'  }}></div>
        {active && <div style={{
          width: '100px',
          background: '#fff',
          padding: '4px',
          borderRadius: '4px',
          position: 'absolute',
          left: active.pixel[0] + 20 + 'px',
          top: active.pixel[1] + 20 + 'px'
        }}>
          <h5>名称:{active.properties.name}</h5>
        </div>}
      </div>
    </>
  )
}

export default DrawLine
效果图如下
这是我使用的JSON
json
{
  "type": "FeatureCollection",
  "features": [
    {
      "type": "Feature",
      "geometry": {
        "type": "LineString",
        "coordinates": [
          [
            106.40801847988175,
            29.57298086250036
          ],
          [
            106.56685851097549,
            29.580326066250358
          ],
          [
            106.69999032894425,
            29.54084559609411
          ],
          [
            106.80098688050674,
            29.43066753984411
          ],
          [
            106.83220399644425,
            29.410468229531606
          ],
          [
            106.88362042269425,
            29.403123025781607
          ],
          [
            106.91116493675675,
            29.406795627656606
          ],
          [
            106.96074506206925,
            29.417813433281605
          ]
        ]
      },
      "properties": {
        "type": "line",
        "name": "成渝高速"
      }
    },
    {
      "type": "Feature",
      "geometry": {
        "type": "Point",
        "coordinates": [
          106.70012461444661,
          29.539872075705606
        ]
      },
      "properties": {
        "type": "station",
        "name": "安康"
      }
    },
    {
      "type": "Feature",
      "geometry": {
        "type": "Point",
        "coordinates": [
          106.56685698617343,
          29.57991493114919
        ]
      },
      "properties": {
        "type": "station",
        "name": "巴中"
      }
    },
    {
      "type": "Feature",
      "geometry": {
        "type": "Point",
        "coordinates": [
          106.88282014240801,
          29.40285042973459
        ]
      },
      "properties": {
        "type": "station",
        "name": "渝北"
      }
    },
    {
      "type": "Feature",
      "geometry": {
        "type": "Point",
        "coordinates": [
          106.96102884444625,
          29.417240830909627
        ]
      },
      "properties": {
        "type": "station",
        "name": "简阳"
      }
    }
  ]
}
总结
通过本文的深入探索,我们理解了 GeoJSON 作为 Web 地理空间数据通用语言的核心优势:
- 简洁: 基于 JSON 格式,结构清晰,易于人机阅读和编写。
- 灵活: 强大的 Feature 和 FeatureCollection 结构允许我们将复杂的地理几何图形(如 LineString, Polygon, MultiPolygon)与丰富的非地理属性数据 (properties) 完美结合。
- 标准化: 统一的 WGS84 坐标系和严格的规范(如右手法则),确保了 GeoJSON 文件在不同平台和 Web 地图库之间的互操作性。