首先吐槽csdn的商业化方向,搞得好多文章都要付费阅读。没想到还真有人开了这类功能。AI pairing programming 不香吗!
就以上这类关系数据的雏形代码如下,
python
#!/usr/bin/env python3
# -*- coding: utf-8 -*-
"""
公司关系图谱生成器
根据采购商-供应商关系,生成指定公司的关系网络图
"""
import pandas as pd
import networkx as nx
import matplotlib.pyplot as plt
from matplotlib import font_manager
import sys
# 设置中文字体支持
plt.rcParams['font.sans-serif'] = ['Arial Unicode MS', 'SimHei', 'STHeiti', 'DejaVu Sans']
plt.rcParams['axes.unicode_minus'] = False
def load_data(csv_file='companies.csv'):
"""加载CSV数据文件"""
try:
df = pd.read_csv(csv_file, encoding='utf-8')
print(f"成功加载数据,共 {len(df)} 条记录")
return df
except Exception as e:
print(f"数据加载失败: {e}")
sys.exit(1)
def build_graph(df):
"""构建完整的关系图谱"""
G = nx.DiGraph()
for _, row in df.iterrows():
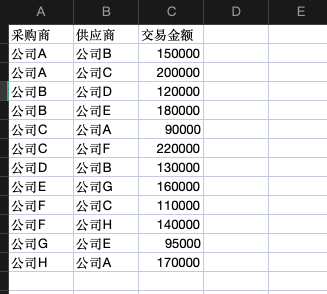
buyer = row['采购商']
supplier = row['供应商']
amount = row.get('交易金额', 0)
G.add_edge(buyer, supplier, weight=amount)
return G
def get_company_subgraph(G, company_name):
"""
获取指定公司的子图
- 作为采购商:连线到供应商(出边)
- 作为供应商:连线到采购商(入边)
"""
if company_name not in G.nodes():
print(f"错误:公司 '{company_name}' 不在数据中")
return None
# 获取相关节点
suppliers = list(G.successors(company_name)) # 该公司的供应商(出边)
buyers = list(G.predecessors(company_name)) # 该公司的采购商(入边)
# 构建子图
nodes = [company_name] + suppliers + buyers
subG = G.subgraph(nodes).copy()
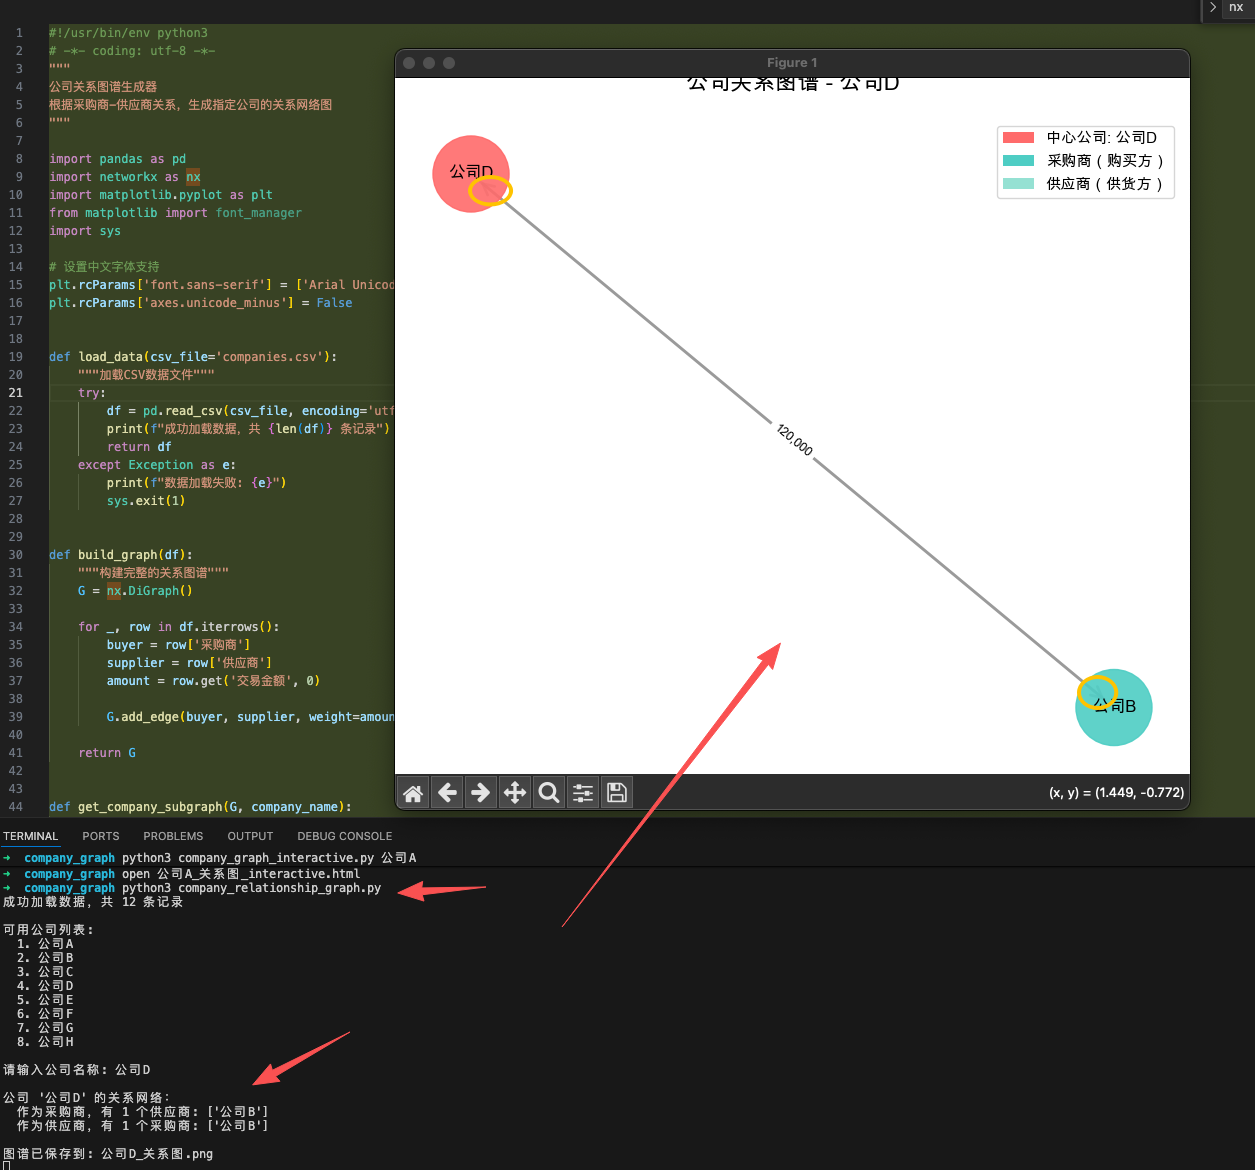
print(f"\n公司 '{company_name}' 的关系网络:")
print(f" 作为采购商,有 {len(suppliers)} 个供应商: {suppliers}")
print(f" 作为供应商,有 {len(buyers)} 个采购商: {buyers}")
return subG, suppliers, buyers
def visualize_graph(subG, company_name, suppliers, buyers, output_file=None):
"""可视化关系图谱"""
fig, ax = plt.subplots(figsize=(14, 10))
# 布局:中心公司在中央,采购商在左边,供应商在右边
pos = {}
pos[company_name] = (0, 0) # 中心公司
# 采购商在左侧(这些公司采购了中心公司的产品)
for i, buyer in enumerate(buyers):
pos[buyer] = (-2, (i - len(buyers)/2) * 1.5)
# 供应商在右侧(中心公司从这些公司采购)
for i, supplier in enumerate(suppliers):
pos[supplier] = (2, (i - len(suppliers)/2) * 1.5)
# 节点颜色
node_colors = []
for node in subG.nodes():
if node == company_name:
node_colors.append('#FF6B6B') # 中心公司:红色
elif node in buyers:
node_colors.append('#4ECDC4') # 采购商:青色
else:
node_colors.append('#95E1D3') # 供应商:绿色
# 绘制节点
nx.draw_networkx_nodes(subG, pos, node_color=node_colors,
node_size=3000, alpha=0.9, ax=ax)
# 绘制边(箭头)
nx.draw_networkx_edges(subG, pos, edge_color='#888888',
arrows=True, arrowsize=20,
arrowstyle='->', width=2, alpha=0.6, ax=ax)
# 绘制标签
nx.draw_networkx_labels(subG, pos, font_size=12,
font_weight='bold', ax=ax)
# 添加边权重标签(交易金额)
edge_labels = nx.get_edge_attributes(subG, 'weight')
edge_labels = {k: f'{v:,.0f}' for k, v in edge_labels.items()}
nx.draw_networkx_edge_labels(subG, pos, edge_labels,
font_size=9, ax=ax)
# 图例
from matplotlib.patches import Patch
legend_elements = [
Patch(facecolor='#FF6B6B', label=f'中心公司: {company_name}'),
Patch(facecolor='#4ECDC4', label='采购商(购买方)'),
Patch(facecolor='#95E1D3', label='供应商(供货方)')
]
ax.legend(handles=legend_elements, loc='upper right', fontsize=11)
ax.set_title(f'公司关系图谱 - {company_name}', fontsize=16, fontweight='bold', pad=20)
ax.axis('off')
plt.tight_layout()
if output_file:
plt.savefig(output_file, dpi=300, bbox_inches='tight')
print(f"\n图谱已保存到: {output_file}")
plt.show()
def main():
"""主函数"""
# 加载数据
df = load_data('companies.csv')
# 构建图谱
G = build_graph(df)
# 获取输入
if len(sys.argv) > 1:
company_name = sys.argv[1]
else:
print("\n可用公司列表:")
companies = sorted(set(df['采购商'].tolist() + df['供应商'].tolist()))
for i, company in enumerate(companies, 1):
print(f" {i}. {company}")
company_name = input("\n请输入公司名称: ").strip()
# 生成子图
result = get_company_subgraph(G, company_name)
if result is None:
return
subG, suppliers, buyers = result
# 可视化
output_file = f"{company_name}_关系图.png"
visualize_graph(subG, company_name, suppliers, buyers, output_file)
if __name__ == '__main__':
main()最后,特别鸣谢copilot,节省我的时间。