🎨 Cesium 标绘测量太复杂?CesiumLite 让你一行代码搞定!
本文深入介绍 CesiumLite 的标绘测量模块,从传统开发痛点到模块化封装原理,再到实战应用,教你如何优雅地实现三维地图的交互式绘制和精确测量。
📌 前言
在三维地图应用开发中,标绘 (Drawing)和测量(Measure)是两个极其常见的需求:
- 标绘功能:用户在地图上绘制点、线、面等几何图形,用于标注位置、规划路线、圈定区域等场景
- 测量功能:计算两点间的距离、区域面积,用于空间分析、工程测算等场景
这两个功能看似简单,但使用 Cesium 原生 API 实现时,却需要处理大量细节:鼠标事件监听、坐标转换、动态绘制、结果计算等。本文将展示 CesiumLite 如何通过模块化封装,让标绘测量变得简单高效。
🎨 在线演示
项目提供了完整的标绘测量演示页面,你可以访问以下链接体验实际效果:
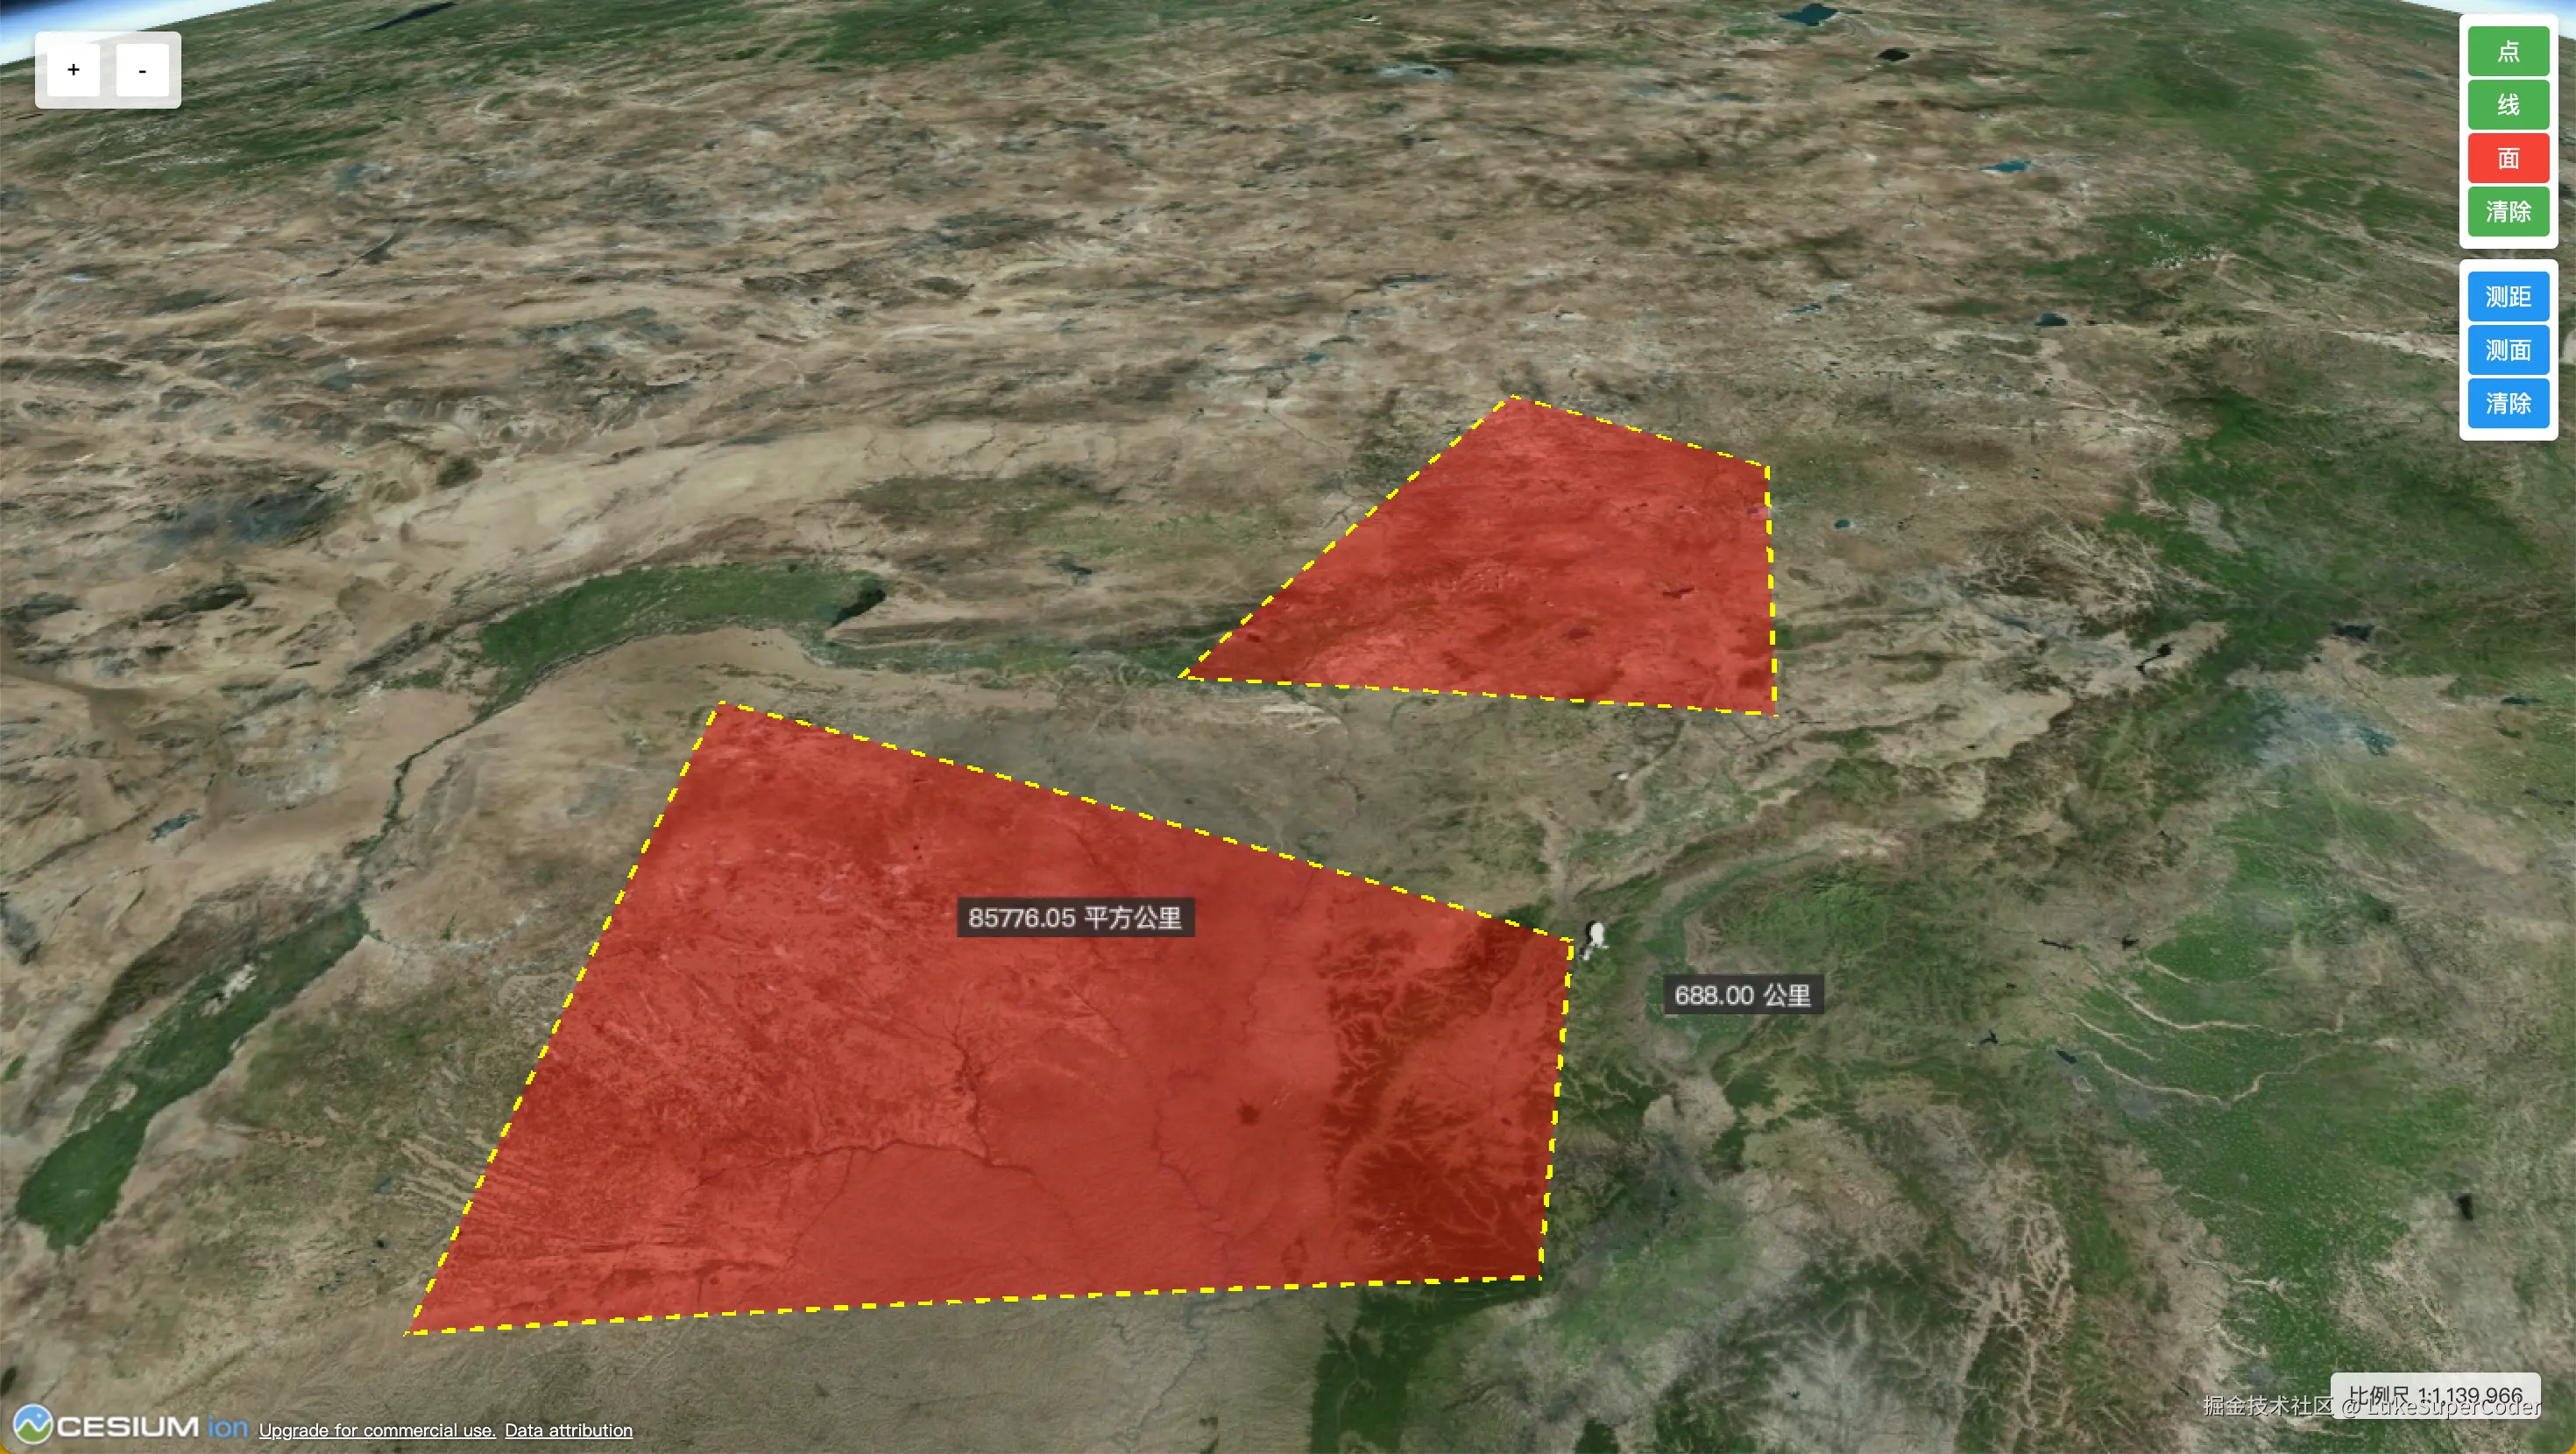
演示页面包含以下功能:
- 🎯 绘制功能:点、线、面
- 📏 测量功能:距离测量、面积测量
- 🎭 交互反馈:实时预览、动态显示
- 🗑️ 清除管理:一键清除所有标绘测量结果
🚫 开发痛点分析
痛点 1:鼠标事件处理复杂
使用 Cesium 原生 API 实现一个简单的绘制线功能,需要处理多种鼠标事件:
javascript
// 传统方式:需要手动管理大量事件和状态
const handler = new Cesium.ScreenSpaceEventHandler(viewer.scene.canvas);
const positions = [];
let activeEntity = null;

// 左键点击添加点
handler.setInputAction((event) => {
  const earthPosition = viewer.scene.pickPosition(event.position);
  if (Cesium.defined(earthPosition)) {
    positions.push(earthPosition);

    // 移除旧实体
    if (activeEntity) {
      viewer.entities.remove(activeEntity);
    }

    // 创建新实体
    activeEntity = viewer.entities.add({
      polyline: {
        positions: new Cesium.CallbackProperty(() => {
          return positions.concat(mousePosition || []);
        }, false),
        width: 3,
        material: Cesium.Color.YELLOW,
        clampToGround: true
      }
    });
  }
}, Cesium.ScreenSpaceEventType.LEFT_CLICK);

// 鼠标移动实时预览
let mousePosition = null;
handler.setInputAction((event) => {
  const earthPosition = viewer.scene.pickPosition(event.endPosition);
  if (Cesium.defined(earthPosition)) {
    mousePosition = earthPosition;
  }
}, Cesium.ScreenSpaceEventType.MOUSE_MOVE);

// 右键完成绘制
handler.setInputAction((event) => {
  handler.destroy();
  // 还需要清理状态、处理回调...
}, Cesium.ScreenSpaceEventType.RIGHT_CLICK);

// 还需要处理双击事件、深度测试、光标样式...
问题在于:
- 需要手动管理多种鼠标事件(点击、移动、右键、双击)
- 状态管理复杂(临时点集合、移动点、当前实体等)
- 需要处理实时预览的动态效果
- 事件清理和资源释放容易遗漏
- 代码重复率高,每种图形都要重写一遍
痛点 2:测量计算繁琐
实现距离和面积测量需要复杂的地理计算:
javascript
// 传统方式:手动实现距离计算
function calculateDistance(positions) {
  let totalDistance = 0;

  for (let i = 0; i < positions.length - 1; i++) {
    const start = positions[i];
    const end = positions[i + 1];

    // 转换为经纬度
    const startCartographic = Cesium.Cartographic.fromCartesian(start);
    const endCartographic = Cesium.Cartographic.fromCartesian(end);

    const startLon = Cesium.Math.toDegrees(startCartographic.longitude);
    const startLat = Cesium.Math.toDegrees(startCartographic.latitude);
    const endLon = Cesium.Math.toDegrees(endCartographic.longitude);
    const endLat = Cesium.Math.toDegrees(endCartographic.latitude);

    // Haversine 公式计算球面距离
    const R = 6371; // 地球半径(公里)
    const dLat = (endLat - startLat) * Math.PI / 180;
    const dLon = (endLon - startLon) * Math.PI / 180;
    const a = Math.sin(dLat/2) * Math.sin(dLat/2) +
             Math.cos(startLat * Math.PI / 180) * Math.cos(endLat * Math.PI / 180) *
             Math.sin(dLon/2) * Math.sin(dLon/2);
    const c = 2 * Math.atan2(Math.sqrt(a), Math.sqrt(1-a));
    totalDistance += R * c;
  }

  return totalDistance;
}

// 面积计算更复杂,需要考虑球面几何...
function calculateArea(positions) {
  // 需要实现球面多边形面积计算
  // 坐标转换、面积公式、单位换算...
  // 代码省略 50+ 行...
}

// 还需要创建标签显示结果
viewer.entities.add({
  position: lastPosition,
  label: {
    text: `${distance.toFixed(2)} 公里`,
    font: '14px sans-serif',
    fillColor: Cesium.Color.WHITE,
    outlineColor: Cesium.Color.BLACK,
    outlineWidth: 2,
    // 还有一堆样式配置...
  }
});
问题在于:
- 地理计算公式复杂(Haversine 公式、球面几何)
- 坐标系转换繁琐(笛卡尔坐标 ↔ 经纬度)
- 需要手动创建和管理测量标签
- 单位换算容易出错
- 结果展示样式需要大量配置
痛点 3:生命周期管理混乱
绘制和测量功能需要严格的生命周期管理:
javascript
// 需要手动管理各种资源
const drawHandlers = [];
const drawEntities = [];
const measureLabels = [];

// 开始新的绘制前需要清理
function clearAllDrawing() {
  // 清理事件监听器
  drawHandlers.forEach(handler => {
    handler.destroy();
  });
  drawHandlers.length = 0;

  // 清理实体
  drawEntities.forEach(entity => {
    viewer.entities.remove(entity);
  });
  drawEntities.length = 0;

  // 清理标签
  measureLabels.forEach(label => {
    viewer.entities.remove(label);
  });
  measureLabels.length = 0;

  // 重置光标样式
  viewer.container.style.cursor = 'default';

  // 还要重置各种状态变量...
}

// 如果忘记清理,会导致内存泄漏和意外行为
问题在于:
- 资源清理逻辑分散,容易遗漏
- 事件监听器未及时销毁导致内存泄漏
- 状态重置不完整导致功能异常
- 光标样式、深度测试等副作用未恢复
- 缺乏统一的管理接口
痛点 4:样式配置重复
每次绘制都要配置相同的样式:
javascript
// 每个项目都要重复配置样式
const lineStyle = {
  width: 3,
  material: new Cesium.PolylineDashMaterialProperty({
    color: Cesium.Color.YELLOW
  }),
  clampToGround: true,
  depthFailMaterial: new Cesium.PolylineDashMaterialProperty({
    color: Cesium.Color.YELLOW
  })
};

const polygonStyle = {
  material: Cesium.Color.RED.withAlpha(0.4),
  outline: true,
  outlineColor: Cesium.Color.RED,
  outlineWidth: 3,
  clampToGround: true,
  // ...
};

// 在不同地方使用时又要重新配置一遍
问题在于:
- 样式配置分散,难以统一管理
- 修改样式需要找到所有使用位置
- 缺乏默认样式和自定义样式机制
- 代码重复率高
💡 CesiumLite 的解决方案
核心设计思路
CesiumLite 的标绘测量模块采用了以下设计思路:
- 双工具分离架构 :
DrawTool(绘制工具)+MeasureTool(测量工具) - 事件生命周期管理:自动注册、清理事件,防止内存泄漏
- 样式配置分层:默认样式 + 自定义样式,支持全局和局部配置
- 回调驱动设计:通过回调函数返回绘制结果,解耦业务逻辑
- 状态封装隔离:内部管理所有状态,外部只需调用简单接口
架构设计图
┌─────────────────────────────────────────────────────┐
│             CesiumLite 核心类                        │
│                                                      │
│  ┌────────────────────┐      ┌──────────────────┐  │
│  │   DrawTool 绘制    │      │ MeasureTool 测量 │  │
│  │                    │      │                  │  │
│  │  - 点/线/面绘制    │◄─────┤  - 距离测量      │  │
│  │  - 鼠标事件管理    │      │  - 面积测量      │  │
│  │  - 实时预览        │      │  - 结果标注      │  │
│  │  - 样式配置        │      │  - 地理计算      │  │
│  │  - 回调通知        │      │                  │  │
│  └────────────────────┘      └──────────────────┘  │
│           ↓                            ↓             │
│  ┌──────────────────────────────────────────────┐  │
│  │          Cesium Viewer 实例                   │  │
│  │  - CustomDataSource(数据源隔离)            │  │
│  │  - ScreenSpaceEventHandler(事件处理)       │  │
│  └──────────────────────────────────────────────┘  │
└─────────────────────────────────────────────────────┘
🔧 核心代码实现
1. DrawTool:标绘工具核心
DrawTool 负责处理所有绘制逻辑,是标绘功能的核心:
javascript
import {
    CustomDataSource,
    ScreenSpaceEventHandler,
    Cartesian3,
    Color,
    CallbackProperty,
    PolylineDashMaterialProperty,
    HeightReference,
    PolygonHierarchy,
    ScreenSpaceEventType
} from "cesium";

class DrawTool {
    constructor(viewer, options = {}) {
        this.viewer = viewer;
        this._drawHandler = null; // 事件处理器
        this._dataSource = null; // 数据源
        this._tempPositions = []; // 临时点集合
        this._mousePos = null; // 鼠标移动点
        this._drawType = null; // 绘制类型
        this._originalCursor = null; // 原始光标样式

        // 默认样式配置
        this.defaultStyles = {
            point: {
                color: Color.RED,
                pixelSize: 10,
                outlineColor: Color.YELLOW,
                outlineWidth: 2
            },
            polyline: {
                color: Color.RED,
                width: 3,
                material: new PolylineDashMaterialProperty({
                    color: Color.YELLOW
                })
            },
            polygon: {
                color: Color.RED,
                width: 3,
                fillColor: Color.RED.withAlpha(0.4),
                material: new PolylineDashMaterialProperty({
                    color: Color.YELLOW
                })
            }
        };

        // 合并用户配置
        this.options = {
            styles: {
                point: { ...this.defaultStyles.point, ...(options.styles?.point || {}) },
                polyline: { ...this.defaultStyles.polyline, ...(options.styles?.polyline || {}) },
                polygon: { ...this.defaultStyles.polygon, ...(options.styles?.polygon || {}) }
            }
        };
    }

    /**
     * 开始绘制
     * @param {string} drawType - 绘制类型:Point/Polyline/Polygon
     * @param {Function} callback - 完成回调
     */
    draw(drawType, callback) {
        this.clearAll(); // 清除之前的绘制
        this._drawType = drawType;
        this._dataSource = new CustomDataSource("_dataSource");
        this.viewer.dataSources.add(this._dataSource);

        // 更改光标为十字准星
        this._originalCursor = this.viewer.container.style.cursor;
        this.viewer.container.style.cursor = 'crosshair';

        this._registerEvents(callback); // 注册事件
    }

    /**
     * 注册鼠标事件
     */
    _registerEvents(callback) {
        this._drawHandler = new ScreenSpaceEventHandler(this.viewer.scene.canvas);
        this.viewer.scene.globe.depthTestAgainstTerrain = true; // 开启深度测试

        switch (this._drawType) {
            case "Point":
                this._leftClickEventForPoint();
                break;
            case "Polyline":
                this._leftClickEventForPolyline();
                this._mouseMoveEventForPolyline();
                this._rightClickEventForPolyline(callback);
                this._doubleClickEventForPolyline(callback);
                break;
            case "Polygon":
                this._leftClickEventForPolygon();
                this._mouseMoveEventForPolygon();
                this._rightClickEventForPolygon(callback);
                this._doubleClickEventForPolygon(callback);
                break;
        }
    }

    /**
     * 绘制多边形(核心实现)
     */
    _addPolygon() {
        if (this._tempPositions.length == 1) {
            // 一个顶点:绘制线
            this._dataSource.entities.add({
                polyline: {
                    positions: new CallbackProperty(() => {
                        let c = Array.from(this._tempPositions);
                        if (this._mousePos) {
                            c.push(this._mousePos);
                        }
                        return c;
                    }, false),
                    clampToGround: true,
                    ...this.options.styles.polygon
                }
            });
        } else {
            // 两个及以上顶点:绘制多边形
            this._dataSource.entities.removeAll();
            this._dataSource.entities.add({
                polygon: {
                    hierarchy: new CallbackProperty(() => {
                        let poss = Array.from(this._tempPositions);
                        if (this._mousePos) {
                            poss.push(this._mousePos);
                        }
                        return new PolygonHierarchy(poss);
                    }, false),
                    extrudedHeightReference: HeightReference.CLAMP_TO_GROUND,
                    material: this.options.styles.polygon.fillColor,
                    clampToGround: true
                },
                polyline: {
                    positions: new CallbackProperty(() => {
                        let c = Array.from(this._tempPositions);
                        if (this._mousePos) {
                            c.push(this._mousePos);
                            c.push(c[0]); // 首尾相连
                        }
                        return c;
                    }, false),
                    clampToGround: true,
                    ...this.options.styles.polygon
                }
            });
        }
    }

    /**
     * 清除所有绘制
     */
    clearAll() {
        this._removeAllEvent(); // 清除事件监听
        this._resetParams(); // 重置参数
    }

    /**
     * 移除所有事件监听
     */
    _removeAllEvent() {
        if (this._drawHandler) {
            this._drawHandler.removeInputAction(ScreenSpaceEventType.LEFT_CLICK);
            this._drawHandler.removeInputAction(ScreenSpaceEventType.MOUSE_MOVE);
            this._drawHandler.removeInputAction(ScreenSpaceEventType.RIGHT_CLICK);
            this._drawHandler.destroy();
            this._drawHandler = null;
        }

        // 恢复原始光标样式
        if (this._originalCursor !== null) {
            this.viewer.container.style.cursor = this._originalCursor;
            this._originalCursor = null;
        }
    }

    /**
     * 重置参数
     */
    _resetParams() {
        if (this._dataSource != null) {
            this._dataSource.entities.removeAll();
            this.viewer.dataSources.remove(this._dataSource);
        }
        this._dataSource = null;
        this._tempPositions = [];
        this._mousePos = null;
        this._drawType = null;
    }
}

export default DrawTool;
设计亮点:
- ✅ 事件自动管理:自动注册、销毁事件,防止内存泄漏
- ✅ 实时预览 :使用
CallbackProperty实现动态效果 - ✅ 样式分层:默认样式 + 用户自定义,灵活配置
- ✅ 光标管理:自动切换光标样式,提升用户体验
- ✅ 回调解耦:通过回调函数返回结果,业务逻辑解耦
2. MeasureTool:测量工具核心
MeasureTool 基于 DrawTool,提供距离和面积测量功能:
javascript
import { Cartesian3, Cartographic, Math as CesiumMath, Color, Cartesian2 } from "cesium";
import DrawTool from "./draw";

class MeasureTool {
    constructor(viewer, options = {}) {
        this.viewer = viewer;
        this.drawTool = new DrawTool(viewer, options);
        this._measureEntities = new Map(); // 存储测量实体
        this._measureLabels = new Map(); // 存储测量标签
        this._currentMeasureId = null; // 当前测量ID
        this._measureCount = 0; // 测量计数器
    }

    /**
     * 开始测距
     * @param {Function} callback 测量完成回调
     */
    measureDistance(callback) {
        this.clearAll();
        this._measureCount++;
        this._currentMeasureId = `distance_${this._measureCount}`;

        this.drawTool.draw('Polyline', (entity) => {
            const positions = entity.polyline.positions.getValue();
            const totalDistance = this._calculateDistance(positions);

            // 存储测量实体和标签
            this._measureEntities.set(this._currentMeasureId, entity);

            // 在线的最后一个点添加标签
            const lastPosition = positions[positions.length - 1];
            const labelEntity = this._createLabel([lastPosition], totalDistance);
            this._measureLabels.set(this._currentMeasureId, labelEntity);

            if (callback) {
                callback({
                    id: this._currentMeasureId,
                    distance: totalDistance,
                    positions: positions
                });
            }
        });
    }

    /**
     * 开始测面
     * @param {Function} callback 测量完成回调
     */
    measureArea(callback) {
        this._measureCount++;
        this._currentMeasureId = `area_${this._measureCount}`;

        this.drawTool.draw('Polygon', (entity) => {
            const positions = entity.polygon.hierarchy.getValue().positions;
            const area = this._calculateArea(positions);

            // 存储测量实体
            this._measureEntities.set(this._currentMeasureId, entity);

            // 在面的中心点添加标签
            const center = this._calculatePolygonCenter(positions);
            const labelEntity = this._createLabel([center], area, true);
            this._measureLabels.set(this._currentMeasureId, labelEntity);

            if (callback) {
                callback({
                    id: this._currentMeasureId,
                    area: area,
                    positions: positions
                });
            }
        });
    }

    /**
     * 计算距离(Haversine 公式)
     */
    _calculateDistance(positions) {
        let totalDistance = 0;
        for (let i = 0; i < positions.length - 1; i++) {
            const start = positions[i];
            const end = positions[i + 1];
            totalDistance += this._getDistance(start, end);
        }
        return totalDistance;
    }

    /**
     * 使用 Haversine 公式计算两点间距离
     */
    _getDistance(start, end) {
        const startCartographic = Cartographic.fromCartesian(start);
        const endCartographic = Cartographic.fromCartesian(end);

        const startLon = CesiumMath.toDegrees(startCartographic.longitude);
        const startLat = CesiumMath.toDegrees(startCartographic.latitude);
        const endLon = CesiumMath.toDegrees(endCartographic.longitude);
        const endLat = CesiumMath.toDegrees(endCartographic.latitude);

        // Haversine 公式
        const R = 6371; // 地球半径(公里)
        const dLat = (endLat - startLat) * Math.PI / 180;
        const dLon = (endLon - startLon) * Math.PI / 180;
        const a = Math.sin(dLat/2) * Math.sin(dLat/2) +
                 Math.cos(startLat * Math.PI / 180) * Math.cos(endLat * Math.PI / 180) *
                 Math.sin(dLon/2) * Math.sin(dLon/2);
        const c = 2 * Math.atan2(Math.sqrt(a), Math.sqrt(1-a));
        return R * c;
    }

    /**
     * 计算多边形面积(球面几何)
     */
    _calculateArea(positions) {
        let area = 0;
        const points = positions.map(pos => {
            const cartographic = Cartographic.fromCartesian(pos);
            return {
                longitude: CesiumMath.toDegrees(cartographic.longitude),
                latitude: CesiumMath.toDegrees(cartographic.latitude)
            };
        });

        for (let i = 0; i < points.length; i++) {
            const j = (i + 1) % points.length;
            area += points[i].longitude * points[j].latitude;
            area -= points[j].longitude * points[i].latitude;
        }

        // 转换为平方公里
        area = Math.abs(area) * 111.32 * 111.32 * Math.cos(points[0].latitude * Math.PI / 180) / 2;
        return area;
    }

    /**
     * 创建测量结果标签
     */
    _createLabel(positions, value, isArea = false) {
        const position = positions[0];
        const displayValue = isArea ?
            `${value.toFixed(2)} 平方公里` :
            `${value.toFixed(2)} 公里`;

        return this.viewer.entities.add({
            position: position,
            label: {
                text: displayValue,
                font: '14px sans-serif',
                fillColor: Color.WHITE,
                outlineColor: Color.BLACK,
                outlineWidth: 2,
                verticalOrigin: 1,
                pixelOffset: new Cartesian2(0, -10),
                showBackground: true,
                backgroundColor: new Color(0.165, 0.165, 0.165, 0.8),
                backgroundPadding: new Cartesian2(7, 5),
                disableDepthTestDistance: Number.POSITIVE_INFINITY
            }
        });
    }

    /**
     * 计算多边形中心点(质心)
     */
    _calculatePolygonCenter(positions) {
        let sumX = 0, sumY = 0, sumZ = 0;
        positions.forEach(pos => {
            sumX += pos.x;
            sumY += pos.y;
            sumZ += pos.z;
        });

        const center = new Cartesian3(
            sumX / positions.length,
            sumY / positions.length,
            sumZ / positions.length
        );

        const cartographic = Cartographic.fromCartesian(center);
        return Cartesian3.fromRadians(
            cartographic.longitude,
            cartographic.latitude,
            cartographic.height
        );
    }

    /**
     * 清除所有测量
     */
    clearAll() {
        this._measureEntities.forEach(entity => {
            this.viewer.entities.remove(entity);
        });
        this._measureEntities.clear();

        this._measureLabels.forEach(label => {
            this.viewer.entities.remove(label);
        });
        this._measureLabels.clear();

        this.drawTool.clearAll();
        this._currentMeasureId = null;
        this._measureCount = 0;
    }
}

export default MeasureTool;
设计亮点:
- ✅ 复用绘制逻辑:基于 DrawTool,避免重复开发
- ✅ 地理计算封装:Haversine 公式、球面几何计算
- ✅ 结果自动标注:自动创建和定位测量标签
- ✅ ID 管理:为每次测量分配唯一 ID,支持单独清除
- ✅ 单位自动转换:自动转换并格式化显示单位
🎯 使用教程
基础用法
1. 初始化 CesiumLite
javascript
const cesiumLite = new CesiumLite('cesiumContainer', {
  map: {
    baseMap: {
      id: 'imagery'
    },
    camera: {
      longitude: 116.397428,
      latitude: 39.90923,
      height: 1000000
    }
  }
});
2. 标绘功能
绘制点
javascript
// 绘制点,并在完成时获取结果
cesiumLite.drawTool.draw('Point', (entity) => {
  console.log('绘制完成:', entity);
  const position = entity.position.getValue();
  console.log('点位坐标:', position);
});
绘制线
javascript
// 绘制线(左键添加点,右键或双击完成)
cesiumLite.drawTool.draw('Polyline', (entity) => {
  console.log('绘制完成:', entity);
  const positions = entity.polyline.positions.getValue();
  console.log('线段坐标:', positions);
});
绘制面
javascript
// 绘制面(左键添加点,右键或双击完成,至少3个点)
cesiumLite.drawTool.draw('Polygon', (entity) => {
  console.log('绘制完成:', entity);
  const positions = entity.polygon.hierarchy.getValue().positions;
  console.log('多边形坐标:', positions);
});
清除绘制
javascript
// 清除所有绘制内容
cesiumLite.drawTool.clearAll();
3. 测量功能
测量距离
javascript
// 开始测距(左键添加点,右键或双击完成)
cesiumLite.measureTool.measureDistance((result) => {
  console.log('测量ID:', result.id);
  console.log('总距离:', result.distance, '公里');
  console.log('测量点:', result.positions);
});
测量面积
javascript
// 开始测面(左键添加点,右键或双击完成,至少3个点)
cesiumLite.measureTool.measureArea((result) => {
  console.log('测量ID:', result.id);
  console.log('总面积:', result.area, '平方公里');
  console.log('多边形顶点:', result.positions);
});
清除测量
javascript
// 清除所有测量结果
cesiumLite.measureTool.clearAll();

// 清除指定测量
cesiumLite.measureTool.clear('distance_1');
高级用法
自定义绘制样式
javascript
// 创建 CesiumLite 时配置全局样式
const cesiumLite = new CesiumLite('cesiumContainer', {
  map: { /* ... */ },
  drawStyles: {
    point: {
      color: Cesium.Color.BLUE,
      pixelSize: 15,
      outlineColor: Cesium.Color.WHITE,
      outlineWidth: 3
    },
    polyline: {
      color: Cesium.Color.GREEN,
      width: 5,
      material: new Cesium.PolylineDashMaterialProperty({
        color: Cesium.Color.GREEN
      })
    },
    polygon: {
      fillColor: Cesium.Color.BLUE.withAlpha(0.3),
      color: Cesium.Color.BLUE,
      width: 4
    }
  }
});
绘制结果处理
javascript
// 保存绘制结果到业务系统
cesiumLite.drawTool.draw('Polygon', (entity) => {
  const positions = entity.polygon.hierarchy.getValue().positions;

  // 转换为经纬度数组
  const coordinates = positions.map(pos => {
    const cartographic = Cesium.Cartographic.fromCartesian(pos);
    return {
      longitude: Cesium.Math.toDegrees(cartographic.longitude),
      latitude: Cesium.Math.toDegrees(cartographic.latitude),
      height: cartographic.height
    };
  });

  // 提交到后端
  fetch('/api/save-polygon', {
    method: 'POST',
    body: JSON.stringify({ coordinates }),
    headers: { 'Content-Type': 'application/json' }
  });
});
测量结果展示
javascript
// 在自定义UI中展示测量结果
cesiumLite.measureTool.measureDistance((result) => {
  // 更新UI显示
  document.getElementById('distance-result').innerHTML = `
    <div class="measure-result">
      <strong>测量距离:</strong>
      <span>${result.distance.toFixed(2)} 公里</span>
      <span>${(result.distance * 1000).toFixed(2)} 米</span>
    </div>
  `;

  // 保存到历史记录
  saveMeasureHistory({
    type: 'distance',
    value: result.distance,
    timestamp: new Date(),
    positions: result.positions
  });
});
结合按钮控制
javascript
// 完整的交互示例
const drawButtons = {
  point: document.getElementById('drawPoint'),
  line: document.getElementById('drawLine'),
  polygon: document.getElementById('drawPolygon'),
  clear: document.getElementById('clearDraw')
};

const measureButtons = {
  distance: document.getElementById('measureDistance'),
  area: document.getElementById('measureArea'),
  clear: document.getElementById('clearMeasure')
};

// 移除所有按钮的激活状态
function removeActiveState() {
  Object.values({...drawButtons, ...measureButtons}).forEach(btn => {
    btn.classList.remove('active');
  });
}

// 绘制点
drawButtons.point.addEventListener('click', () => {
  removeActiveState();
  drawButtons.point.classList.add('active');
  cesiumLite.drawTool.draw('Point', (entity) => {
    console.log('点绘制完成');
    removeActiveState();
  });
});

// 绘制线
drawButtons.line.addEventListener('click', () => {
  removeActiveState();
  drawButtons.line.classList.add('active');
  cesiumLite.drawTool.draw('Polyline', (entity) => {
    console.log('线绘制完成');
    removeActiveState();
  });
});

// 绘制面
drawButtons.polygon.addEventListener('click', () => {
  removeActiveState();
  drawButtons.polygon.classList.add('active');
  cesiumLite.drawTool.draw('Polygon', (entity) => {
    console.log('面绘制完成');
    removeActiveState();
  });
});

// 清除绘制
drawButtons.clear.addEventListener('click', () => {
  removeActiveState();
  cesiumLite.drawTool.clearAll();
});

// 测距
measureButtons.distance.addEventListener('click', () => {
  removeActiveState();
  measureButtons.distance.classList.add('active');
  cesiumLite.measureTool.measureDistance((result) => {
    console.log('测距完成:', result.distance, '公里');
    removeActiveState();
  });
});

// 测面
measureButtons.area.addEventListener('click', () => {
  removeActiveState();
  measureButtons.area.classList.add('active');
  cesiumLite.measureTool.measureArea((result) => {
    console.log('测面完成:', result.area, '平方公里');
    removeActiveState();
  });
});

// 清除测量
measureButtons.clear.addEventListener('click', () => {
  removeActiveState();
  cesiumLite.measureTool.clearAll();
});
📊 对比传统开发方式
代码量对比
| 功能 | 传统方式 | CesiumLite | 减少代码量 |
|---|---|---|---|
| 绘制点 | 30+ 行 | 3 行 | 90% |
| 绘制线 | 80+ 行 | 3 行 | 96% |
| 绘制面 | 120+ 行 | 3 行 | 97% |
| 距离测量 | 150+ 行 | 5 行 | 97% |
| 面积测量 | 180+ 行 | 5 行 | 97% |
| 清除功能 | 30+ 行 | 1 行 | 97% |
功能对比
| 功能 | 传统方式 | CesiumLite |
|---|---|---|
| 基础绘制 | ✅ | ✅ |
| 实时预览 | ❌ 需手动实现 | ✅ 内置支持 |
| 事件管理 | ❌ 手动管理 | ✅ 自动管理 |
| 样式配置 | ❌ 分散配置 | ✅ 集中配置 |
| 测量计算 | ❌ 需手动实现 | ✅ 内置算法 |
| 结果标注 | ❌ 需手动创建 | ✅ 自动标注 |
| 光标管理 | ❌ 需手动切换 | ✅ 自动切换 |
| 内存管理 | ❌ 容易泄漏 | ✅ 自动清理 |
开发体验对比
| 方面 | 传统方式 | CesiumLite |
|---|---|---|
| 学习难度 | ⭐⭐⭐⭐⭐ 需深入了解 Cesium API | ⭐⭐ 简单易学 |
| 开发效率 | ⭐⭐ 大量重复代码 | ⭐⭐⭐⭐⭐ 开箱即用 |
| 代码维护 | ⭐⭐ 分散难维护 | ⭐⭐⭐⭐⭐ 集中易维护 |
| Bug 风险 | ⭐⭐⭐⭐ 事件泄漏、状态混乱 | ⭐ 风险极低 |
🚀 快速开始
1. 安装
bash
# NPM 安装(推荐)
npm install cesium-lite

# 或者通过 GitHub 克隆
git clone https://github.com/lukeSuperCoder/cesium-lite.git
cd cesium-lite
npm install
2. 引入使用
方式一:NPM 方式
javascript
import CesiumLite from 'cesium-lite';
import 'cesium/Build/Cesium/Widgets/widgets.css';

const cesiumLite = new CesiumLite('cesiumContainer', {
  // 配置项
});

// 开始绘制
cesiumLite.drawTool.draw('Polygon', (result) => {
  console.log('绘制完成', result);
});
方式二:本地运行项目
bash
# 克隆项目
git clone https://github.com/lukeSuperCoder/cesium-lite.git
cd cesium-lite

# 安装依赖
npm install

# 启动开发服务器
npm run dev
访问 http://localhost:8020/examples/draw.html 查看标绘测量示例。
💡 最佳实践建议
1. 交互提示优化
javascript
// 添加交互提示,提升用户体验
cesiumLite.drawTool.draw('Polygon', (entity) => {
  // 绘制开始时显示提示
  showToast('左键添加点,右键或双击完成绘制');

  // 绘制完成后的处理
  showToast('绘制完成!');
});
2. 错误处理
javascript
// 添加错误处理
try {
  cesiumLite.measureTool.measureArea((result) => {
    if (result.area < 0.01) {
      showWarning('测量面积过小,请重新绘制');
      cesiumLite.measureTool.clear(result.id);
    }
  });
} catch (error) {
  console.error('测量失败:', error);
  showError('测量失败,请重试');
}
3. 样式主题化
javascript
// 定义多套主题样式
const themes = {
  default: {
    point: { color: Cesium.Color.RED, pixelSize: 10 },
    polyline: { color: Cesium.Color.YELLOW, width: 3 },
    polygon: { fillColor: Cesium.Color.RED.withAlpha(0.4) }
  },
  blue: {
    point: { color: Cesium.Color.BLUE, pixelSize: 10 },
    polyline: { color: Cesium.Color.CYAN, width: 3 },
    polygon: { fillColor: Cesium.Color.BLUE.withAlpha(0.4) }
  }
};

// 切换主题
function setTheme(themeName) {
  const cesiumLite = new CesiumLite('cesiumContainer', {
    drawStyles: themes[themeName]
  });
}
4. 测量历史记录
javascript
// 保存测量历史
const measureHistory = [];

cesiumLite.measureTool.measureDistance((result) => {
  measureHistory.push({
    id: result.id,
    type: 'distance',
    value: result.distance,
    timestamp: new Date(),
    positions: result.positions
  });

  // 更新历史列表UI
  updateHistoryList(measureHistory);
});

// 重新显示历史测量
function showHistoryMeasure(id) {
  const history = measureHistory.find(h => h.id === id);
  if (history) {
    // 重新绘制测量结果
    // ...
  }
}
🔮 未来规划
标绘测量模块后续将会支持:
- 更多几何图形(圆形、矩形、箭头等)
- 编辑功能(移动点、修改形状)
- 吸附功能(点吸附、边界吸附)
- 测量单位切换(公里/米/英里)
- 高程测量(海拔高度、相对高度)
- 坡度坡向分析
- 测量结果导出(GeoJSON、KML)
- 撤销/重做功能
📚 相关资源
- GitHub 仓库 :github.com/lukeSuperCo...
- 在线演示 :lukesupercoder.github.io/cesium-lite...
- NPM 包 :www.npmjs.com/package/ces...
- 问题反馈 :GitHub Issues
🙏 总结
CesiumLite 的标绘测量模块通过模块化封装和事件自动管理,有效解决了 Cesium 原生开发中的诸多痛点:
- ✅ 极简 API:减少 90%+ 的代码量,一行代码完成绘制
- ✅ 自动管理:事件、状态、资源全自动管理,零内存泄漏
- ✅ 实时预览:动态效果开箱即用,交互体验优秀
- ✅ 精确计算:内置地理计算算法,结果准确可靠
- ✅ 样式灵活:支持全局和局部样式配置,满足不同需求
如果你正在使用 Cesium 开发标绘测量功能,CesiumLite 将是你的最佳选择,让开发效率提升 10 倍!
⭐ 如果这个项目对你有帮助,欢迎给个 Star 支持一下!
💬 有任何问题或建议,欢迎在评论区交流!
相关标签: #Cesium #三维地图 #WebGIS #标绘测量 #前端开发 #JavaScript #开源项目 #地图可视化