/**
* @function
* @todo: 定义Echarts配置项数据结构
* @param: null
* @return: null
*/
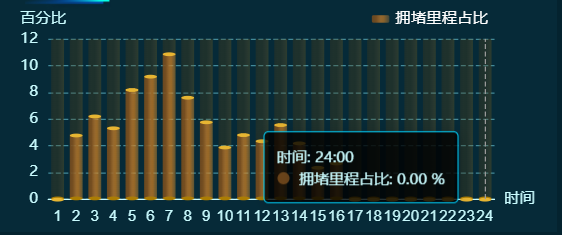
const getBarOptions = () => {
const xData = jamList.value.map((item) => parseInt(item.timeName?.split('.')[0]))
const barData = jamList.value.map((item) => item.jamPer)
const options = {
borderColor: '#CAFCFF',
textStyle: {
color: '#CAFCFF'
},
tooltip: {
trigger: 'axis',
axisPointer: {
type: 'line',
lineStyle: {
color: '#999',
type: 'dashed'
}
},
backgroundColor: 'rgba(0, 0, 0, 0.8)',
borderColor: '#00d4ff',
borderWidth: 1,
textStyle: {
color: '#cafcff',
fontSize: 12
},
formatter: function (params) {
let result = `时间: ${params[0].axisValue}:00<br/>`
params.forEach((item) => {
if (item.seriesName) {
let unit = ''
let value = item.value
result += `${item.marker} ${item.seriesName}: ${value} ${unit}%<br/>`
}
})
return result
}
},
grid: {
left: '1%',
right: '8%',
top: '15%',
bottom: '3%',
containLabel: true
},
legend: {
right: '8%',
top: '0',
textStyle: {
color: '#fff',
fontSize: $mcCssBuilder.getCssSize(12)
},
itemWidth: 14,
itemHeight: 6,
data: ['拥堵里程占比']
},
xAxis: [
{
name: '时间',
type: 'category',
data: xData,
nameLocation: 'end',
nameGap: 2,
nameTextStyle: {
color: '#CAFCFF',
fontSize: $mcCssBuilder.getCssSize(12),
align: 'left',
padding: [0, 0, 0, 6]
},
axisTick: {
show: false
},
axisLine: {
lineStyle: {
color: '#CAFCFF'
}
},
axisLabel: {
show: true, // 显示原始X轴标签作为备用
color: getColor.value('colorTextBase'),
fontSize: $mcCssBuilder.getCssSize(12),
fontFamily: 'Arial, Arial-400',
position: 'end', // 'start', 'middle', 'end'
interval: 0 // 控制标签显示间隔,0 表示全部显示
// textStyle: {
// color: function (value, index) {
// if (value == 10) {
// return '#25ffd3'
// } else {
// return '#CAFCFF'
// }
// }
// }
},
interval: 1
}
],
yAxis: [
{
name: '百分比',
type: 'value',
nameGap: 10,
nameTextStyle: {
color: '#CAFCFF',
fontSize: $mcCssBuilder.getCssSize(12),
padding: [0, 0, 0, -8]
},
axisLine: {
show: false,
lineStyle: {
color: '#CAFCFF'
}
},
splitLine: {
lineStyle: {
color: '#418999',
type: 'dashed'
}
},
axisTick: {
show: false
},
axisLabel: {
textStyle: {
color: getColor.value('colorTextBase'),
fontSize: $mcCssBuilder.getCssSize(12)
}
}
}
],
series: [
{
name: '拥堵里程占比',
type: 'bar',
// barWidth: 10,
z: 19,
barGap: '-100%',
showBackground: true,
backgroundStyle: {
opacity: 0.3,
color: {
type: 'linear',
x: 0,
y: 0,
x2: 1,
y2: 0,
colorStops: [
{ offset: 0, color: '#4d3b12' },
{ offset: 0.25, color: '#584312' },
{ offset: 0.5, color: '#554110' },
{ offset: 0.75, color: '#6f521c' },
{ offset: 1, color: '#85671b' }
]
}
},
itemStyle: {
color: {
type: 'linear',
x: 0,
y: 0,
x2: 1,
y2: 0,
colorStops: [
{ offset: 0, color: 'rgba(122,77,29,0.81)' },
{ offset: 0.25, color: 'rgba(128,82,31,0.89)' },
{ offset: 0.5, color: 'rgba(185,120,45,0.77)' },
{ offset: 0.7, color: 'rgba(251,149,34,0.52)' },
{ offset: 1, color: 'rgba(242,156,60,0.26)' }
]
}
},
data: barData
},
// 上椭圆
{
name: '拥堵里程占比',
type: 'pictorialBar',
silent: true,
symbolSize: [10, 3],
symbolOffset: [0, -1],
symbolPosition: 'end',
z: 22,
color: '#e7b532',
data: barData,
tooltip: {
show: false // 不展示
}
},
// 下椭圆
{
name: '拥堵里程占比',
type: 'pictorialBar',
silent: true,
symbolSize: [10, 3],
symbolOffset: [0, 1],
z: 21,
itemStyle: {
color: '#ab7d04'
},
data: barData,
tooltip: {
show: false // 不展示
}
}
]
}
return options
}
/**
* @description: 获取图表配置项
* @return {*}
*/
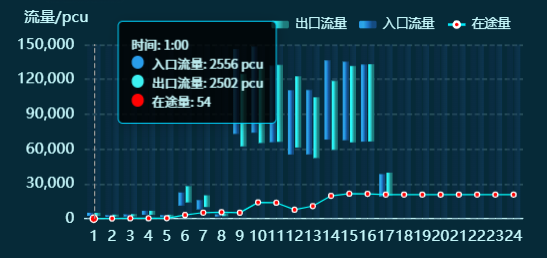
const getFlowTrendOption = () => ({
tooltip: {
trigger: 'axis',
axisPointer: {
type: 'line',
lineStyle: {
color: '#999',
type: 'dashed'
}
},
backgroundColor: 'rgba(0, 0, 0, 0.8)',
borderColor: '#00d4ff',
borderWidth: 1,
textStyle: {
color: '#cafcff',
fontSize: $mcCssBuilder.getCssSize(12)
},
formatter: function (params) {
let result = `时间: ${params[0].axisValue}:00<br/>`
params.forEach((item) => {
if (item.seriesName) {
let unit = ''
let value = item.value
// 为不同的系列添加单位和格式化
if (item.seriesName === '历史最大值') {
unit = ''
} else if (item.seriesName === '出口流量' || item.seriesName === '入口流量') {
// 直接使用原始数值,不需要转换
unit = 'pcu'
}
result += `${item.marker} ${item.seriesName}: ${value} ${unit}<br/>`
}
})
return result
}
},
legend: {
data: ['出口流量', '入口流量', '在途量'], // '历史最大值' 暂时注释
top: '2%',
right: 10,
itemWidth: 14,
itemHeight: 6,
textStyle: {
color: '#cafcff',
fontSize: $mcCssBuilder.getCssSize(10)
}
},
grid: {
left: 8,
right: 5,
bottom: 5,
top: 30,
containLabel: true
},
xAxis: {
type: 'category',
boundaryGap: true,
data: chartData.value.xAxis,
axisLabel: {
color: '#cafcff',
fontSize: $mcCssBuilder.getCssSize(12),
interval: 0 // 控制标签显示间隔,0 表示全部显示
},
axisTick: {
show: false
},
axisLine: {
lineStyle: {
color: '#cafcff',
type: 'solid'
}
},
splitLine: {
show: false,
lineStyle: {
color: 'rgba(202, 252, 255, 0.25)',
type: 'dashed'
}
}
},
yAxis: [
{
type: 'value',
name: '流量/pcu',
nameTextStyle: {
color: '#cafcff',
fontSize: $mcCssBuilder.getCssSize(12),
padding: [0, 0, 0, -45]
},
axisLabel: {
color: '#cafcff',
fontSize: $mcCssBuilder.getCssSize(12),
formatter: '{value}'
},
axisLine: {
lineStyle: {
color: '#cafcff'
}
},
splitLine: {
show: true,
lineStyle: {
color: 'rgba(202, 252, 255, 0.25)',
type: 'dashed'
}
}
},
{
type: 'value',
// name: '历史最大值/米',
nameTextStyle: {
color: '#cafcff',
fontSize: $mcCssBuilder.getCssSize(12)
},
axisLabel: {
show: false
},
axisTick: {
show: false
},
axisLine: {
show: false
},
splitLine: {
show: false
}
}
],
rich: {
1: {
height: 20,
width: 20,
align: 'center'
// backgroundColor: {
// image: '图片URL或base64'
// }
}
},
series: [
{
name: '',
type: 'bar',
stack: '入口流量',
// barWidth: '6',
itemStyle: {
barBorderColor: 'rgba(0,0,0,0)',
color: 'rgba(0,0,0,0)'
},
emphasis: {
itemStyle: {
barBorderColor: 'rgba(0,0,0,0)',
color: 'rgba(0,0,0,0)'
}
},
data: chartData.value.entryFlow
},
{
name: '入口流量',
type: 'bar',
stack: '入口流量',
data: chartData.value.entryFlow,
itemStyle: {
color: {
type: 'linear',
x: 0,
y: 0,
x2: 1,
y2: 0,
colorStops: [
{ offset: 0, color: '#299dea' },
{ offset: 0.25, color: '#2ca7e6' },
{ offset: 0.5, color: '#1e76cb' },
{ offset: 0.75, color: '#144b81' },
{ offset: 1, color: '#144b81' }
]
}
},
showBackground: true,
backgroundStyle: {
opacity: 0.3,
color: {
type: 'linear',
x: 0,
y: 0,
x2: 1,
y2: 0,
colorStops: [
{ offset: 0, color: '#122e4d' },
{ offset: 0.5, color: '#123358' },
{ offset: 1, color: '#103055' }
]
}
}
// barWidth: '6'
},
{
name: '',
type: 'bar',
stack: '出口流量',
itemStyle: {
barBorderColor: 'rgba(0,0,0,0)',
color: 'rgba(0,0,0,0)'
},
emphasis: {
itemStyle: {
barBorderColor: 'rgba(0,0,0,0)',
color: 'rgba(0,0,0,0)'
}
},
data: chartData.value.exitFlow
},
{
name: '出口流量',
type: 'bar',
stack: '出口流量',
data: chartData.value.exitFlow,
// barWidth: '6',
itemStyle: {
color: {
type: 'linear',
x: 0,
y: 0,
x2: 1,
y2: 0,
colorStops: [
{ offset: 0, color: '#3cf1f2' },
{ offset: 0.25, color: '#22fafb' },
{ offset: 0.5, color: '#2db8b9' },
{ offset: 0.7, color: '#1f7f80' },
{ offset: 1, color: '#1d7a79' }
]
}
},
showBackground: true,
backgroundStyle: {
opacity: 0.3,
color: {
type: 'linear',
x: 0,
y: 0,
x2: 1,
y2: 0,
colorStops: [
{ offset: 0, color: '#103055' },
{ offset: 0.5, color: '#1c476f' },
{ offset: 1, color: '#1b4b85' }
]
}
}
},
{
name: '在途量',
type: 'line',
yAxisIndex: 0,
data: chartData.value.inTransitFlow,
lineStyle: {
color: '#02EEFF',
width: 1
},
itemStyle: {
color: '#FF0202',
borderColor: '#ffffff',
borderWidth: 1
},
symbol: 'circle',
symbolSize: 4
}
// {
// name: '历史最大值',
// type: 'line',
// yAxisIndex: 1,
// data: chartData.value.hisMaxValues,
// lineStyle: {
// color: '#EF4444',
// width: 1
// },
// itemStyle: {
// color: '#000000',
// borderColor: '#ffffff',
// borderWidth: 1
// },
// symbol: 'circle',
// symbolSize: 4
// // smooth: true
// }
]
})

/**
 * @description: 获取图表配置项
 * @return {*}
 */
const updateChart = () => {
  const option = {
    title: { text: '' },
    grid: {
      top: 0,
      right: 0,
      bottom: '-20%',
      left: 0,
      containLabel: false
    },
    series: [
      {
        name: '内圈小',
        type: 'gauge',
        center: ['50%', '85%'],
        radius: '142%',
        startAngle: 180,
        endAngle: 0,
        min: 0,
        max: 100,
        splitNumber: 4,
        // 圆环底色
        axisLine: {
          // 坐标轴线
          lineStyle: {
            // 属性lineStyle控制线条样式: 使用多段颜色模拟渐变
            // color: [
            //   [0.0, '#0dcbf6'],
            //   [0.25, '#3cdcf7'],
            //   [0.5, '#6be7f9'],
            //   [0.75, '#9af1fb'],
            //   [1.0, '#c9fbfe']
            // ],
            color: [[1, '#065f80']],
            width: 4.5
          }
        },
        // 圆环着色部分
        progress: {
          show: true,
          itemStyle: {
            color: {
              type: 'linear',
              x: 0,
              y: 0,
              x2: 1,
              y2: 0,
              colorStops: [
                {
                  offset: 0,
                  color: '#cb4d15'
                },
                {
                  offset: 0.4,
                  color: '#f9b41e'
                },
                {
                  offset: 1,
                  color: '#0dcbf6'
                }
              ]
            }
          },
          zlevel: 3,
          width: 4
        },
        splitLine: {
          //分隔线样式
          show: false
        },
        axisLabel: {
          //刻度标签
          show: false
        },
        axisTick: {
          //刻度样式
          show: false
        },
        detail: {
          // 其余属性默认使用全局文本样式,详见TEXTSTYLE
          show: false,
          fontWeight: 'bolder',
          //   fontSize: 40,
          offsetCenter: ['0', '50%']
        },
        markPoint: {
          // 仪表盘指针圆
          animation: false,
          silent: true,
          data: [
            {
              x: '50%',
              y: '85%',
              symbol: 'circle',
              symbolSize: 12,
              itemStyle: {
                color: '#0dcbf6'
              }
            },
            {
              x: '50%',
              y: '85%',
              symbol: 'circle',
              symbolSize: 10,
              itemStyle: {
                color: '#333'
              }
            },
            {
              x: '50%',
              y: '85%',
              symbol: 'circle',
              symbolSize: 5,
              itemStyle: {
                color: '#fff'
              }
            }
          ]
        },
        // pointer: {
        //
        //   //icon:'none',
        //   width: 10,
        //   length: '60%',
        //   itemStyle: {
        //     color: 'auto'
        //   }
        // },
        // 仪表盘指针
        pointer: {
          show: true,
          width: 2,
          length: '65%',
          itemStyle: {
            color: '#0dcbf6'
          }
        },
        data: [
          {
            // 使用传入的 proportion 值,如果不是数字则回退为 0
            value: Number(props.proportion ?? 0),
            name: ''
          }
        ]
      }
    ]
  }
  return option
}