基本介绍
pg_tileserv 是一个轻量级、专用于 PostGIS 的地图瓦片服务器,采用 Go 语言开发,其核心目标是简化从 PostGIS 数据库直接生成并提供 Mapbox Vector Tiles(MVT) 的过程。该工具通过将 HTTP 瓦片请求转化为 SQL 查询,并利用 PostgreSQL 内建的 ST_AsMVT() 函数高效生成矢量瓦片,从而实现高性能、低依赖的地图服务部署(基于标准库 net/http + gorilla/mux 构建的轻量级矢量瓦片服务)
使用教程:
先拉取编译代码:
# 克隆项目仓库
git clone https://github.com/CrunchyData/pg_tileserv.git

# 进入项目目录
cd pg_tileserv

# 编译项目
go build
然后设置计算机的环境变量(以windows为例,还要修改自己postgis的ip、端口、密码等):
SET DATABASE_URL=postgresql://username:password@host/dbname
然后通过cmd运行:
pg_tileserv.exe
打开:pg_tileserv![]() http://localhost:7800/
http://localhost:7800/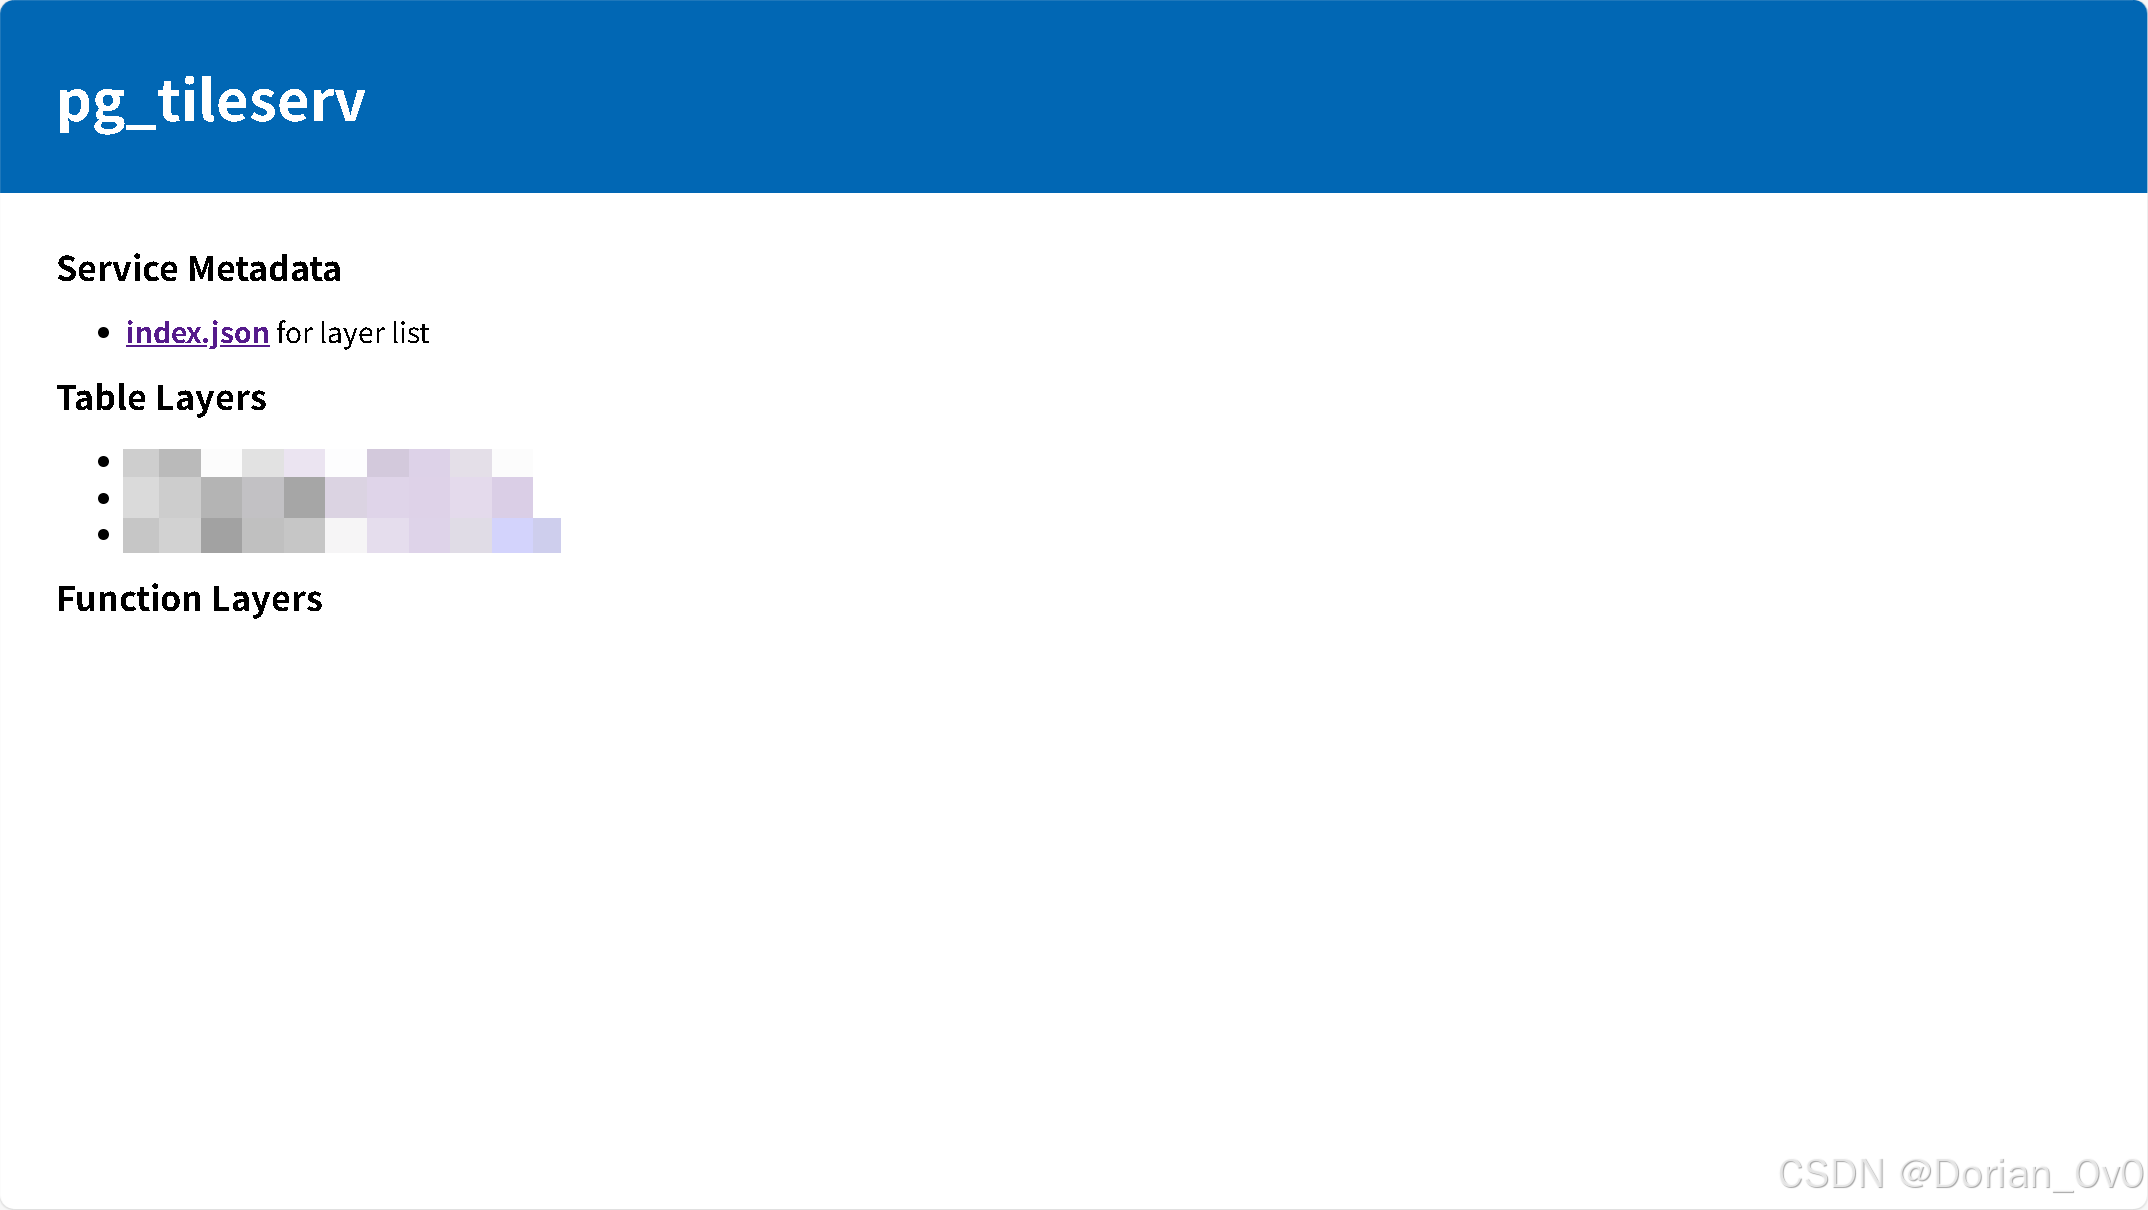
查看图层,即可看到:
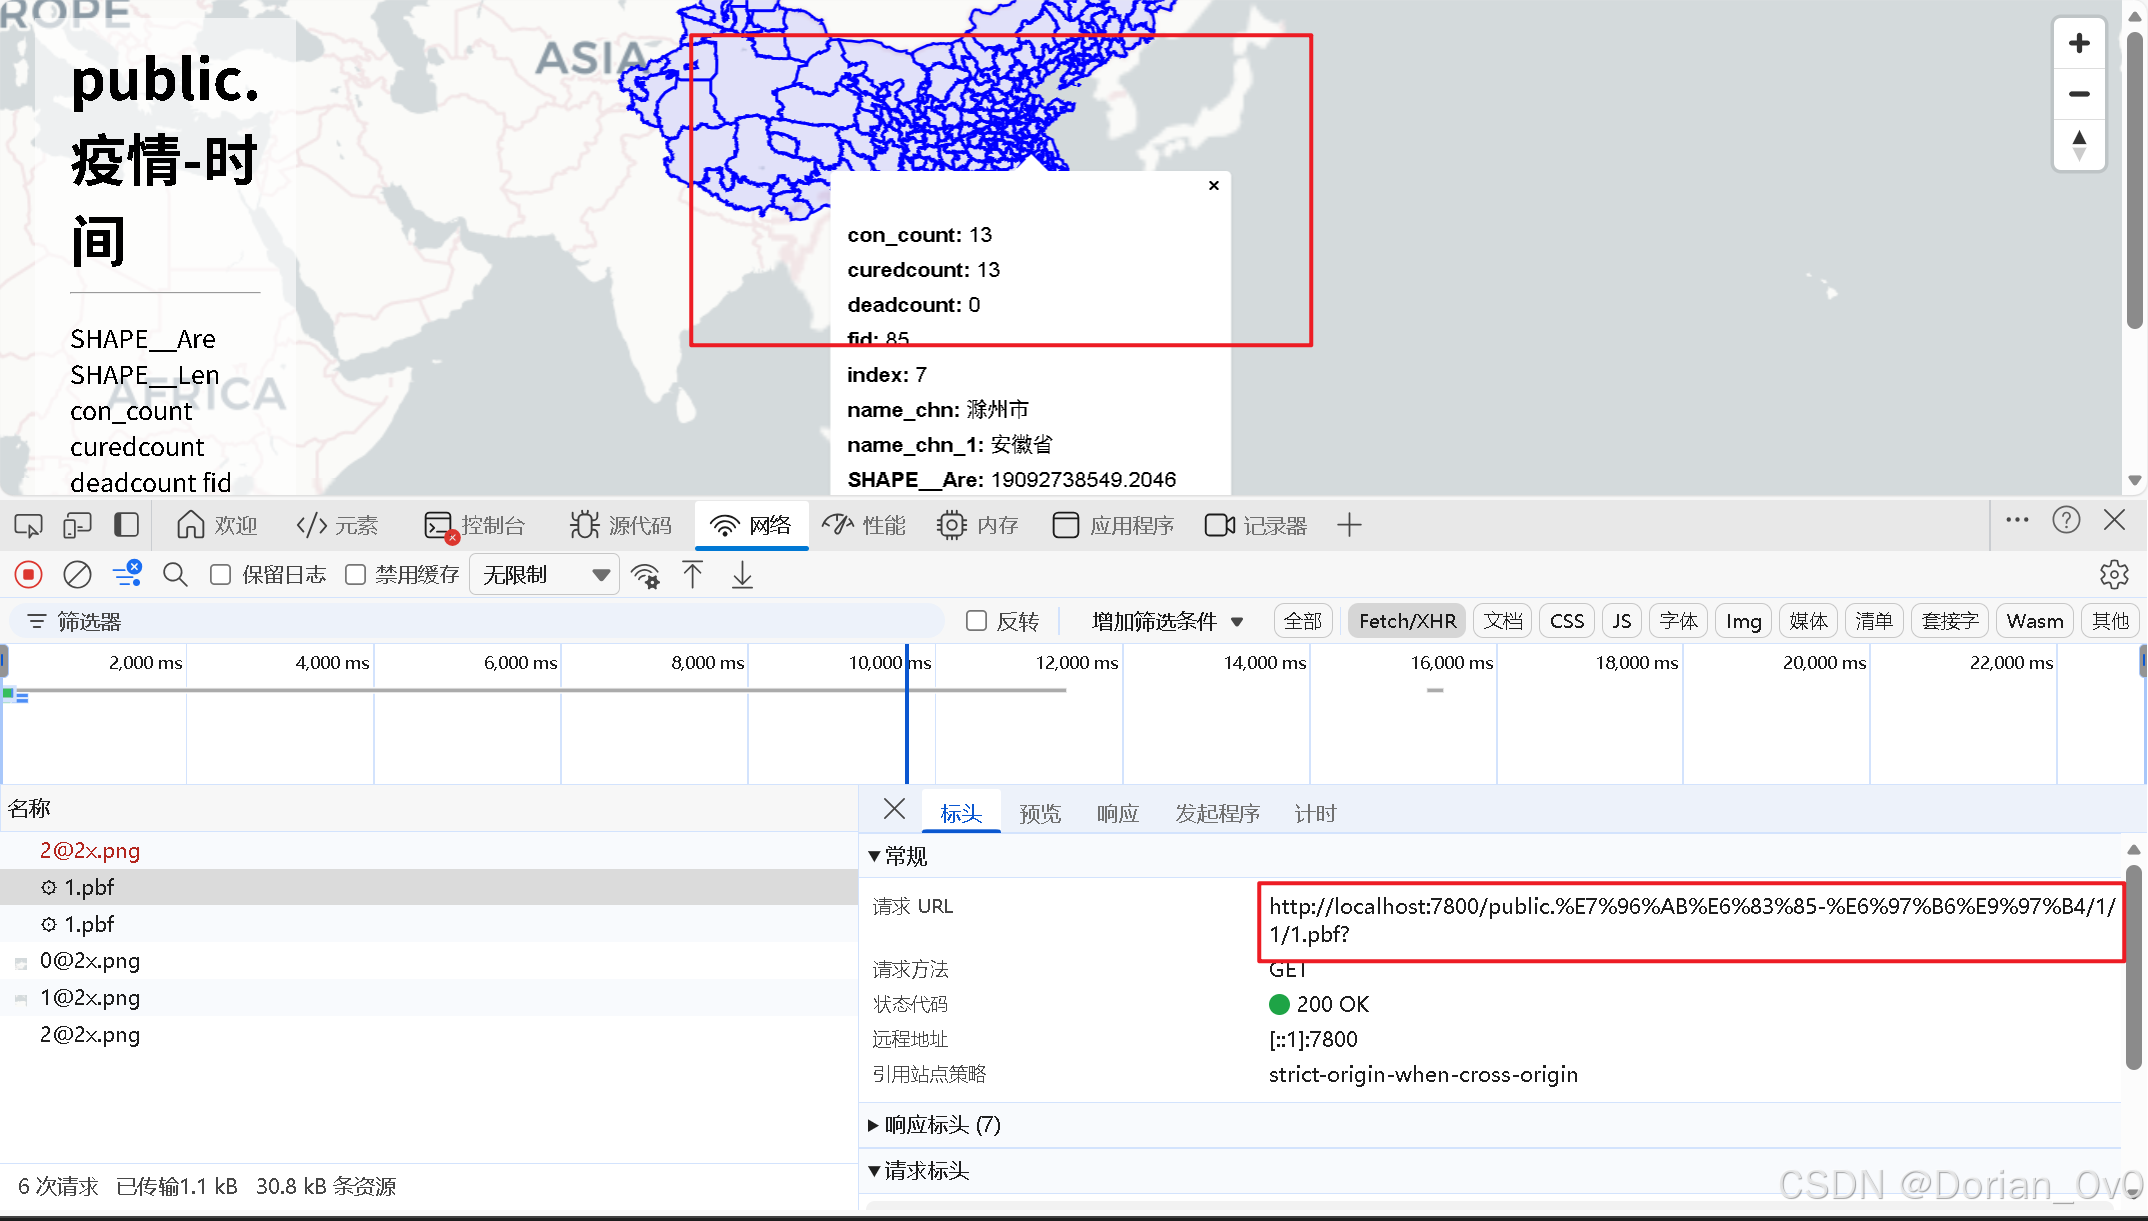
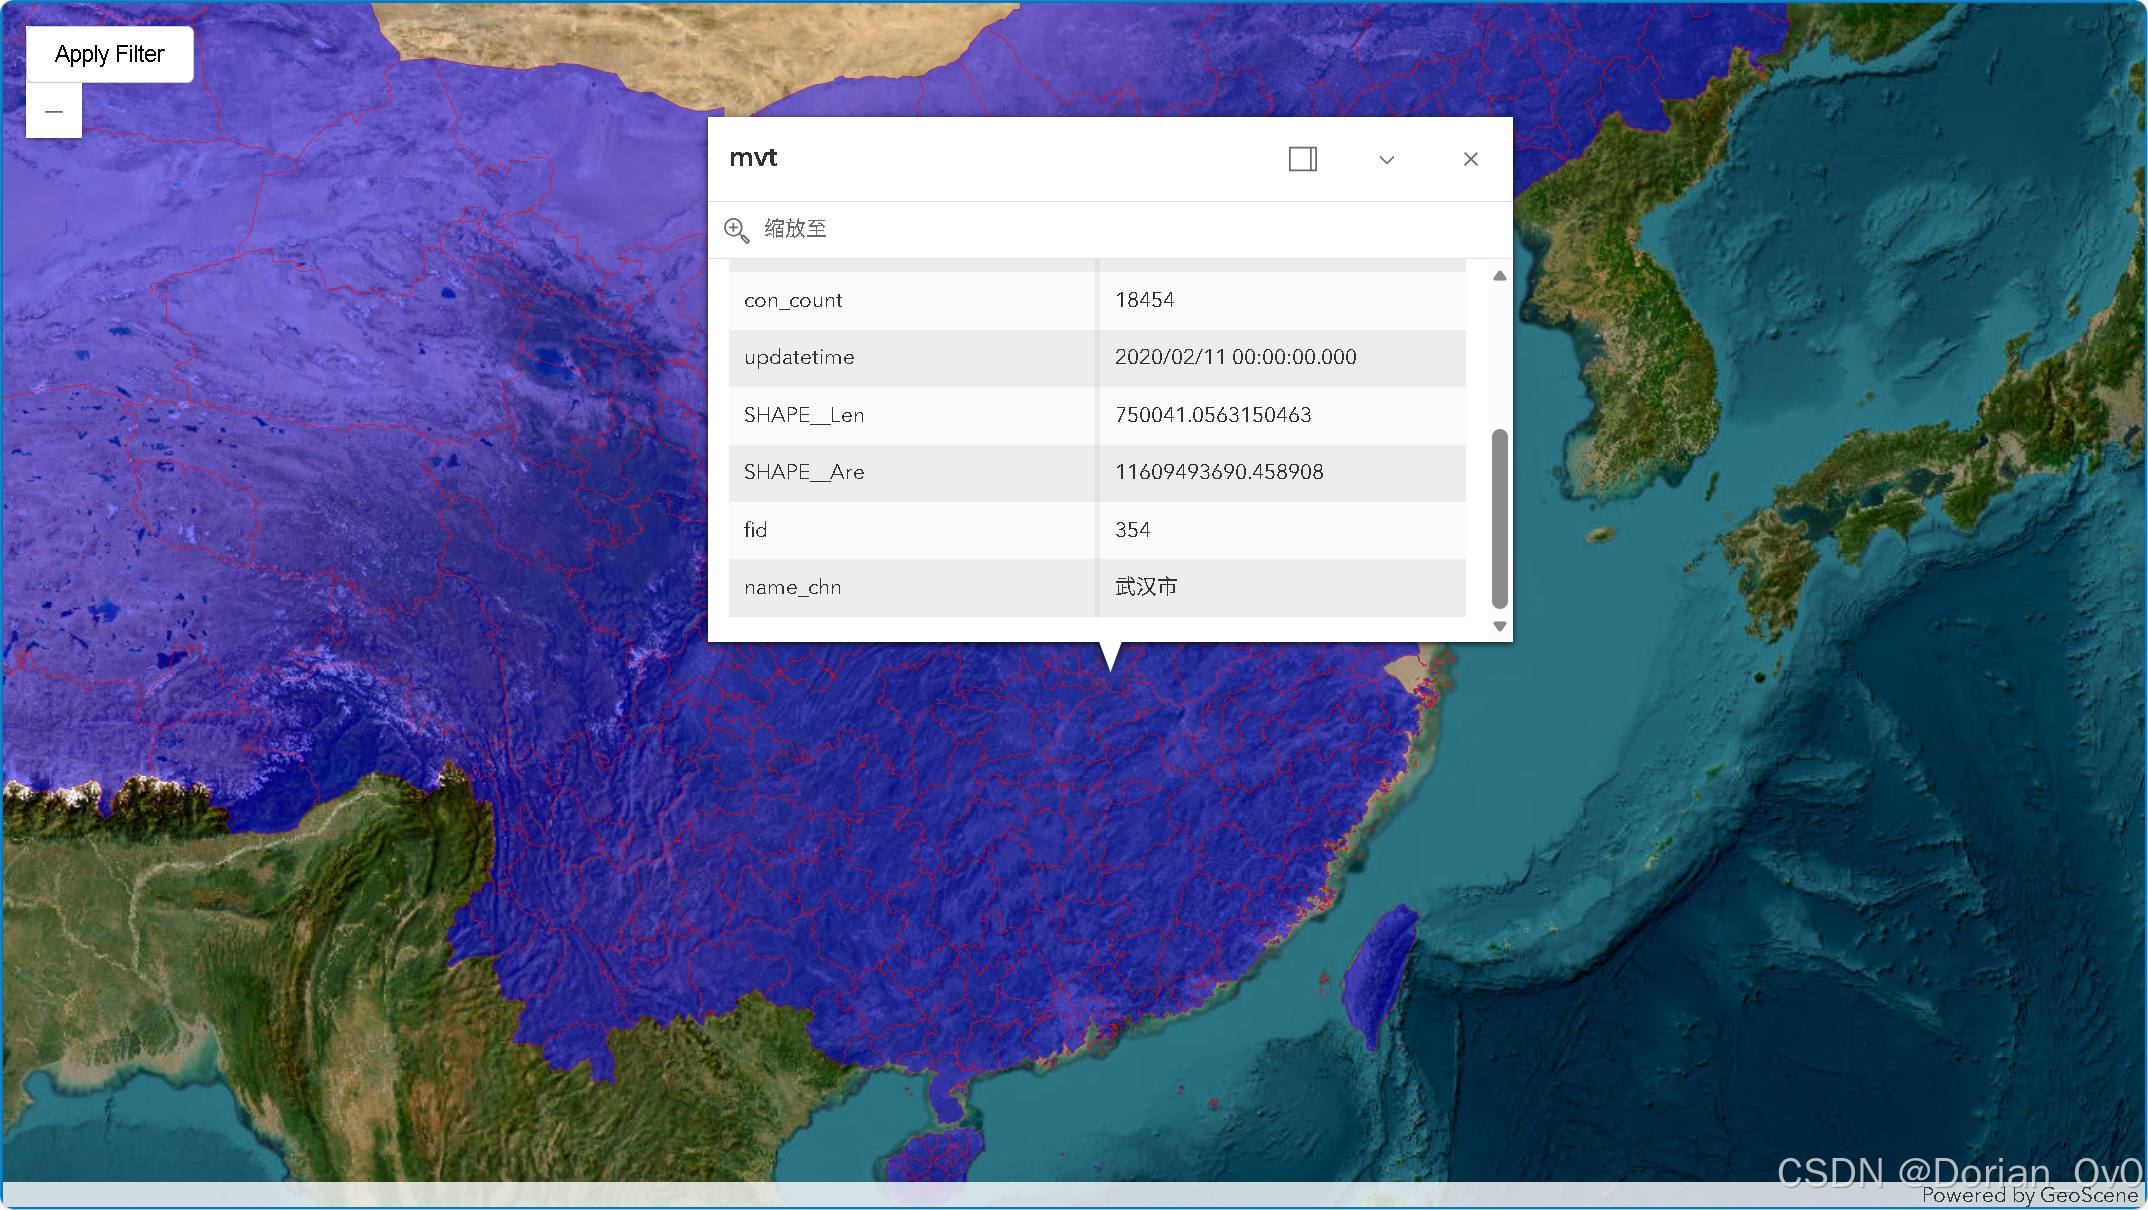
这个矢量瓦片支持点击显示弹框,CQL语句查询等功能,而且加载非常快,不会像GeoJSON那样。
接下来是使用ArcGIS(GeoScene) API for JS加载这个矢量瓦片图层:
html
<html>

<head>
    <meta charset="utf-8">
    <meta name="viewport" content="initial-scale=1, maximum-scale=1, user-scalable=no">
    <title>GeoScene Maps SDK for JavaScript Tutorials: Query a feature layer (SQL)</title>
    <style>
        html,
        body,
        #viewDiv {
            padding: 0;
            margin: 0;
            height: 100%;
            width: 100%;
        }

        .geoscene-ui-corner .geoscene-component.geoscene-widget--panel {
            width: 200px !important;
        }

        #add {
            position: absolute;
            top: 15px;
            left: 15px;
            z-index: 1;
            padding: 8px 16px;
            background: white;
            border: 1px solid #ccc;
            border-radius: 4px;
            cursor: pointer;
        }

        #add:hover {
            background: #f5f5f5;
        }
    </style>
    <link rel="stylesheet" href="https://js.geoscene.cn/4.29/geoscene/themes/light/main.css">
    <script src="https://js.geoscene.cn/4.29/"></script>
    <script>
        require([
            "geoscene/config",
            "geoscene/Map",
            "geoscene/views/MapView",
            "geoscene/layers/FeatureLayer",
            "geoscene/layers/WebTileLayer",
            "geoscene/layers/WFSLayer",
            "geoscene/layers/GeoJSONLayer",
            "geoscene/layers/VectorTileLayer"
        ], function (geosceneConfig, Map, MapView, FeatureLayer, WebTileLayer, WFSLayer, GeoJSONLayer, VectorTileLayer) {

            const map = new Map({
                basemap: {
                    id: "Arcgis-World-Imagery",
                    title: "ArcGIS-影像底图",
                    baseLayers: [
                        new WebTileLayer({
                            urlTemplate: "https://server.arcgisonline.com/arcgis/rest/services/World_Imagery/MapServer/tile/{z}/{y}/{x}.png"
                        })
                    ]
                }
            });

            const view = new MapView({
                container: "viewDiv",
                map: map,
                center: [114, 29], //经度,纬度
                zoom: 5
            });

            const parcelLayer = new VectorTileLayer({
                style: {
                    "version": 8,
                    "sources": {
                        "osm": {
                            "tiles": ["http://localhost:7800/public.%E7%96%AB%E6%83%85-%E6%97%B6%E9%97%B4/{z}/{x}/{y}.pbf"],
                            "type": "vector"
                        }
                    },
                    "layers": [
                        {
                            "id": "osm",
                            "type": "fill",
                            "source": "osm", // 确保此处指向上面定义的source名称
                            "source-layer": "public.疫情-时间", // 一定要指定postgis里的架构加图层名,不然加载不了
                            "paint": {
                                "fill-color": 'blue',
                                "fill-outline-color": 'red',
                                "fill-opacity": 0.5
                            }
                        }
                    ]
                },
                title: 'mvt',
            });


            map.add(parcelLayer);
            console.log(parcelLayer);

            view.whenLayerView(parcelLayer).then(layerView => {
                parcelLayer.popupTemplate = {
                    title: parcelLayer.title || "要素详情", // 若无标题则使用默认
                    content: (feature) => {
                        const attributes = feature.graphic.attributes;
                        console.log(attributes); // 控制台输出全部属性

                        if (!attributes) {
                            return "<p>无属性信息</p>";
                        }
                        // 构建表格形式的HTML
                        let html = '<table class="geoscene-widget__table">';
                        html += '<tbody>';
                        for (const [key, value] of Object.entries(attributes)) {
                            // 对 null/undefined 做安全处理
                            const displayValue = value == null ? "(空)" : value;
                            html += `<tr>
                                 <th class="geoscene-feature-fields__field-header">${key}</th>
                                  <td class="geoscene-feature-fields__field-data">${displayValue}</td>
                            </tr>`;
                        }
                        html += '</tbody></table>';
                        return html;
                    },
                    highlightEnabled: true
                };
            });
        })
    </script>
</head>

<body>
    <button id="add">Apply Filter</button>
    <div id="viewDiv"></div>

</body>

</html>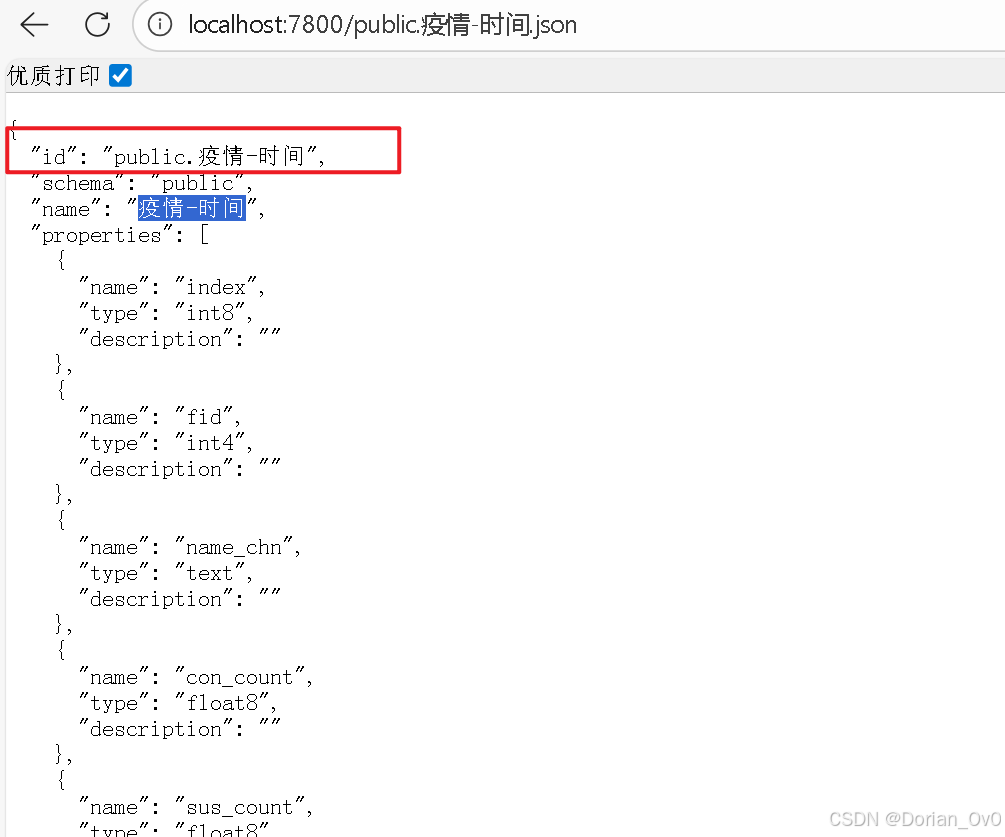
一定要注意代码里的"source-layer": "public.疫情-时间",,不指定它就加载不出来。
还有style里的"paint"字段,不同的类型几何图层(点线面)里面的内容也是不一样的。